It’s been a while since we last talked about what’s happening with public transport ridership and cycleway use so this post will cover the high-level results for both September and October. For PT we won’t see the more detailed breakdown of the numbers until the next AT board meeting in December.
Public Transport
September
- September had one extra working day compared to 2018.
- September was also considerably wetter than last year with 123mm of rain, 19% more than a normal September and considerably more than the 45mm the year before.
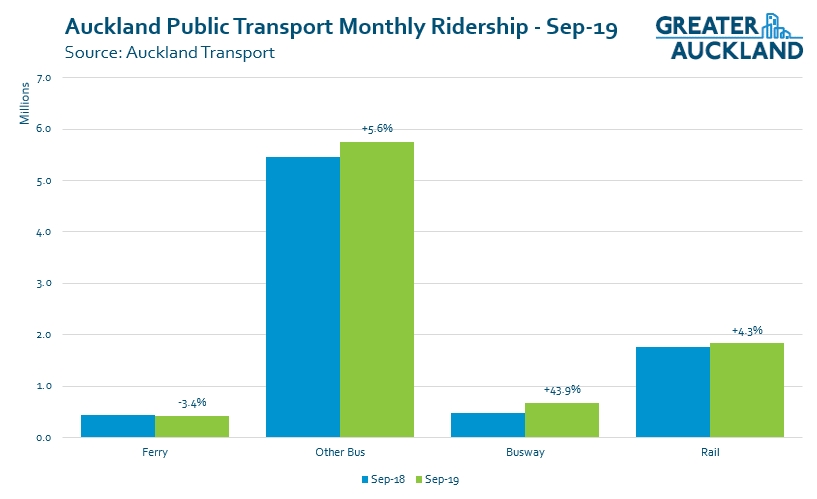
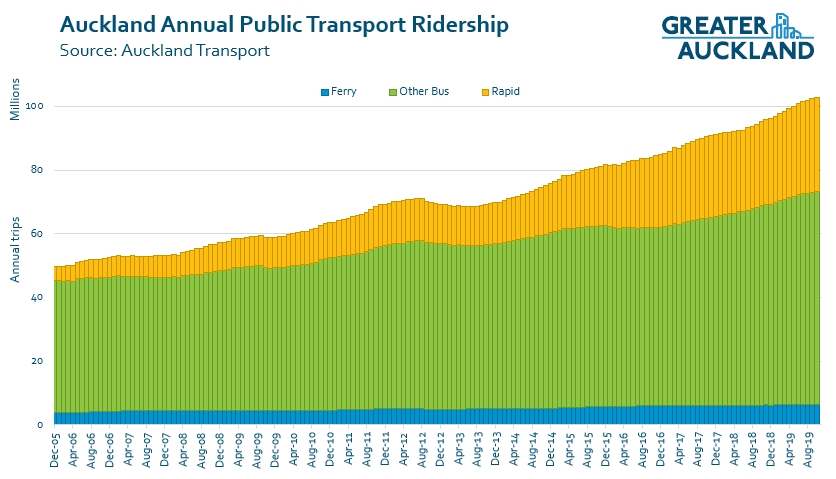
The extra working helped to push up the numbers for the month a bit with a total of just under 8.7 million boardings, an increase of 7.1%. On a 12-month rolling basis this was enough to push us over 102 million having only reached 100 million in May.
As we’ve seen for most of the year the biggest increases are coming through from the bus network but the biggest concern here is even with the extra working day, ferry usage still declined.
October
- October had the same number of working days compared to 2018.
- October was slightly drier than normal with 72mm of rain, 82% of normal, which was almost identical to 74mm the year before.
The last major change to the bus network rolled out to the North Shore on 30 September 2018 and so this October is the first month in the last three years where the numbers haven’t impacted by network changes and changes in counting methodology – this had resulted in some very high growth numbers, particularly with the Northern Busway where there were a number of months that saw growth of over 40%. As such the growth percentages have come down quite a bit form what they were with October seeing just a 3.9% rise in boardings compared to last October for a total of 8.94 million trips.
Like with September and even August before it, the ferries again saw a decline in usage. This is a worrying trend and I’m not sure what is causing it, for example Is it related to the downtown works making it harder to access the ferries?

Over the last six years we’ve a period of unprecedented growth thanks to changes such as Integrated ticketing and later integrated fares, rail electrification and as mentioned earlier, the new bus networks. That has seen annual ridership climb from 68.5 million trips in 2013 to 102.7 million trips as of this month. But with no major changes on immediate horizon that might help to drive up ridership, we are likely entering a period of much lower PT growth and so AT are going to need to work much harder on improving the customer experience if they want to keep increasing usage. The next major change/improvement isn’t until 2021 when the Puhinui interchange and early airport improvements as well as the Eastern Busway from Pamnure to Pakuranga are completed.
While the numbers are slowing down there is one small bit of bright news to highlight. The impressive growth that we’ve seen has been occurring faster than population growth but in some ways I had been a bit surprised that our ‘per capita’ growth had not risen faster. The ‘per capita’ metric is quite useful for gauging how much more useful PT is becoming and within Auckland but also as a comparison to other cities.
However, recently Stats NZ updated their population estimates (although still based on the data from the 2013 census) and that resulted in a significant change in Auckland’s estimated population with the total population for 2018 changing from 1.696 million to 1.618 million – a 77.5k decrease. What that means is our per capita metric was quite far off and so instead of being about 62 trips per capita, we’re actually up around 67 putting us much closer to the likes of Brisbane, Perth and Wellington. You can see the difference it makes in the graph below where you can also see we’re closing in even faster on this measure.

Wellington
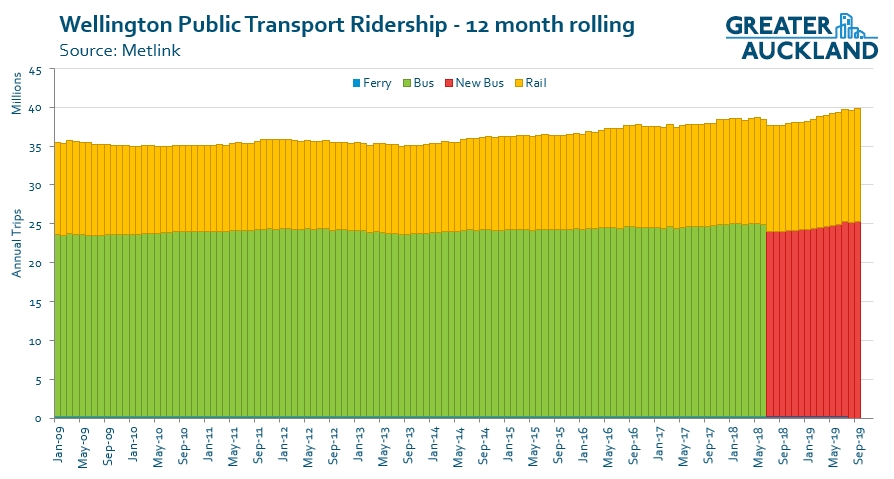
While Auckland’s growth is starting to slow down, Wellington has been seeing some good numbers come through. We’ve only got data till the end of September so far but that showed ridership up 8.2%. Importantly Wellington also passed a milestone in September with annual ridership passing 40 million trips for the first time.
 Cycling
September
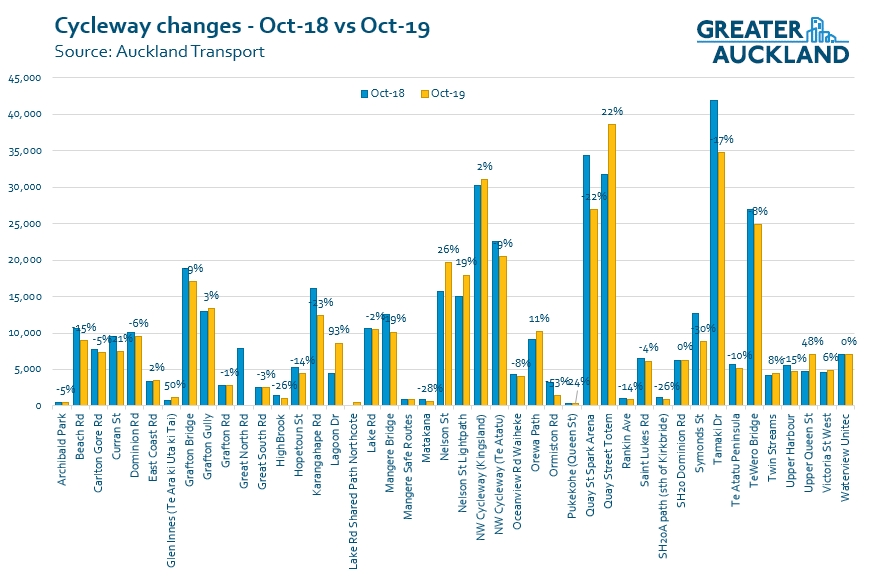
September was relatively similar to the year before with overall just a 1% increase in usage, although with some quite different outcomes for specific sites.

October
Despite conditions being similar to last year, overall cycling numbers for October were down 4.1%. Even sites that have been reliably strong performers, such as the NW cycleway at Kingsland, seem to have struggled for growth in October. The most notable difference is a big reduction in the numbers recorded along Tamaki Dr. Like the ferries, I wonder if that’s being impacted by the works on Quay St?

 Processing...
I’ve switched from ferries to buses recently. While the ferry is congestion free (speed advantage), it has a load of has lost its benefits for me.
Ferry vs bus comparison from Hobsonville to CBD:
* 75 minute ferry frequency vs 10-15 minute bus to Constellation
* Exposed upper deck and no air con vs relative comfort
* Fare $7.60 vs $6.30
* $1.95 bus transfer vs short walk transfer
The lack of capacity is the only thing they share in common
I would love someone to delve into those Wellington numbers. The numbers don’t tally with public perceptions (in Wellington City anyhow).
Seems like the new Wellington bus network wasn’t such a disaster after all. I fact it seemed to follow the usual pattern of bus network changes where a few existing passengers are worse off but a whole pile of new people start catching the bus.
As with the cycle routes: There was a lot of moaning on websites.
But of course; a lot of those are dedicated trolls running down anything they deem as “left wing” or “progressive”. Many of them don’t even live in Wellington…
The public perception in Wellington is dominated by people who lose out. Those who have benefited won’t be making the news. I suggested this to some people from Welly who were complaining loudly on Twitter and was told to “read the room” and bugger off. Basically, many of the naysayers don’t want to engage with the reality that Welly’s new network does actually offer decent benefits to some people. And that the main issue is the lack of drivers, rather than the network itself.
Definite improvement in buses for the overall Wellington area.. I live in Kapiti. The new buses themselves are a vast improvement.
Apart from driver shortages the three pinchpoints were: some Wellington roads being too narrow for big new buses- surprise!;
changes to some crosstown services involving students– tertiary and secondary– which may not have been advertised as fully as they should have been – probably through the schools and unis.
and third- confusion over the new Kilbirnie interchange. My impression here is that many long-time (elderly?) eastern suburbs bus users did not understand the role of the interchange. Again importance of saturation publicity beforehand.
Jeremy Smith, I think that’s a fair assessment. Wellington’s Eastern Suburbs seem to be generating most of the complaints, followed by Karori and Northland. In the northern suburbs the high-frequency No1 route has definitely improved things, though the recently slowed-down Johnsonville train timetable struggles to compete with this for Johnsonville-Wellington trips. From a personal point-of-view, the routing of our local bus (No 25) to Highbury instead of Strathmore where the route used to go, has destroyed our previously-useful 1-seat ride to the Eastern Suburbs and walking-distance of the airport. Grump!
Overall – I don’t think the bus-changes in Wellington have noticeably lifted the mode above where if was before, or encouraged any positive mode-shift from cars. The graph above seems to bear this out.
The scrapping of the 100%-electric trolleybuses and replacement with dirty old Auckland diesels was a sick joke. The promised new fleet of battery buses has yet to eventuate, and a shortage of drivers willing to work under the new conditions continues to hamper the system.
Agree. Relatively small number that are very vocal, some quite nasty too. Some also confuse driver shortage & PTOM contract issues with network design, they just can’t (or don’t want to) separate those. In the hypothetical case where there was no network design change, IMO those problems would’ve occurred anyway as the old network would’ve been broken in units & contracted under PTOM.
The total number of bus complaints has returned to around pre-new network levels, so most have got over it.
(Disclosure: I’ve benefited from the New Wellington Network. Frequency improvements, more capacity, more expresses, more evening/weekend services. Funnily enough, making more use of the buses too.)
The biggest issue that still grates on people in wellington is that there are over 80 noisy dirty old “Euro 3” buses still grinding their way through the Wellington CBD with little chance of replacement for at least another 2-3 years,….
The Regional council seriously over promised and then failed to deliver…
NZ Bus over promised and underdelivered. The sequel to the Wrightspeed debacle… GW made the mistake of believing them (again). Fools.
Still, better Euro3 then the parades of Euro 1 & 2 rubbish previously roaring up & down belching even more smoke. (My regular commute involves transfer: one leg is exclusively new buses the other mostly old clunkers, quite a contrast.)
Maybe new network rollouts are harder in places where many well off people catch the bus? The instincts of the new GWRC chair seem to be to roll the network back to how it was.
In saying that, other commenters are right to point out the various other issues around old diesels’ and driver pay.
This happens in my completely different field (software) too, and I bet lots of other areas:
— People disadvantaged by change lash out
— People advantaged by the change get on with their lives and say nothing, therefore discourse is dominated by the disadvantaged people
— People instinctively dislike change, so even people for whom the change is objectively neutral or advantageous often *feel* disadvantaged and respond accordingly
This rubric explains a lot of phenomena (e.g. why Facebook looks ancient).
The reality in Wellington is of course that the new network is a mixture of the good and the bad, and people respond accordingly. The introduction of the network was catastophic for many people, as the hundreds of people who turned out on cold winter evenings to vent their spleens testified.
Some of the continuing issues are operational (e’g. driver shortages), but there are still many structural issues (as GWRC has recognised with its detailed review, due to be reported back to GWRC on 12 December). These are not distributed evenly: they are concentrated on areas where frequencies have been reduced, where transfers have replaced through routes (and a third of the new hubs are not complete, even now), and where the services are operated by old dungers (many of them Auckland’s cast offs). Where these factors combine, such as in the eastern suburbs* (declaration of interest: that’s where I live) there are continuing and justified grievances. Dismissing them as “dedicated trolls” or “that they don’t want to engage with reality”, or that they involve “small numbers” (complaints are running at double the level that they were under the old network), are, sadly, patronising nonsense. The reality for these areas is that the current network is significantly worse than the old one – overall fewer buses going to fewer places less often, less reliably, and often packed to the proverbial gunwales.
That is of course not the experience of the many people who have benefited (declaration of interest: my closest bus route now has the best service it’s ever had), but that’s small comfort to the many people who are who are worse off.
*e.g., off-peak CBD-Miramar peninsula frequencies reduced by 50%; a third of the network’s new hubs in the area because of truncated routes, and one of those still not complete; NZ Bus services operated by vehicles up to 15 years old and showing their age, which won’t be replaced for another couple of years.
Thanks for the insight. Yes didn’t help the launch starting off in winter either. I would guess weekend & night services have increased though for some of those less frequent ones you talk about (perhaps at the expense of the peak and/or day times)?
Ferry fares are simply too expensive and many services aren’t practical for many due to low frequency.
AT really needs to take over all ferry services (a la buses) and the government needs to amend legislation to allow that. Fullers can be an operator just like anyone else and doesn’t need protection particularly on Devonport!
We need smaller and faster ferries for many routes and larger ferries on others. Reliability has also been a problem for many ferry services.
Why smaller ferries? Surely we need bigger ferries?
Smaller ferries running more frequently would be more competitive with other modes compared to the status quo.
They’ve been moving to smaller more frequent ferries on the Waiheke route. Generally good, but there are two drawbacks: 1) Less or no room for freight; 2) Not so great in the occasional high seas.
AKLDUDE’s called for smaller and bigger, depending on route. To match the demand.
I’m sick of the noisy ones; I don’t think the noise rules are being applied, and it probably comes down to pushing a boat with a too-small engine, at an inappropriate speed. So getting the size of the boat right make sense to me for two reasons.
+1 Heidi exactly right.
Noise is an issue as are disgusting diesel fumes (which can make anyone feel seasick).
For Devonport I’d like to see 2x 250 capacity faster ferries operate rather than the 400 seat Kea (loading/unloading times faster and a slightly faster journey time too, coupled with less waiting around (15 min frequency rather than 30) means each passenger would save a minimum of 3 minutes and up to 34 minutes.
What was the news about two new ferries I saw the other day (Waiheke & Devonport use mainly), are they just now in service or have they been for quite a while or coming soon? I remember the article didn’t make that clear.
Being as Ferries biggest cost is fuel and staffing, would be great to see AT/Fullers try and make some headway into Electric & (semi) autonomous ferries. Surely they are the best mode to experiment with considering they should be same route each time and no pedestrians?
For me it really is the best way to travel..
Did you see this, Joe? https://i.stuff.co.nz/auckland/117330516/electric-ferries-aucklands-firstbuilt-in-water-in-2021
Interesting to see that ferry companies are investing in electric ferry R&D: Fullers in Auckland & East by West in Wellington.
A recent article (link below) said the expected savings for the new Wellington ferry were ~$300k pa in fuel & maintenance. That’s for a slightly bigger boat too (135 pax compared to 99 (Cobar Cat) or 91 (City Cat). The concept render for the Auckland ferry looks similar sized to the Wellington one.
https://www.rnz.co.nz/news/national/403004/electric-ferry-under-construction-for-wellington-will-be-first-in-southern-hemisphere
Why not hydrogen. Would seem great way to get infrastructure built too for supporting alternatives to electric vehicles.
From cycling perspective – perhaps the works around K’rd are affecting some people? I had to change my cycling route as the current arrangements on K’rd (one narrow eastbound lane from Symonds towards Pitt st) make it dangerous and slow.
I know AT takes more detailed information about cycling from time to time, eg mix of gender and age? – I’d be interested in seeing it. I’ve been tracking the number of people I pass on the NW cycleway between Rosebank Rd and Waterview as I head towards town at evening rush hour. I do the trip at that time just on Tuesdays. Recent counts:
22 on 29 October
28 on 12 November
39 on 19 November
(I’m not suggesting this is a trend, there’ll be a lot of noise in such data). My son usually notices other things – like tradies with toolboxes, or proportion of e-bikes, or speeds. Yesterday he noticed that only 4 of the 39 were women. He also noticed that almost all of the pushbikes (as opposed to ebikes) were ridden by young men.
The weather was pretty cold in October. Now that the weather is nicer the NW cycleway is suddenly much busier.
The section near town has got even more hazardous.
The works at the end of the pink path have meant that I’ve changed my route to Upper Queen-K’Rd-Pitt St, and Pitt-Mercury Lane. I doubt I’ll ever use the pink path again.
With the increased frequency in NX1 and NX2 buses I’m not surprised fewer people are using the ferries in particular to Devonport. The window to connect with a bus once you get off the ferry is so small that it is a known issues. I got caught out only once and it certainly made the bus a more attractive option for my next trip to visit my brother.
I found the staff at each of the crossing on Quay Street meant the roadworks didn’t influence my decision making process as all. I had to cross the road twice whether I was transfering from the train to the ferry or to the bus.
“AT are going to need to work much harder on improving the customer experience if they want to keep increasing usage.”
I can think of lots of things that would make trips easier and stop putting people off taking public transport. But I don’t think I’ve ever been asked. Is it time for AT to start doing some basic research, or have I just missed it?
Yes you have just missed the research. I was on the Eastern line last week and a survey company was conducting a survey for AT.
Why would you conduct a travel survey in the middle of the school and university exam period? The results are inherently going to be biased if you try and apply them to the general PT experience of the year…
They do surveys on trains at a number of different times during the year. Getting data during the holiday and exam periods is as useful as at any other time when you do get all times covered.
It’s really not. It’s not surveying the general usage because at that time the users have undergone a structural change.
If you want to find out what customer satisfaction or whatever is during just those periods. Fine. But otherwise it’s exactly the same problem that explains why you can’t look at the All Blacks to determine the average height and weight of NZ men.
The way I read the comments earlier is that we’re trying to understand travel as a whole rather than just reporting monthly satisfaction.
Maybe it’s deliberate if to compare the results of holiday/exam period vrs normal everyone at work or study.
Some silos are doing research while others are steadfastly refusing to listen to complaints and unsolicited constructive criticism.
Yesterday AT knowingly left the intersection of Pt Chevalier Rd and Great North Rd – the one I’d blogged about as being dangerous for vulnerable users – with traffic lights working for traffic but not for pedestrians. All day. First reported, apparently, at 8:10. Working again sometime between 7 pm and 11 pm. Yet there was nobody posted there to help pedestrians across. Not even at the time the kids were walking to and from school.
Yet who their would take on board suggestions that this should have been dealt with differently? What are the chances of getting recognition from AT that this does not fulfill their role of ensuring the transport network is safe?
Of course people drive their kids places instead of letting them take the bus when the state of safety for the kids walking to the bus is so appalling.
Yes, I suspect we will only see improved PT ridership before some of these big projects get completed will be with small fixes and improvements.
Still think AT need to work harder at these small things like signage, shelters (not that small $ wise I know), bus stop spacing & placement, bus priority measures. Timetable fine tuning, better information boards. More Top-Up locations & tag machines. Improved active mode access & storage near hubs & even normal stops. Track & signalling improvements/repairs sorted. Newer buses coming on board, seems some old dungers still about here & there.
Cycling probably plateaued due to no real network improvements for a while & disruptions & changeable weather. Perhaps so much bad press on dangerous incidents, accidents / deaths too putting people off.
Ferries – yes the right craft fit for the route & ridership.
Re the Wellington network issues. Unless the driver shortage is not improving I can only see things looking better for them. Eventually they will get there better buses & other teething issues ironed out.
Transmission Gully will be a massive,subsidized incentive to drive for the kapiti folk. It will entice people to live further away too. I don’t see it as being particularly good for the regions public transport usage.
Rightsizing is definitely the term. Big ferries for peak; but also more smaller and medium sized ferries. Then it’ll be easier to match capacity to patronage as it varies over time (expect increase in frequency to induce demand).
Plus all the ferries look very unique and bespoke, surely there’s efficiency in having a more standardised fleet?
Well said Grant. if there are not going to be any improvements to the running of the network itself, then there need to be improvements to access and usablity to get more people onboard. That goes further than just on the network itself – things such as dedicated bike lanes, bike parking so people can safely ride to their nearest interchange, changes to traffic lights and traffic islands so people can safely walk etc etc… in fact this whole Blog post goes well with the post on Copenhagen – ie: AT need to take an entire network approach where the safety and convenience of people has priority over simply moving vehicles.
Is there any suburb level info on the per capita PT usage? It would be interesting to see various sections of Akld/Wgtn broken down into who is using PT how often.
The census captures some of it. The 2013 census asked about how people got to work.
I’ve tried to render that on a map before…
https://1.bp.blogspot.com/-itHZ_fIH1xs/XBzP2vuZuTI/AAAAAAAADVU/A-tQa4pHgVoG_cjksClGyBzByWbQCkSLACHMYBhgL/s1600/public%252Btransport-2013.png
The main flaw of that map is that it doesn’t show population density. Eg you get the impression that there is a blob of high PT usage in New Lynn, but that is an illution — in reality there is almost nobody living in that area unit (even in the 2018 census data).
(and for those looking at Devonport: ‘ferry’ was not in the list of answers)
The last census asked a bit more generally how people get around but AFAICT that data is not out there yet with this level of detail.