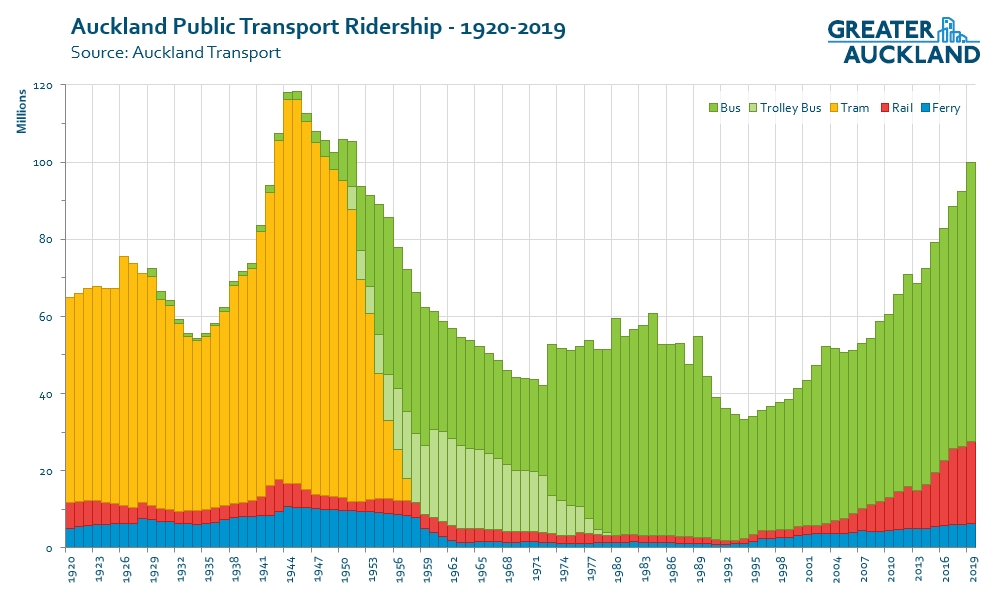
Earlier this month Auckland hit a major milestone, passing 100 million trips within a 12 month period, bringing us back to the number of trips we had in 1950, a time when the population was just 350k people. Still, it’s an impressive milestone, especially when you consider that it just a decade ago there were fewer than 60 million trips.
Given all the improvements underway, this should only increase in the coming decade and if current trends continue, and assuming the rail network doesn’t keep breaking down, the next decade will see us pass 150 million trips. That’s impressive given where we’ve come from but how does it compare to other cities?
For some time now I’ve been collecting data on many cities around the world with a focus on those from Australia, Canada and the United States as they tend to be the cities most similar to us both culturally and developmentally. However I’ve also started collecting data on some European cities.
First, a few comments about the data.
- For Auckland I’ve used 2019 figures as a more accurate representation of where we are. I’ve also included figures for 1999 and 2009 for comparison purposes.
- The usage data comes from official sources, for example from annual reports of the operating organisation. I also have it by mode and in many cases by month too.
- For population I’ve generally used metro-area figures and not those of a local municipality.
- Where possible I’ve tried to compare boardings as that’s the most commonly reported metric. It is the European cities where I’m less confident and if the data is journeys (and I suspect some are) then some of the figures could be a bit higher.
- There is an issue with using boardings though and that is they’re highly impacted by fare structures. For example, Vancouver had around 435 million boardings but they’re one of the few cities to also report on linked journeys, which totalled 261 million. That means their average boarding per journey was about 1.66. It appears the other Canadian cities have high boardings to journeys ratios too. By comparison, Auckland has 100 million bordings but about 84 million journeys for a ratio of about 1.2 – this has been rising since the new network.
- There are some cities that I have data for but aren’t shown on the chart because they’re very big cities and/or have very high levels of PT use. Examples of each of these include Los Angeles (population) and Zurich (usage).
- If any of the data is wrong, please provide me a link to accurate numbers so I can correct it. Also, I’d love to add more cities to the graph so if you know of sources of data for other cities, please provide links so I can include them.
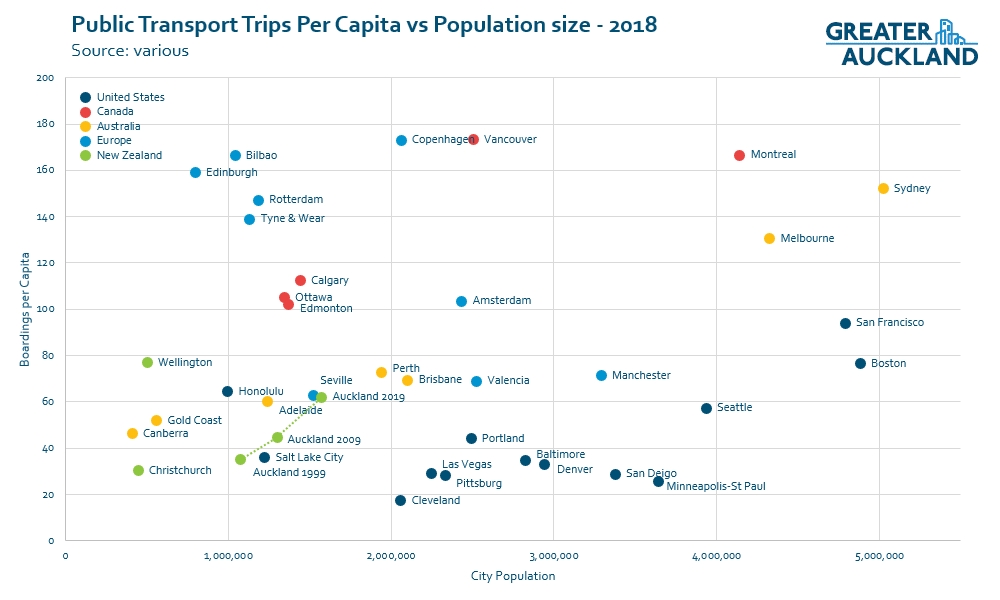
As you can see, Auckland has come a long way over the last decade or two and on a per capita bases we’re getting into the territory of, or have even surpassed, many of the cities we have looked to in the past for inspiration of what to do. This is particularly the case for the US cities, most of which have seen PT usage decline over the last few years while population has kept on increasing- Portland is a prime example here.
Thinking about the future and all the growth we should have over the coming decade as improvements come on stream then by 2029 we are likely to be seeing around 80 boardings per person. At that level Auckland’s numbers start to look much more respectable.
Just to further highlight how Auckland is changing, this version of the graph below shows how a few of the selected cities from above have changed since about 2010. Some, like Christchurch are understandable but others show many cities PT networks simply aren’t keeping up with population growth and/or have seen PT use decline.

It’s also worth reminding that most public transport is free this Sunday to celebrate reaching 100 million trips. Also, since it was first announced, AT have said that free travel now apply to Waiheke buses and Fullers will offer it to holders of a Waiheke monthly pass holders, 10-trip flexi pass or 40-trip ticket.
And if you’re really inclined, some are taking the opportunity to run an Auckland Transit Challenge, travelling across the region all on public transport. See tweet below for more details.
https://twitter.com/urbanistfromwhk/status/1140869907682213890

 Processing...
“the graph below shows how a few of the selected cities from above have changed since about 2010. Some, like Christchurch are understandable”
Well, that’s an oversimplification of what is going on in Christchurch. Fact – we had an earthquake. Fact – we had around 37 boardings per annum in 2010 pre-earthquake and this recovered to around 30 boardings by 2014 (i.e. post-EQ).
But it’s also fact that the central city has really got going again since about 2014, and despite that boardings have been falling since then. Right now, we sit at below 27 boardings, i.e. we lost 10% patronage during a time of strong recovery. Pre-EQ, we had 50,000 jobs in central Christchurch and as of now, that’s back at 35,000 (and that is a lot more than it was in 2014!).
It’s also fact that we had commissioners in place put there by the National government who were tasked with saving costs and getting the fare recovery rate up. Their measures started to be implemented from late 2012 and were done by 2014. And that, I suggest, is the underlying cause of declining patronage over the last five years.
Let’s not forget the thousands of people who lived in the red zone, close to the CBD, who now live in Rolleston, Ashburton, Prebbleton, etc. Many would have switched to cars, as no rail or attractive bus services were put on in conjunction with the mass relocations.
Labour promised a $100m commuter rail service, but have failed to even carry out a study let alone proceed to implement it. It would appear they lied.
Geoff, Labour promised to make the money available for rail. It still is available. The way this works in NZ is that the regions need to put a case to government to get the funding. Canterbury isn’t doing that.
It’s disingenuous (even wrong) to say that Labour is breaking their election promise. It’s the regional leaders that are failing us.
That was not a real lie, just a politician’s exaggeration. If you think election promises are based on good faith to carry out the promise then you will continue to be disappointed. A politicians promise is in fact a lie. It’s a promise made to fool the weak minded and gullible to garner votes for the liar. When the liar is eventually called to account they will usually deny the promise was made, say it was contingent on other factors not originally stated when the promise was made or accuse their detractors of exaggerating the scope of the promise, or blame department minions for failing to fulfill the promise, or pass blame to local govt for somehow not being on the ball.
Jacinda Ardern never had any intention of keeping her promise to have light rail in Auckland within 4 years, even just the cbd to end Dom Rd section.
Chistchurh PT promises are no different
I disagree re Light Rail – and it was JAG’s promise anyway. It could have been done, the design was far enough advanced for a D&C contract to have been let, but the big roadblock has been the NZTA’s unwillingness to advance the project without going back to square one, which appears to be where it’s at currently. Some say they are just delaying until National gets re-elected (whenever that may be) so it can be cancelled. It should never have been given to them TBH.
“the design was far enough advanced for a D&C contract to have been let,”
Usually D+C contracts in New Zealand are only issued after consents are granted. Light rail was a long way from that.
NZTA are being useless on light rail, but let’s at least be realistic about how bad it is.
I think the problem for Greater Christchurch is no one at central or local government has clearly articulated what the spatial plan is for Christchurch should be. Axel, me and others in CHAT club have put a lot of work into this examining this issue. Conducting public workshops etc.
Based on these workshops I have proposed a Hand shaped rail spatial plan.
https://medium.com/land-buildings-identity-and-values/can-the-hand-solve-christchurch-s-fat-banana-problem-556610062166
Have you looked at how the hand-shaped pattern dovetails nicely with the Pattern Language “Fingers of Farmland”, Brendon?
No Heidi. Do you have a link?
I used to have a link to the full text online but can’t seem to find it. If you can’t find the book in your library, let me know and I’ll scan that pattern for you from my paper copy. It’s “A Pattern Language” by Christopher Alexander, and the pattern I’m referring to is called “City Country Fingers” and is number 3 (of 253).
It starts with the problem of “Continuous sprawling urbanization destroys life, and makes cities unbearable. But the sheer size of cities is also valuable and potent.” It basically suggests we keep interlocking fingers of farmland and urban land, with the farmland in the valleys and the urban parts along the upper slopes of hillsides. It suggests everyone should be within 10 minutes walk of farmland. We won’t be able to achieve that, but we can certainly do what we can and your fingers seem to be a step in the right direction.
Pattern Language +++
Thanks so much, Matt. What an incredible amount of careful work you must have put into creating these graphs. Wow. And long may the rise continue.
Interesting, isn’t it, how important public transport boardings can be similar for cities that I would’ve thought had quite different urban forms (eg Vancouver and Copenhagen, Edmonton and Amsterdam). It would be tempting to compare the cities with similar boardings per passenger figures to see what the rest of the transport modeshare is made of – and then see how that relates to health and environmental outcomes.
Those graphs show that pretty much across the board PT trips have declined with population growth! That doesn’t stack too well for climate Change and Carbon Zero..Is it correlated with fuel prices, or have fuel prices increased?
This is why the active modes are important to tie in somehow, too. There may be cities there where improving urban form and infrastructure shows up in a slight boardings per capita rate but in a much better active modeshare.
I imagine there are quite a few cities where there are two halves to the city – the regenerating centre and suburbs where PT and active modes are improving and an outer doughnut of car dependency that’s spiralling out of control. The data really needs to be separated.
Heidi, you are right that it is the total picture that is important, but regardless of whether PT or active modes are increasing it is vital that car mode share is reducing.
I may have posted this table before, but it is evident that Amsterdam achieves low car mode share because so many bike. Other cities achieve low car mode share in other ways.
https://en.wikipedia.org/wiki/Modal_share
Amazing work Matt. I know how useful this data is and also how time-consuming it is to collate.
I suspect there’s as much effort and knowledge in these few graphs as many masters theses. (Side note: you should write one on this very topic).
Main messages I take from this:
— levels of PT use tend to increase with city size
— levels have generally decreased in last decade
— auckland and vancouver are the notable exceptions
— in next decade akl will approach pth / bne / wgn now
beyond that there’s a huge opportunity in the australasian context: akl could become a medium-sized city with the best PT network. Less than Mel and Syd of course, but at half the size with other attributes that people may value.
The productivity boost will attract more businesses and people. Projects like Regional Rail will become more important to increase proximity for the regions.
Exactly. Auckland can be one of the best small cities in the world. And this massive improvement in our PT networks is a huge part of fixing the weak economy, poor urban form, and inequitable distributional effects of the attempted motorway city of last century.
Yeah I’m incredibly optimistic that if we can keep up what we’re doing we’ll end up one of the worlds great small-medium sized cities.
Our abymsal post-war history on PT might ultimately be a positive thing (for our descendants). We hit rock bottom and we don’t every want to get back there and so as a result, I feel we’re putting more effort in that many of those comparator cities.
To be great, AKL needs to tackle not just transport but housing too.
Yes. And to be great, Auckland needs to be able to respond much more flexibly to systemic problems that leave people in need than it has. In transport, housing, environment and society in general. We need to scrutinise what’s held us up from fixing things, and take measures to remove those obstacles.
At the moment, I see Auckland moving in the opposite direction: numbness to need; self-entitled anti-social behaviour like parking illegally everywhere and driving obnoxious vehicles; a willingness to take sides before considering evidence; a refusal to accept evidence if it could possibly require personal change or bring shame.
The number sounds awesome and it is heading the right way ever so incrementally but the roads and motorways during our ever growing peak periods say something quite different. Traffic growth appears to be outpacing PT growth with consummate ease and that is surely down to the hardcore investment in roading infrastructure, something PT can only dream of.
And one assumes from the graphs that PT is in a pretty sad state worldwide if we are a good example.
On the 19th of June this year councillor Chirs Darby waxed lyrical “The whole bus network has been improved and we’re seeing substantial lifts in patronage. We’ve just reached 100 million public transport passengers in the last 12 months,” he said. This was in response to a TomTom research that showed increased travel times in 2018 by 29% but a slight improvement on 31% in 2017 where Darby said a sustained effort to convert drivers into public transport users was behind the improvement.
And it is this that worries me. With the sole exception of Auckland’s vastly improved suburban railway, politicians think that tinkering with what we have had since the 50’s has delivered, hallelujah, praise the budget PT Gods. The public will be fooled that we are doing everything we can. That more of the same shuffling the deck chairs will achieve something genuinely meaningful. It has and will not. It is in the right direction but only ever just.
We are the 3rd most expensive to use PT, cheaper than London but whose PT is light years beyond Auckland’s wildest dreams. We are the second most congested city in Oceania and anyone who drives these roads knows it.
I await with bated breath a genuine step change in PT that tries and should address the problems we have getting around this city. Part of that has happened with the regional fuel tax but there is not a whole lot to show for that over the past year. But until that day the likes of Mr Darby have got nothing to gloat about.
Waspman
The points that you make are absolutely right and particularly that traffic growth is outpacing PT growth.
When time allows I will talk about Europe and particularly the EU because this is where real change is occurring. It is occurring because of the requirements that are placed on the member countries. I have often quoted Vienna with their PT growth of 3% off a base of 950 million trips, but the expectations of the SUMP plan in Milan are just as ambitious.
I don’t believe that Europe can be dismissed simply because it is said to be at a different state of development. It is at this stage because of the way that they have approached public transport, often over extended periods. There are often vast differences between cities; Milan where there is a PT/walking focus and Rome dominated by the car.
Sydney is achieving good things in the emissions area and perhaps some of that is driven by PT.
As you say there is nothing to gloat about 100 million trips; and like you, I worry that if Perth, Calgary or Ottawa are our aspirational targets then Auckland will never achieve the emissions reductions that are necessary.
There’s not enough low-hanging fruit being picked, like bus lanes and bus priority, leading to shorter travel times and better frequencies for the same investment; priced parking and parking levies and removal of parking to provide better amenity for other modes; simple wayfinding (like having ONE name for the train line that goes out east! and pedestrian improvements to help people get to the stops.
So let’s point out the councillors who are consistently hindering these things. Who can criticise a councillor who may not be on the right side of every single issue, but on the whole comes out as one of the best.
Why not criticse the councillors who are on the wrong side of almost every issue? Like those who try to stop those transport improvements, and especially those who prioritise “heritage cityscapes” over our being able to provide housing for families and young people in the well-connected places with amenity they have been priced out of.
Heidi
For the sake of clarity – my response was not intended as a criticism of Chris Darby, but rather that no one should rest on their laurels because we have hit 100 million
Well, I think Darby is showing pretty fine leadership here:
https://m.facebook.com/DARBYatCouncil/posts/2335510946509457
Heidi; Darby just opportunistically used some minor drop in abysmal traffic stats to politic. It was amateur hour really.
But I’m all ears for someone to identify those recalcitrant politicians other than the obvious like the entire National Party who drag the chain on improving PT.
He has been having a go about people renting garages to live in as well. Ignoring the fact that without garages the people would be living in cars or bus shelters.
Its looking painfully obvious that the LR policy/promise was something made up on the spot with no idea how it was going to achieved, something to cling to when the polls were sinking and Jacinda and Labour were desperately trying to make up for 3 years of policy torpor, anything to kickstart their up until then dying campaign to at least stop the rot, but probably not get them elected. More fool them and us.
Having said that, a modest plan using the fastest means of implementing that plan was what was in order. Tracks being laid by the next election, a sure sign they meant what they said, a reason to give them 3 more years to finish the job.
Phil the announcer told us the funding was there. But for reasons only known to Twyford a huge spanner was thrown into the works involving some fantasy underground project with the NZ Super fund. Like where the hell did that come from? Now the entire project slowly but surely has worked it’s way into a dead end.
And this is what gets me. After the spectacular Kiwibuild failure of non delivery where Twyford was telling all and sundry everything was fine we have the MK2 version, the failed LR project.
He can’t afford another melt down like that because their credibility is really taking a hit, but Phil just can’t see it.
Make no bones about it, this project is now practically dead and if National get in its definitely history.
Twyford is a classic candidate of the Peter’s Principle, a guy who was effective in opposition as a critic at his natural level but when it came time to promote to the next rung on the ladder as a doer and a minister its become obvious he reached his “level of incompetence”!
“Traffic growth appears to be outpacing PT growth with consummate ease” – remember that the plots above show usage PER CAPITA. So, over roughly 20 years Auckland’s PT usage per person has pretty much doubled. Meanwhile, looking at MoT data on vehicle-kms travelled in Auckland region (dataset RD008), I see that in 2000/01 it was 3792 million km, while in 2016/17 it was 5028 million km. So yes, in absolute terms, motor vehicle growth in Akld has grown – by about 2.0% pa over that period. And given the population growth over the same period, I’d suggest that per capita vehicle growth has actually declined…
There is a graph in the following link that based on Census 2013 data “Wellington” only became bigger than “Christchurch ” at the 67km radius mark. This rightly (in my opinion) questioned if it was genuinely measuring an urban area.
https://talkingtransport.com/2018/10/04/different-cities-different-shapes-1-5-2/
Oops that was meant to be a reply to the below discussion on how to measure the size of Christchurch and Wellington.
Phenomenal graphs here, Matt!
Especially the trending over time, really effective at showing the improvements (or otherwise) in comparative cities.
Would be interesting to see the journey’s data, though the methodology differences would muddle it a bit I’m sure.
Very interesting that Auckland have tracked so positively compared to most other cities (Vancouver the only exception). I’m sure there are some initiatives there that we could look closely at to boost ridership.
One example is Vancouver’s PT operator’s partnership with UBC, which makes it part of university fees to buy a semester-long unlimited PT pass (for only ~$90 CAD). Since their network is so well connected with their frequent trolley buses ‘ribs’ tying to their rapid Skytrain ‘spine’, the unlimited PT pass is an absolute bargain for those who use it, and a massive cash injection (there are 60k students!) for the PT operator every semester to further improve the network.
Once Auckland’s network has a wider catchment for the rapid & frequent lines (i.e. CRL, city-Mangere-airport LR, Northwest LR, Northwest-Southwest connection, AMETI’s panmure-botany-airport link) then this sort of partnership might be really beneficial for the student population (and the rest of us) in Auckland too!
Thanks
There were some other cities growing in the data but they were already off the chart to begin with.
Isn’t it great that Waiheke buses (and to a very limited extent, ferries) are now being included in free public transport day, as mentioned above? They weren’t included in the last one, and they weren’t going to be included this time, but Fullers has been getting some bad press for the recent service failings (which are continuing), and AT, Councillors, the Mayor, the Waiheke Local Board, the Waiheke populace, and others have gathered together to request that NZTA start the process of bringing the Waiheke and Devonport ferries into the Public Transport Operating Model (PTOM). There’s some information and a petition here: https://www.change.org/p/transport-minister-hon-phil-twyford-let-s-bring-fullers-into-line. It’s working so far…
fraggle , I just hope they don’t check peoples passes randomly for the ferry as my 10trip pass has no money left on it right now and nothing to put on it for the next 2 weeks , and I would not want to be stranded on the wrong side .
Every time I see the chart of Auckland’s patronage over the decades I wonder about the source of the data. If the older data relates to the publicly-operated services that existed in the old Auckland Transport Board days (which is preserved for posterity through the NZ Government Yearbooks of the time and therefore very easy to access), then it may be UNDERestimating the trips in those days. There were a whole raft of other operators within the Auckland area (Commercial Bus Co, North Shore Transport, Auckland Bus Co, Whenuapai Bus Co, Howick Bus Co, Eastern Buses, Birkenhead Transport, Passenger Transport Ltd and probably a few more) that were privately owned and operated in a non-PTOM environment, and whose data was not, to my knowledge, reported in these stats.
Given the heavy reliance on trams to make up the numbers in the chart in the late 1940s-early 1950s, and the fact that the ATB still had its own sizeable fleet of diesel buses, then the private bus operators may well not have been included. Now, of course all the region’s operators are included in the AT stats.
If that’s the case, and the stats are indeed drawn from this dataset, then we may STILL have some distance to go to before we match the heights of the 1940s-50s in gross patronage – and a huge way to go to match their passenger trips per head of population marks.
Does anyone know the basic data source? I believe the comparisons were produced by AT, but how did AT originally pull them together and from what sources?
I agree with you.
Another bus company from the 1950’s to early 1960’s was the Green Line bus company.
From memory they differed from other services in going
crosstown, as in from Pt Chevalier to somewhere (?) in South Auckland.
Hi, I can confirm that the numbers prior to 1963 come from the Yearbook of NZ – most yearbooks gave specific data for Auckland tram, trolley bus and “motor bus” and this has been collated back to 1925. Ferry data 1920 to 1945 is for the Devonport ferry only. Train data has been estimated from the NZ totals published in the yearbook, I am not sure what the methodology was for this estimate.
From 1963 the data is from records of the ARA (later ARC), but there are still some estimates in the data set especially for ferries.
I wish I could remember the name of the wonderful gentleman who did all this work and provided it to the ARC for nothing many years ago – but we thank him anyway.
Thanks, Anna. I’m currently researching public transport data in regional NZ, and have discovered that the NZTA hold very little.
Do you know if there’s any other compilation of data for this sector?
Sorry this is the only compilation I’m aware of and it’s only for Auckland 🙁
Yes I used the data that AT originally used (which is largely from yearbooks) but also reconfirmed them and corrected a few errors I found in the tram numbers.
The person who originally put the history together was Richard Scott.
Heidi, the yearbooks do have numbers for the former tram networks in other cities too and I think some overall rail usage numbers but I don’t recall them being detailed like you’re probably after.
Thanks Matt, it’s really between the cities that I’m interested in.
Bill Frith did the original compilation of the data I just added to it using the yearbooks I could find at Public libraries. Inter city comparison is fraught with difficulties due to boundary definitions of the “City” population vs the PT network. e.g. City of Melbourne vs greater Melbourne, Perth including or excluding Freemantle and Mandurah, the population data available is not easily matched against the realistic PT service area. It becomes a density measure where dense cities (mainly populated pre car) score well and dispersed cities (populated post car era) score poorly. City states with highly constrained options score best Hong kong, Singapore.
I agree it’s really hard to compare cities, and as the Canadian cities show, it’s not just urban form but also the structure of the PT and fare systems that can play a role. Journeys would be a better measure but that data is harder to come by.
As for population. In Australia I used the Urban Centres and Localities data which seemed to best match the PT networks data I could find and be most similar to the data I used for NZ cities.
https://www.abs.gov.au/websitedbs/D3310114.nsf/Home/2016%20search%20by%20geography
I notice in the list you forgot the NZRoad service bus that went out south Auckland to Waiuku and Pukekohe
Yes, there are probably more bus operators yet that I couldn’t immediately recall.
Looking again at the original graph, and in the period 1930s-1940s, I feel almost certain that private bus companies were not counted for those years. The bus contribution is negligible, while trams absolutely dominate. I feel certain that private bus operations in the far north, west and south could not possibly all fit into the little sliver that represents “bus” on the graph.
There was no far north, west or south in the 1930s!
In 1940 Auckland stopped at Ellerslie, Avondale and Takapuna.
New Lynn and Henderson didn’t exist beyond a cluster of houses, Otahuhu and Papakura were separate villages down the train line, like Waiuku and Pukekohe. The east coast bays was holiday homes that people would journey to from Auckland.
It’s possible those aren’t included in the ‘Auckland’ transit figures because they were separate towns.
I can remember the road to long bay being unsealed on the downhill run to yhe beach
My street in Mairangi Bay was unsealed until the late 1990s.
Great work.
This supports what I am saying here about Auckland monitoring Wellington in the public transport growth side things. https://conorhillformayor.wordpress.com/2019/05/24/a-tale-of-two-cities/
I appreciate the work and the research in this article, but is this really the right time to be boasting about Auckland’s PT system, complete with photo of trains, when the rail network is in disarray and looking like it’s going to be a shambles for months to come? As I predicted, actual modern analysis of the track has revealed it to be in need of urgent replacement on the Eastern and Southern lines which didn’t get the benefit of project DART. 9km needs to be fixed in a hurry, much of it dating back to the 70s. Kiwirail are talking about months of work at night in very restricted windows, only 2 hours in some cases. The trouble with hurried work at night is it’s very easy to cut/damage cables and other infrastructure in the rush which causes a meltdown a few days later. I would expect to see night services and possibly early morning trains suspended for the next few months to give track repair works more time.
It would be very helpful if Stats NZ published metropolitan city data for NZ. That would clearly show Christchurch is larger than Wellington. From that data a lot of analysis work would follow.
This problem has come up before i.e.
https://talkingtransport.com/2018/09/21/different-cities-different-shapes-1-2/
Depends on what you call Wellington. I would include the Kapiti coast urban area which would put Wellington back in second place. If they are going to inflate Hamilton’s population by including all the nearby towns when there’s kms of rural land between them, then Kapiti should certainly be lumped in with the rest of the Wellington urban region.
For NZ population I’ve recently changed to using the combined major, large, medium and small urban areas from Stats urban/rural population estimates table as a more accurate reflection of the people served by the PT network as opposed to just the region.
From memory for Christchurch this is:
(Major) Christchurch
(Medium) Rangiora, Kaiapoi, Rollerston
(Small) Pegasus, Woodend, West Melton, Lyttelton, Prebbleton, Lincoln.
This was less than the equivalent for Wellington
Interestingly the Stats NZ Christchurch “urban area” definition includes Kaiapoi and Prebbleton, but excludes the likes of Rangiora, Lincoln and Rolleston, all about 20-25km away from the central city. I think those three alone add about 38,000 people to the picture. Meanwhile, Kapiti Coast is over 40km away from downtown Wgtn…
Also Rolleston and Lincoln are two of the fastest growing towns in NZ, while the Wellington region even if it includes the Kapiti Coast and Wairarapa has no fast growing towns.
This shows NZ officialdom lacks clarity about some of the most basic facts about the urban areas that they administer.
If Matt’s graph had properly accounted for Greater Christchurch’s size (not Matt’s fault the official figures are useless) it would have show NZs 2nd biggest city of about 1/2 million people is experiencing decreasing public transport services per capita.
Not worth getting too worried about previous Stats NZ definitions. New statistical standard for geographic areas comes in with the release of 2018 census data.
Takes a much more fine grained approach with, among other things, new urban areas not crossing TLA boundaries (with one exception). Many existing urban areas have bits split off (either as separate urban areas, rural settlements or as rural land – e.g. Hamilton loses most of its “urban” dairy farms).
At the stroke of a GIS package, that makes Christchurch the second largest urban area…
Christchurch loses Kaiapoi, Prebbleton, Lyttleton, Governors Bay, Diamond Harbour plus a rural strip along the south bank of the Waimakariri.
Wellington Urban is split in 4 along TLA lines & Kapiti Urban is split into Paekakariki, Paraparaumu & Waikanae.
But is that helpful? Wellington and Christchurch would be considered larger for most employees when they consider their commuting and employment possibilities Also trades and services like plumbers, electricians etc would consider the city area to be larger.
Yep rather small compared to previous stats urban areas.
There’s a few references to derived stats areas (based on 2018 data), including ‘urban influence’ and ‘metropolitan area’ (but I haven’t found any details about how these are defined). I’m guessing a metropolitan area might be a group of urban areas based on commuting.
2018 Urban / Rural polygons: https://datafinder.stats.govt.nz/layer/92218-urban-rural-2018-generalised/
I’ve used the newer Urban/Rural boundaries for the data above and for Wellington, yes it includes Kapiti
“Takes a much more fine grained approach with, among other things, new urban areas not crossing TLA boundaries”
So it makes the data useless for comparing cities.
TLA are meaningless areas, as evidenced by Auckland not suddenly becoming a larger city the day the Unitary counci was formed.
Stat’s NZ need to do a ‘metro’ population and clearly show what is and isn’t included in each one. Just as Papakura is part of Auckland, Porirua is part of Wellington and Prebbleton is part of Christchirch.
It’s interesting that Lyttelton is not considered part of Chch City, separated by some hills, but Wainuiomata is still considered part of Lower Hutt, separated by a similar hilly barrier. Mind you, I suspect that a few Lytteltonians would be quite happy to be considered separate from their bigger neighbours…
Wikipedia suggests that Wellington is slightly bigger than Christchurch, although I don’t know what it uses to determine the numbers.
While it is a nice little claim for the city that is ahead, the reality is they both have very similar populations and have for many years.
Stats NZ urban areas (which will all change with the 2018 census release).
Key point about WGTN v CHCH is that the latter is growing at twice the rate of the former. This matters hugely. There is a good case for arguing that CHCH is underfunded for transport in this comparison. Especially for PT.
However Alex’s point up thread that local governance (esp ecan) has not been any good compared to WGTN at demanding funding… (WGTN’s proximity to central govt power seems to trump it’s own divided governance set up).
CHCH needs representatives that barrack with some of the entitlement that their WGTN equivalents seem to all have in abundance!
+1
I think it is worth looking at the cities in Canada in the graphs above. There is a whole cluster of Canadian cities all grouped together (Edmonton, Alberta etc) and then there is Vancouver, way more successful than the rest. Why is that? Is it because Vancouver has the Skytrain (Kight Rail) and the others don’t?
The Canadian cities tend to get very high levels of boardings per journey which will reflect a mix of their network and fare structures which encourage more boardings than other cities. Still even if using journeys they tend to do pretty well.
Using boardings does have this issue but it is far easier to find boarding data than it is journey data. In fact some of the Canadian cities are the only ones I have it for.
Vancouver is the only coastal city. Vancouver has a wide river (Fraser River), with bottleneck crossings, and Burrard Inlet with bottleneck crossings. Vancouver also has a very large dense residential core on the downtown peninsula. A grade separated skytrain massively helps.
Edmonton, Calgary, & Ottawa are all flat sprawling inland cities.
Calgary is probably the unique one. A huge percentage of jobs are located in the downtown core, which makes getting in and out of the core difficult, so they are very big on park and ride stations. Drive to the train, and train into the city. So high on PT, but also high on cars.
Actually there are a lot of geographical reasons Auckland and Vancouver should be the most similar of all the cities compared.
Yes. Vancouver’s success at stopping the inner city motorways in the 1970’s paved the way for better PT stats now. I guess the question is are we able to match them through incremental changes, including using our poorly-placed motorways for better uses.
Good progress. It seems Auckland still have plenty room of improvement.
One thing this graph lacks is the asian cities.
It will be interesting to see statistics such as Tokyo, Hong Kong and Singapore.
We know that PT mode share in Singapore is 44% and Tokyo 51%. Auckland is 9%. I can imagine that the figures would be well off the scale of this graph.
Here’s why member counties of the EU are making such strides on carbon emissions and in most cases this includes PT plans.
“EU Commission finds national climate plans insufficient
The EU executive has said national plans for renewables and energy efficiency fell short of the bloc’s goals. The deficiency may undermine its ability to cut greenhouse gas emissions by 40% compared to 1990 levels.
EU member states are not doing enough to meet the bloc’s 2030 target for reducing greenhouse gas emissions, the European Commission said Tuesday.
EU countries have submitted 10-year draft plans to the Commission outlining how they intend to contribute to the bloc’s 2015 Paris climate accord commitment to cut greenhouse gas emissions by 40% compared to 1990 levels.”
Where are our plans at again? NZ? Auckland?
From Milan here is their ambition for PT growth from 2015-2024:
“Milan is the second-most populated Italian city, with 1.35 million people in the city (about 7 400 habitants per km²) and about 3.2 million in its metropolitan area (about 2 000 habitants per km²).
Every day 850 000 people enter Milan and 270 000 exit the city – resulting in a total of 5.3 million trips per day. Inside the city, 37 per cent of trips are made by car (car ownership is 0.52 cars per inhabitant) or motorcycle and 57 per cent use public transport (PT), but the share of car trips rises to 62 per cent when the exchange trips between the city and the external areas are considered.
The PT transport network consists of four underground lines and 154 surface lines for a total of 1 286 km, producing about 120 million vehicle km/year. The problems of Milan’s mobility and transport system are the increase in private transport demand due to the functional separation between the city centre and the hinterland; the lack of planning of goods transport and logistics activities; road congestion; and inefficient allocation of public space.
The expected impacts of the SUMP compared to the current situation relate to the following three areas: mobility, environmental quality, and human health and safety.
Mobility
• The PT modal share is expected to grow up to 63 per cent inside the city, while car share is expected to decrease by 24 percentage points.
• The cycling network, which currently accounts for 9 per cent of the urban road network, will cover 25 per cent.
• The average trip time is expected to decrease by 8.3 per cent (by 9.5 per cent inside the city) and road congestion, measured according to suitable network indicators[1], by 10 per cent.
• The PT service offer (seat-km) is expected to increase by 20 per cent and PT commercial speed by 17.5 per cent.
Environmental quality
• Air-polluting emissions are expected to decrease by 10 to 17 per cent (in particular CO, NOx and PM10 by 14, 10 and 14 per cent respectively), while greenhouse gas emissions by 13 to 15 per cent (in particular, CO2 by 15 per cent).
• Energy consumption is expected to decrease by 12 per cent.
Human health and safety
• Citizens’ average exposure to air pollutants is expected to decrease by 13 per cent.
• As for citizens’ average exposure to acoustic pollution, 37.4 per cent of the population will experience a decrease in noise levels, 14.1 per cent an increase, and the remainder will experience no changes.
• The number of road accidents is expected to decrease by 75 per cent between 2013 (about 10 000 accidents/year) and 2024 (about 2 500 accidents/year).”
This change is impressive on so many levels. This is the magnitude of change that I imagine for Auckland.
Boardings double-count people who transfer. This is really bad given how different cities structure their public transport differently. Sydney relies on mostly direct trips by train whereas Vancouver relies on bus-bus and bus-SkyTrain transfers, so Vancouver has more boardings per capita even though the mode share in Vancouver is 20% to Sydney’s 27%.
Modeshare to work is a much worse metric than total boardings. Most trips on public transport aren’t journeys to work.
Sailor Boy
Most boardings on public transport are by adults, or at least those paying an adult fare. If they are not to work where are they to?
From what I understand, about half of all boardings happen off-peak or on weekends but these are spread out across many hours unlike the concentration at peak times. Those trips will be for all manor of reasons, some may be workers starting at different times, they may be people going to shops, events, to socalise.
For example, from what I can tell from the various bits of data I have, in the year to June-18, about 18k people exit a train at Britomart on a weekday day however only 8.2k did so during the morning peak.
There are also a hell of a lot of trips by students going to Uni or school.
In Wellington there are reported peak/off-peak numbers. In the year to Jun-18 there were
– Peak – 19.46m boardings
– Off-peak – 19.01m boardings
Agree boardings is an issue and that is acknowledged in the post but it’s the only metric that seems to be reported across many systems. If I only looked at journeys the graphs would be a lot emptier.
I’d also note, Sydney is twice the size of Vancouver, by all rights it should have a higher modeshare, the fact they’re quite close is quite telling.
If you grabbed the per capita numbers from Charting Transport, then Sydney’s per capita numbers include Wollongong and Newcastle. CT is the only other place I’ve seen per capita numbers for Sydney. Brisbane is also SEQ, dragging down their per capita number vs Perth.
to nitpick, Vancouver passed 21%, last year, or the year before(?). I can’t remember which year, but it happened recently.