Google maps has a useful little tool, where you can not only see current traffic congestion levels, but also what conditions are ‘usually’ like at any particular time of day (show the traffic overlay and then change the box at the bottom to ‘typical traffic’. This makes it possible to take a look at where congestion is worst across the region at different times of day.
Starting first with Tuesday at 8am, which I’ve taken as a pretty good proxy for probably the heaviest ‘morning peak’. The first map shows the northern and western parts of Auckland:
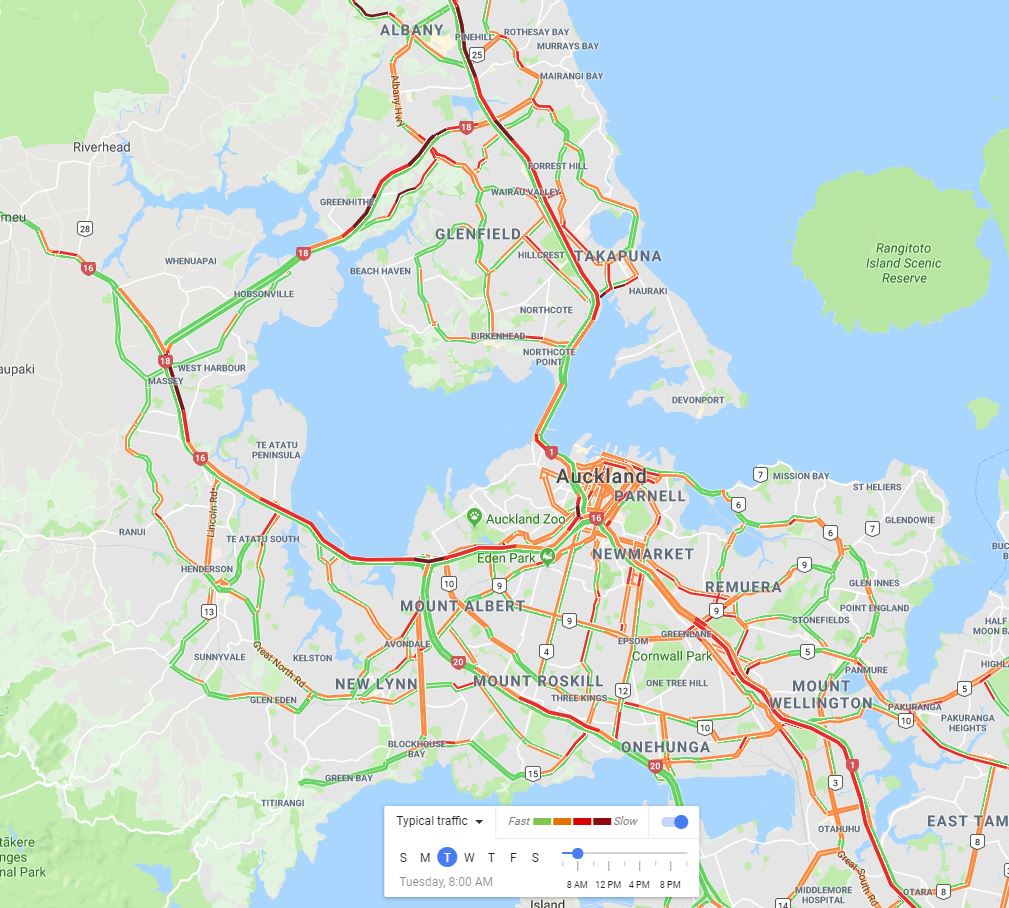
Most main roads across the region are orange, which means that they’re busy but not totally congested. What you’d expect and hope to see. Main areas of congestion seem to be:
- Citybound on the Northern Motorway between Oteha Valley Road and Esmonde Road. It’s very notable that congestion eases significantly over the Harbour Bridge itself. Access onto the Northern Motorway at places like Esmonde Road and Onewa also seem to be highly congested.
- Westbound on State Highway 18 through Greenhithe. This seems to be largely caused by a lot of people driving from the west to the large number of jobs around Albany that are really poorly served by public transport.
- Citybound on the Northwest Motorway right from Westgate through to Western Springs. This is one of the main reasons why rapid transit to the Northwest is so essential.
- Citybound on the ‘inner’ Southern Motorway is pretty widespread, right through until Greenlane. Presumably this is caused by quite a lot of trips to the large employment area around Ellerslie and Penrose being pretty dependent on cars.
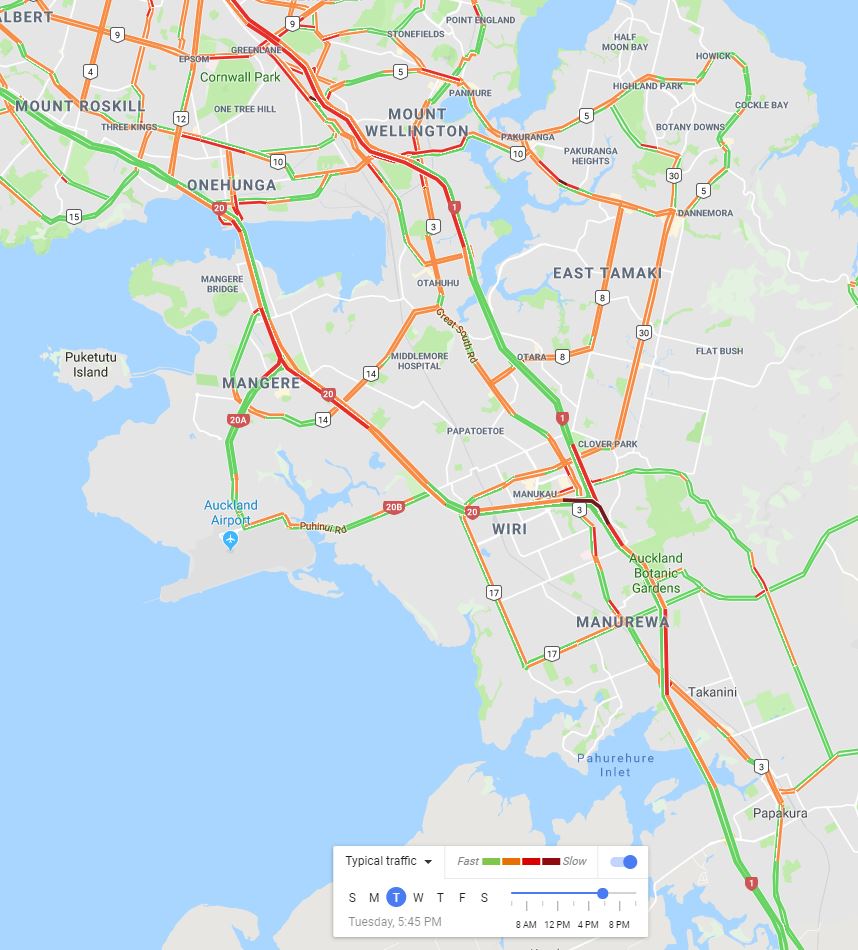
Looking next further to the south, you can see the citybound congestion on the Southern Motorway extends right down to Manukau City, and then again between Drury, Papakura and Takanini.
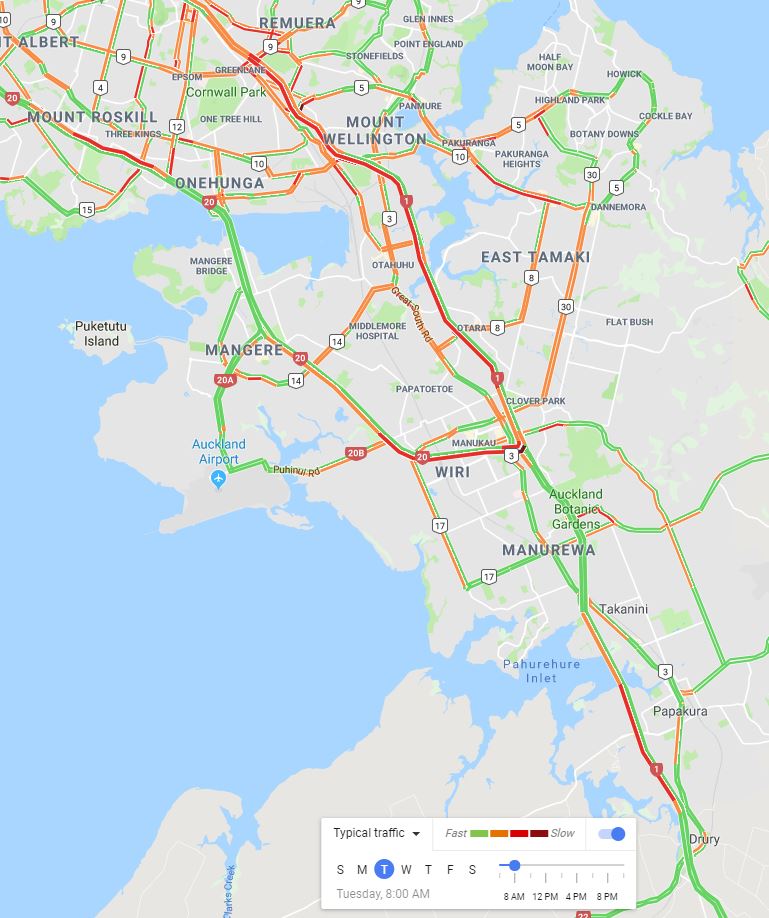
State Highway 20 is also quite congested between Manukau and Puhinui, presumably due to Western Ring Route traffic overlapping with people heading to the Airport along Puhinui Road. Ti Rakau Drive in East Auckland is also pretty congested.
Looking next at how things stand around midday, you can see how ‘peaked’ Auckland’s traffic is. The motorway network seems to work quite well during this ‘interpeak’ time:
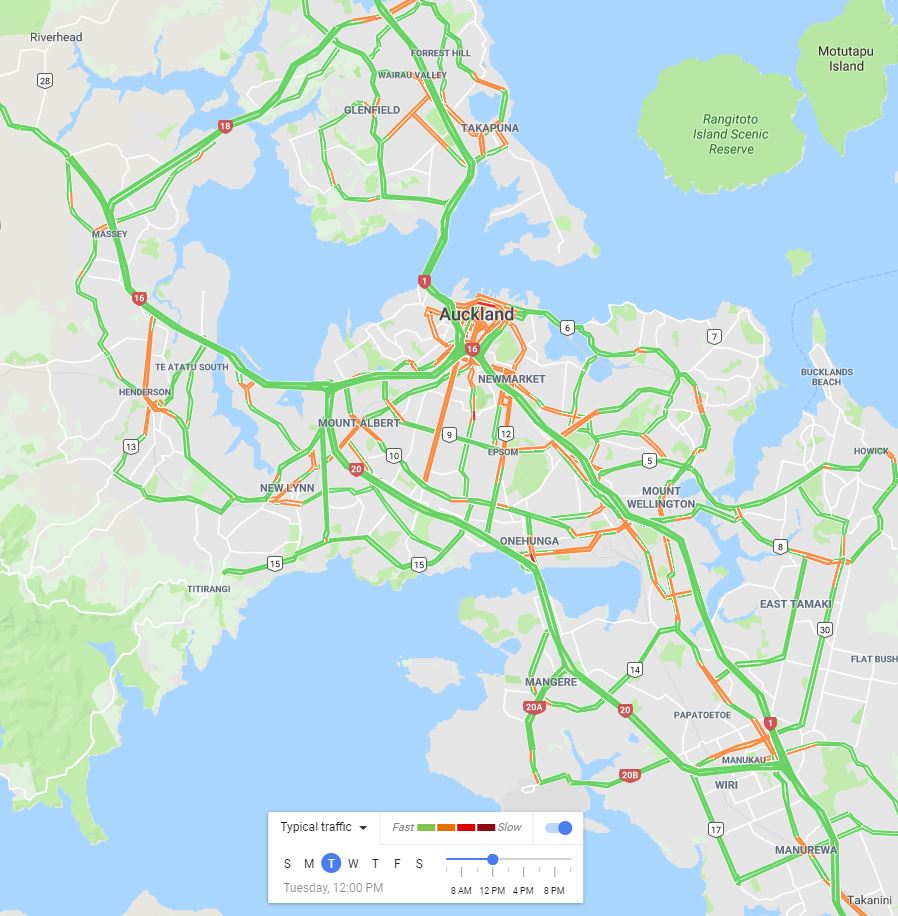
There’s almost no red on this map, and most of the ‘orange’ seems to be in busy parts of the city where you’d expect traffic to go a bit slower, like the city centre, down Dominion Road and then around major centres like Manukau, Henderson, New Lynn and Onehunga.
Tracking forward to 5pm, as an indicator of the evening peak and there’s a lot more red on this map.
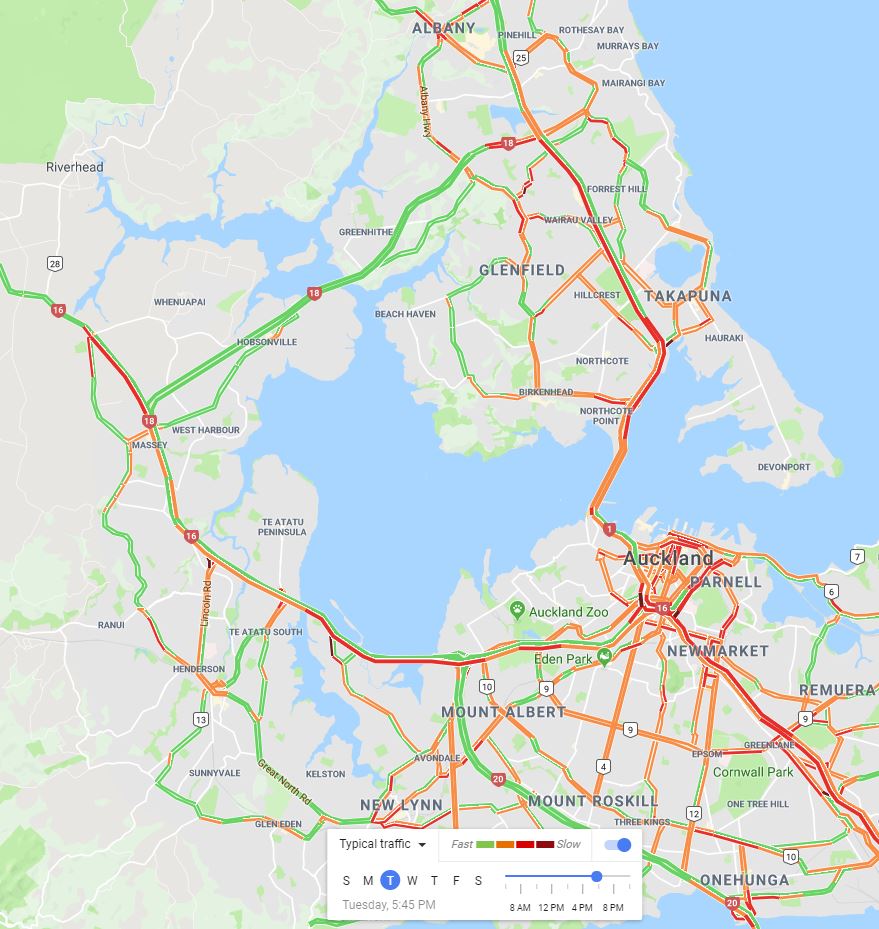
Some broad observations of the evening peak:
- Many of the main motorways are (somewhat unsurprisingly) a mirror image of the morning peak. Much of the northwest and northern motorways are jammed, although perhaps not quite as severely as in the morning.
- State highway 18 (Upper Harbour) seems to avoid pretty much any congestion in the evening, even though it gets pretty jammed up in the morning.
- Citybound congestion on the Northern Motorway is almost as bad as northbound congestion – which you would think is a bit surprising as this is counter-peak. Having only 3 lanes on the harbour bridge is obviously a key factor in this.
- There seems to be a lot more severe congestion in the city centre and through spaghetti junction in the evening peak than in the morning peak.
On this last point, I zoomed into the central area to take a closer look.
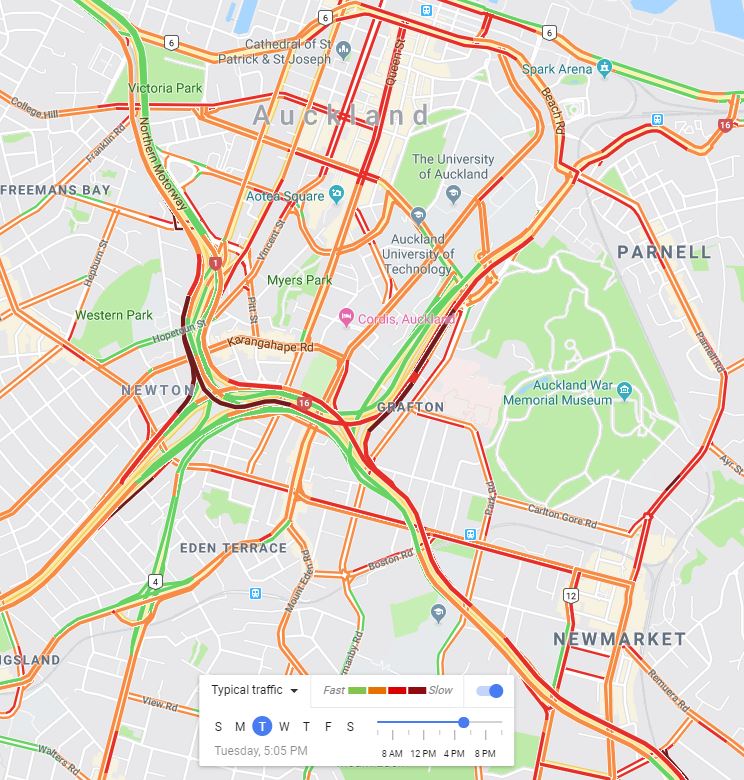
Some of the most severe congestion seems to be on the onramps to the major motorways, where traffic gets stuck at ramp signals. The fact that northbound lanes on State Highway 1 through spaghetti junction are green while the ramp signal is the very darkest red suggests that NZTA haven’t got the balance right – something I highlighted in this post a while back.
Looking to the south, it’s interesting that northbound (technically counterpeak) congestion is worse than southbound between Greenlane and Otahuhu. Further south the merging of State Highway 20 and State Highway 1 creates all sorts of issues around Manukau. There’s also quite a bottleneck where State Highway 20A from the Airport merges into the Western Ring Route.
So what can we make of these patterns? One thing that really stands out to me is that congestion seems worst (at least on the motorways where it appears to vary by time and place the most) for the kind of peak direction radial trip that public transport – especially rapid transit – is well suited to. Continuing to upgrade and expand rapid transit on the big corridors to the southeast, south, southwest, west, northwest and north is well suited to providing better travel choices for the very trips that face the most congestion.
For a little fun, I also made this gif showing how traffic levels every 20 minutes of the day from 6am to 10pm.
What stands out to you in these maps? Were you surprised by anything?

 Processing...
“What stands out to you in these maps? ”
What stands out to me is yet another great piece of analytical work by yourself Matt.
What I’m seeing is after that 60 years of almost mono-modal, billions upon billions of dollars, hasn’t worked as advertised!
Though exactly as should be expected. Nowhere on the planet is there a different outcome. Build for traffic: get traffic.
People who want to drive arguing more roads should be built, are among the most irrational on the planet.
83% of Auckland people who travelled to work on census day in 2013 either drove or rode in a car, van or truck. Only 17% used other modes to get to work. Exactly what isn’t working as advertised?
How many of those 83% actually wanted to be sitting in their car for those trips?
And did they enjoy it?
Revealed preference suggests they all preferred it to walking, cycling or riding AT’s ominbus.
Revealed preference surveys are more useful than stated preference surveys but they don’t account for what people would do in a different network created by investing in different priorities.
Revealed preference also shows us that Aucklanders prefer to spend half their income on housing, and that they prefer to live in damp drafty homes with no insulation. Except those that prefer to live in the back of stationwagon in a Mangere carpark.
Good work housing team, all working exactly as advertised.
And what would those surveys have said before 1955 when we had a great PT system? Most people in Auckland can’t imagine anything different after 60 years of pro-car propaganda that isn’t going to stop any time soon.
The part where Millwater isn’t “20 minutes from the CBD” as advertised by real estate agents.
It is at 3AM?
Tens of thousands of people journeyed to “other than paid work” on a Tuesday in March (Census day 2013) – but do not show up in your figures. As Stats never considered those journeys “worthy enough” to plan for.
Yet, one thing is certain, many of them did NOT “drive, ride in a car, van or truck”. An awful lot used walking, PT or other options to get where they needed to go.
So your 83% figure beung used as “its working as advertised” is a number that is representative of precisely the square root of the umbrella production of Paraquay. Meaningless.
We all know that during school holidays the roads run like clockwork.
Yet where does that show up in your “83%”?
Yes the evidence doesn’t support your position so the evidence must be crap because your position couldn’t possibly be wrong.
Yet Greg’s right, miffy. You love to point out the biases in surveys. Why would you turn a blind eye to this one, when it’s clear that the transport needs of people not in typical jobs (children, retired people, more women than men, more poorer and unemployed people than richer and employed people) are not represented by that figure?
There was scope for plenty of criticism of the census, pointing out that it gives no understanding of multi-leg journeys. Or maybe you could have led us into a discussion about the problems with the latest census which in asking for what people ‘usually’ do, is more like a stated preference survey.
Fair enough. JTW doesn’t capture everything. But these maps are showing a system that is working well most times of the day with some congestion at busy times. How does that in any way show the system isn’t working or that we haven’t had a good return on investment? Maybe I should also have added on the 7% of people who go to work on a bus as most of those trips are also on roads rather than a dedicated facility. That means our roads provide for 90% of the work trips. Surely that puts the whine about 60 years of mono-modal nonsense in perspective.
Miffy, what these maps don’t show is the huge cost incurred by the times that things don’t work well. The congestion at peak is what causes road users to demand more roads, or NZTA /AT to provide them. A clear example is the $700 million being spent on the Northern motorway extension.
I wonder of the 83% who drove to work on census day in 2013 the number who still wish to drive and if they do whether they wish to change their lifestyle in another way so that Auckland can meet its climate change obligations?
Miffy I would agree with you that in general it is working at the moment, and for most people their car journey is probably no longer than an equivalent PT journey would be (even if we had fantastic PT). But I can’t see how it could possibly work if Auckland’s population were to say double. There is a limit to how much land we have to dedicate to cars, and I think we have more than hit that limit.
But Jimbo, it isn’t working in general. If it was, our children would be independently mobile. They’re not.
What was advertised was easy travel with easy parking wherever you needed to go, that has definitely not happened.
Every new roading project is justified to the public as ‘cutting congestion.’ For decades we have been at the cusp of ‘solving’ the congestion problem, if only we build a few more roads or widen existing ones. We’ve known building our way out of congestion is a fantasy for a long time now but it hasn’t stopped politicians and vested interests repeating it at every opportunity.
Our roading network does work. The mistake is thinking that expanding it will make it work better.
And I respectfully say that our roading network is not a cycling nor a walking network, therefore it does not work.
Miffy, at least it’s down from the 94% travelling by car that Steven Joyce used to cite as justification for spending 94% of the transport budget on moar roads.
@ Patrick R – Great quote: “Build for traffic: get traffic”. It’s why we are where we are. Revealed preference my @ss.
has anyone worked out how many billions of dollars (in today’s money) has been spent in the last 50 or 60 years?
If so, what’s that number?
And what are the numbers for the rest of the transport budget?
Its very interesting to note the different effects of temporary traffic management on the current SH1 motorway improvement works. The northern corridor improvement works seem to have little effect on through traffic at all times of the day. By contrast the southern corridor works seem to result in delays and long queues. I wonder what the differences are.
If you are referring to SH1 around Mt Wellington to Market Road and vice versa the issue is the volume of traffic feeding on-ramps at Penrose and Greenlane and then the sheer inability of Auckland drivers to do a very basic driving skill like merging causing mayhem behind them in waves of braking.
Both those onramps city bound are long, Greenlane to Market must be close to half a km and Penrose to Greenlane a km and yet the retards try and dogleg in at incredibly slow speeds into and in front of the traffic in the inner lanes almost immediately once leaving the ramp lights, totally stuffing the flow of traffic.
The Greenlane onramp becomes exit-only and Aucklanders are not known for courtesy when it comes to things like merging. However, the fact that you need to get out of a lane so rapidly after being fed into is poor design from the get go.
I suspect it is because the long queues and disruption are not actually caused by the temporary traffic management, they would have occurred even if the roadworks had not happened.
I think it’s also a newer motorway network up north perhaps makes a difference but more that the works aren’t so advanced (eg narrower, temporary lanes with sharper curves etc) as down south I think. Could be just the worse drivers down that way 😉
By southern corridor works I assume you mean the takanini to papakura upgrade. This secton of sh1 has been a complete disaster since sh20 and sh1 were merged at manukau years ago, with no foresight/contingency from nzta of the congestion that arose. Effectively, 6 lanes of motorway traffic merges into 2 at the hill road overbridge, thus creating horrendous delays, right from the outset. So these roadworks have done little to exemplify the congestion, as it already preexisted.
Great skills, Matt. That GIF really shows the big role Dominion Rd currently plays. It will be interesting to see where all that traffic goes WHEN the light rail works commence.
Plenty of reasons to UP the bus capacity on Dom Rd & parallel routes ahead of time.
The Dom Rd bypass is already open: Waterview.
The GIF doesn’t necessarily show that Dominion Rd currently plays a big role. It simply shows that Dominion Rd is currently moderately slow for traffic across most of the day.
There’s no information about how much traffic there is, or how important the trips are.
Dom Road bus congestion showing up perhaps?
The funny thing is that there almost always seem to be queues on Dominion road at the Balmoral Road lights, but no real queues on Balmoral road. Is the traffic light phasing unfairly favouring Balmoral road? Or is this a deliberate way of reducing throughput?
I think it’s simply that Dominion Road is a narrow pre-automobile street that runs through the pinch point of a historic shopping centre, while Balmoral Road is a postwar widened to multi-laned arterial that has been sliced through suburbs.
Example one:
SH16 either city or westbound. This is a crisis and has been for some time. It is a blatant illustration of a failure of leadership at both local and central government levels for years. It is at a point where heaven and earth need to be moved right now, loans are taken out, overseas tenders sought to build it and put in fast rail-based public transport. This large part of Auckland is utterly devoid of usable public transport. And it needs to be done now if only to stop the myopic National Party seeing the solution as another motorway lane extension or yet another motorway slicing through somewhere. Oh and if this government and Auckland Council are really serious about climate change mitigation.
Nice GIF by the way!
Very surprised at the lack of congestion on the Mill Road corridor. Yet some want half a billion thrown at a pseudo motorway.
Which is a classic case of planning to create a problem.
And every new home they think they should provide this Mill Rd car dependency for, is a home that should be being put into existing areas that need extra people so bus frequencies can go up and so extra rates can pay for better facilities and amenities.
The so-called purpose of the mill rd upgrade is an attempt at mitigating the heavy congestion on sh1 northbound where there’s no room for expansion. And with the massive developments occuring in the south, it is only set to get worse. A much better option would be to create a dedicated rapid transit corridor on mill rd which would quadruple the throughput capabilities of the southern corridor as well as reducing carbon emissions.
You need to factor in the Trucking pressure from the Quarry operations and also that Mill Road is on peat for most of it’s length. The eventual width of this route is being choked with no present land being sought to provide for increased width of the corridor or the bisection of Papakura. The separation of the Papakura east and the new development from the schools is the most obvious item which is not being provided for.
Without me looking it up as I’m on my phone at the moment what are the updated plans for the Redoubt Rd area? I see 2 lanes each way plus bus lane plans in 2014. Missed a bus the other day as I couldn’t cross the road in time at ~1pm due to all the traffic in both directions. This is sprawl roading though, huge width increases.
Congestion on radial routes for sure. To which I’d add geographical bottlenecks. That is Mmost of the red appears to be associated with space constrained pinch-points around isthmus and city centre.
Auckland really has good geography for PT despite what our the naysayers nay.
What really stands out from those maps is those are ‘average’ conditions. In reality one has to be prepared for far worse.
If I were to drive from my home (Te Atatu Peninsula) to work (Newmarket), at 7.30am Google maps suggests this:
typically – 28 min – 1 h 5 min
which is a huge variation, and even this doesn’t account for really bad days (not that I drive, but I do watch the travel time signs by the Te Atatu on-ramp).
That map shows that previous planning has effectively sentenced huge areas of the city to lifetime of driving.
Living in Mt Albert and working in Albany often sees me go via the Harbour Bridge in the morning and around Hobsonville in the evening simply to avoid the queue for the Bridge.
Sadly even with the improvements to the Busway, it would still take over an hour fifteen to make the journey on public transport. Unfortunately the southern end of the Albany area around Corinthian Drive is very poorly serviced by the Busway and the local connector bus is near useless.
This is getting beyond a joke. Did they anger the gods by boasting about the 100 million passengers a year because the train wheels have totally fallen off since then.
Auckland Transport
Verified account @AklTransport
Trains across the rail network are not currently running due to a signal issue. It is unknown at this stage when services will resume. Scheduled buses are accepting purchased train tickets and AT HOP cards. We will have more updates shortly.
This week has been terrible with Train delays / cancellations etc.
KiwiRail is responsible for signals and track maintenance, not AT. There’s nothing AT can do. Trains can’t move with signals off (well they can be very slowly rolled to the next station)
A car is looking like a good option this afternoon.
Not as good as my bike.
I’ll take being in a car and not getting wet for an hour over being in the rain and getting wet for an hour and a half 😉
Ah well, you see, that difference can be explained by what I’m guessing is the best part of a generational difference in housing choice. Begone character overlays; every generation needs the opportunity for the health and freedom through cycling that proximity brings.
It was a lovely afternoon for a walk and furthermore the trains were on time by the peak.
I will take being in the rain and getting wet for an hour and a half over in 20 years time permanently having my feet wet because I am walking in 20cms of water.
And yet I bet you consider yourself an outdoorsy type?
Loved this the first time it was put on Matt. Google have come to town and your analytics is first class.
A bit circular isn’t it? The quarry companies pressure to get more roads for their trucks to get their rock to make even more roads.
Sorry this was in reply to the pressure to upgrade Mill Road
As usual east auckland is hardly mentioned shoved under the mayoral carpet
Nothing has changed in the last 50 years for east
Third world roads
At least you’re getting as proper busway out East.
The same deferral today yeeted the pathetic West Auckland bus shoulder lanes for another couple of years.
We were promised actual, proper rapid transit.
Not a single article in the media about it either, just a footnote in stories about the Eastern Busway.