As I state in this recent article at The Spinoff I see Auckland as around half way through a roughly 30 year long programme to retro-fit a complete Rapid Transit Network to itself.
Cities are of course never finished, and nor are their transport systems, but at the end of this period Auckland will have something new and powerful in its very structure: A complete city-wide top tier integrated Strategic Transit Network fed and supported by the Frequent Network below it: A complementary mirror to the city’s motorway and arterial road networks. Adding a desperately needed balance to the city’s transport systems, and providing a springboard for the city’s current spatial shift, and necessary tool in the lowering of the carbon intensity of our city’s worst performer: the transport system.
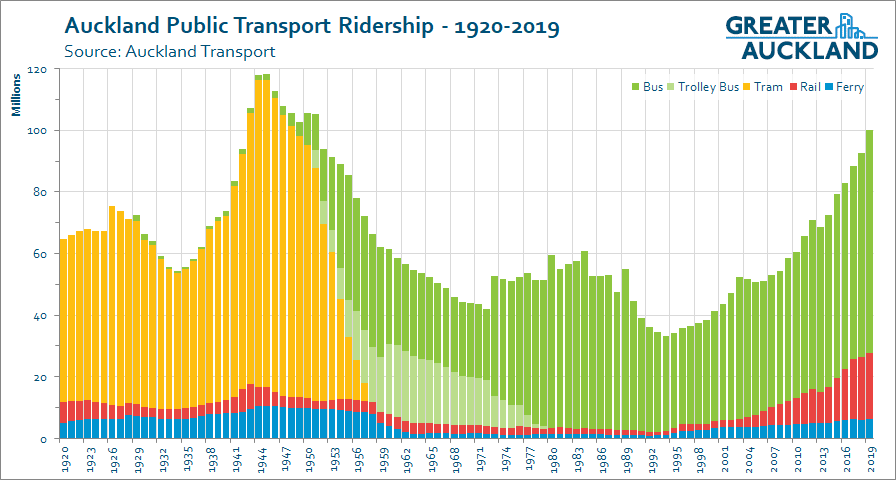
Taking the opening of the old Chief Post Office in 2003 as Britomart Station as the start of this reinvention of Auckland as a Transit city, our agencies have spent the last decade and a half rebuilding the existing rail network for intra-city passenger use, and adding and improving one new route, the Northern Busway. This work, along with significant improvements to other layers of the system (especially the New Network and Integrated ticketing) has been rewarded with consistently rising uptake:
It is now time to add the rest of the network.
Which AT and NZTA are doing, as a result of the current government and council accelerating this plan. Some parts of this are further advanced than others and Matt has written here about the value of communicating this in network terms, especially visually.
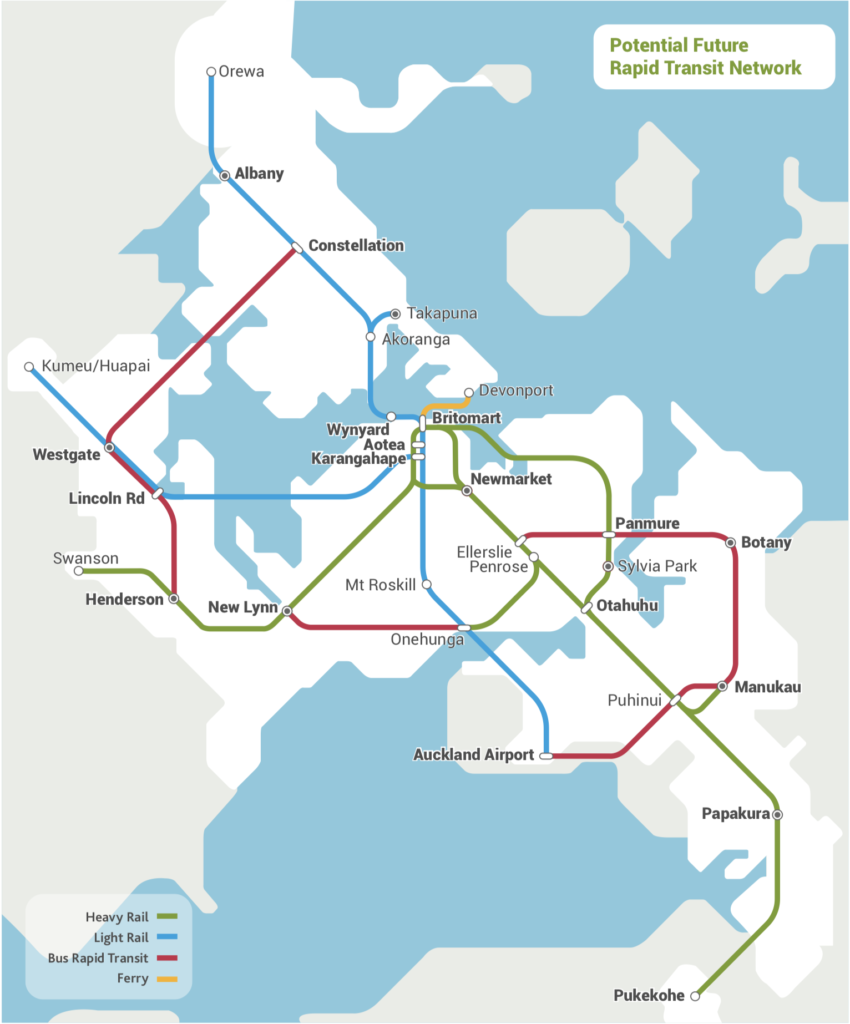
It’s fair to say that at the start there wasn’t a whole city plan, but rather a drive to get something working. A desire led by the then Regional Council, City Council, and rail supporters to revive passenger rail on the existing network, and by transport planners and the then Clark-led government to build a busway to help relieve SH1 and Harbour Bridge congestion pressures. And happily those two separate schemes both proved tremendously successful and sufficiently complementary to form the beginnings of a full Strategic Network for Auckland. This opportunity was first promoted by advocates on this site, and soon taken up, in various forms, by our official agencies. Most completely now through the combined Council/Government ATAP process, below is the most recent network design:
From the Auckland Plan:
The rapid transit network will need to play a central role in meeting the travel needs of a fast-growing region, as well as supporting and shaping Auckland’s growth and urban form.
In particular, only rapid transit can:
efficiently move large numbers of people to intensely developed places like the city centre and other major centres
dramatically increase the number of people able to travel between major parts of Auckland (north, central, west and south)
provide a fast and reliable travel option that encourages people out of their cars for longer-distance journeys
deliver long-lasting access improvements to areas near rapid transit stations, which improves their attractiveness for redevelopment.
This an exciting and ambitious plan, one that is pretty unusual in the anglo-phone new world because of its completeness. Many cities are adding new routes, or reviving old ones, but few outside of Asia are adding such a complete network virtually from scratch (European cities generally already have them). LA, interestingly as our old motorway role model, does have a city-wide scheme, LA Metro; a mix of Heavy Rail, Light Rail, and Busways, targeting the 2028 Olympics, but even when it is finished it won’t be as significant to that city as Auckland’s will be, simply because of the difference in scale of the two cities. LA’s would need to be much more densely packed to offer the richness of access that Auckland’s will when complete.
Canadian cities generally offer much more complete networks already, having a stronger European influence, so perhaps Seattle is the closest to Auckland both in current network scale and ambition of their plans:
With voter approval in 1996, 2008 and 2016, new light rail, bus rapid transit and commuter rail service will come online every few years.
So just like these cities a critical aspect of our plan is how it utilises existing routes and opportunities to build an affordable whole connected network out of a collection of different modes. A mixture that almost all cities utilise in their Transit systems. Here is the full 10 year ATAP programme co-funded by government and Council (made possible by the Regional Fuel Tax) agreed in 2018:

Now here’s a version showing the existing and future network, with the work currently under construction in 2019 in stripes: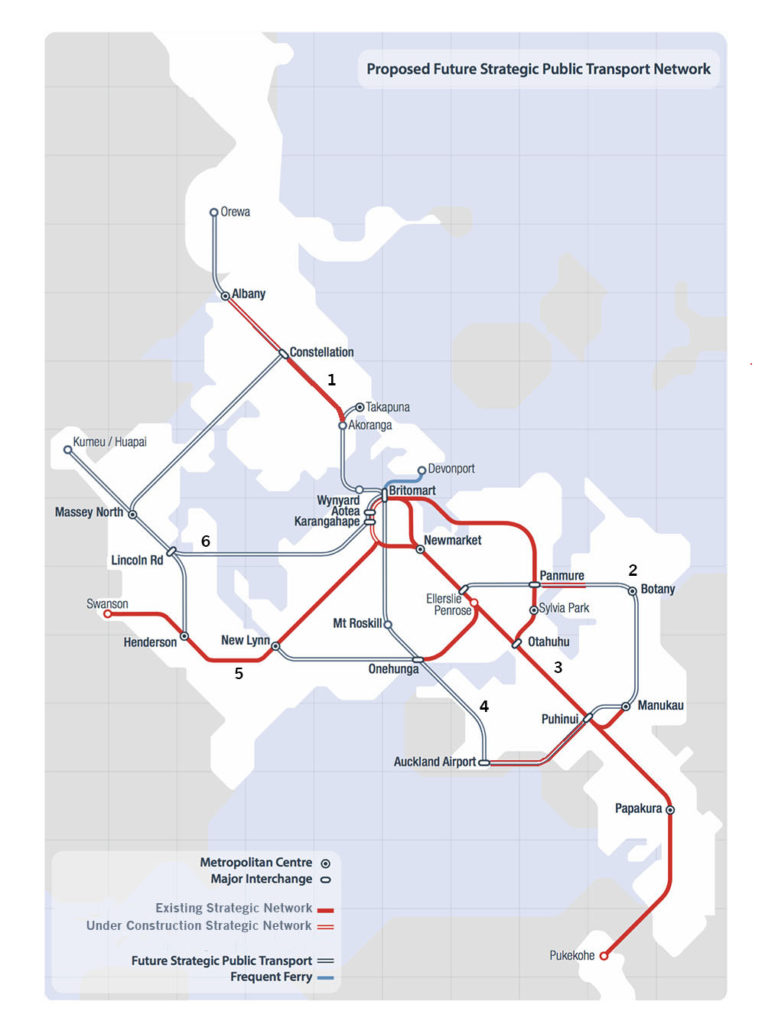 The Key to understanding the completeness of this plan are the six radial routes connecting every major centre of employment and habitation as numbered above:
- North Shore
- East
- South
- Isthmus and Southwest
- West
- Northwest
These six points of the compass, plus the crosstown routes and enhanced ferries, will complete a full city network. It is the very completeness of this plan that makes it so useful, the whole will be very much greater than its parts.
These will each continue to be optimised over time, as the completed parts already are, but the most significant moment will be when all six main right of ways are operating.
Essentially this network will add a permanent transit structure to the city on which longterm land use decisions can be made. The critical spine to support the life blood of the modern urban services economy: people.
So the critical next move is building the three missing lines, or two and a half to be more precise, as the hybrid Eastern Line is already has its rail component in operation:
2. Eastern Line extension
4. Isthmus and Mangere Line
6. Northwest Line
Here’s a timeline for completion of current Rapid Transit Network additions, including the known unknowns:
2019+ additional trains
2021 Connecting the rail network to the Airport via the Puhinui Interchange stage 1
2021 Eastern Busway 1 Pakuranga to Panmure
2021 Northern Busway extension and new Rosedale Station
2024 City Rail Link
?? Electrification to Pukekohe
?? 3rd Main on the NIMT
?? Light Rail Isthmus
?? Light Rail Mangere
?? Light Rail Northwest

 Processing...
It’s good to have a plan like this and keep referencing it. Eventually everyone starts to understand that this is what needs to happen to make the city a better place to live, work and play.
We still need to get much better at integrated planning. Transport infrastructure should proceed or at least come at the same time as building houses. Currently huge areas in the NorthWest and South are already growing quickly, with car as the only transport option. That leads to reinforcing the message, which makes it more difficult to change habits later.
Agree the NorthWest is going to be even more car dominated than it already is ( Hobsonville Pt is very much a car dense suburb as well). From Te Atatu Pen to Westgate by PT is 1hr20 according to journey planner and 7 by car ( bicycle is only 40 or so). Could we not put in a temporary busway just using plastic barriers until LR work commences as the sporadic bus lanes arent working at the moment to give PT any advantage over sov
It still would have to be more than just the barriers. We need transfer stations. Some could probably be done in a similar way to the proposed Rosedale one – on two levels, lower – the temporary busway, higher – on the motorway overbridge – local buses. Also a serious route re-jig is required. As is there isn’t a single high-frequency route out there (14 is high-frequency through half of its route there).
So overall – not small effort either. Obviously a lot of that work would be reusable for the proper LR.
Politically, the Eastern busway should be number one priority. The good folk of Howick and the exploding new planned satellite bedroom mini-cities of Botany and Flat Bush, Ormiston, Tamaki etc have to put up with hopelessly inadequate and upfit for purpose ex-country roads like Murphys road for a car only transport net, never mind the utter lack of decent PT options and they (justifiably) look askance at the costs being imposed on them for PT when they’ve got nothing in what has to be a notable transport planning failure.
Since these suburbs are reasonably wealthy and tend to vote for wingnut candidates (who always seem inevitably anti-PT for all sorts of bizarre ideological reasons) it would be prudent to build the freaking Eastern busway ASAP.
The alternative point of view is that these Eastern suburbs are already house the privileged so this privilege should not be reinforced. Currently the deprived areas are generally poorly provisioned all round, so better PT would help in these areas the most.
I think we just need to build anything we can anywhere that has missing RT lines where there are people. None of this silly class war.
Agree with Grant, everywhere needs work.
The East at least has already benefitted from the Panmure interchange and integrated fares. And now is getting the hard bits of the busway. My feeling is that the rest of the busway and bus lanes on Pak Highway will follow pretty smartly: The EB is going to be NB of the 2020s, for sure. The Tāmaki River severance is being bridged.
The North West has got nada, nuthin’, and a huge amount of need. Is a big dormitory area with very little employment. Standby by for a post this later in the week…
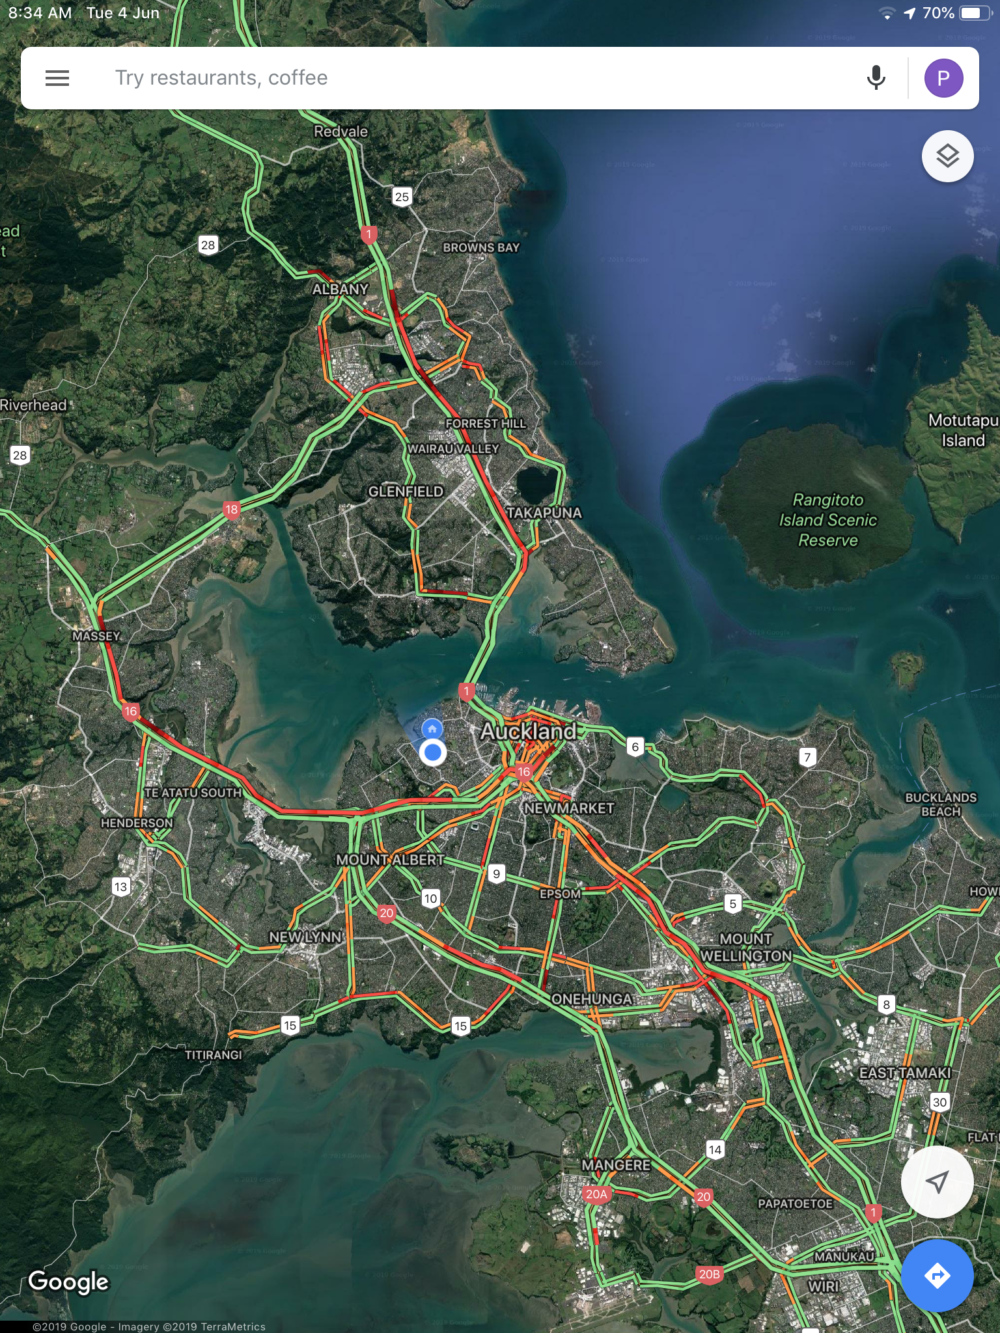
So I took a look earlier morning, at 8:32am. Looking at this one moment you wouldn’t immediately say the Airport, or East Auckland, or even across the harbour look like the urgent problems, but the NW is, right?
Or let’s ask a different question: Which major route into the city doesn’t have any kind of Rapid Transit Amenity parallel to it?
Hopefully there’ll be some silver lining to the neglect the NW has received, in the form of a better outcome. Maybe the various highway removal projects, and the proposal in Paris to remove motorway lanes in order to cut vkt and air pollution, will open NZers eyes to the stupidity of so many motorway lanes here.
In which case replacing lanes on the NWM with Light Rail, perhaps augmented by a little extra land, would make the whole project cheaper. Tunnelling under Carrington Rd and other works required to put it next to the motorway may be really cheap. But if not…
Agree – we’ve gotta bite the bullet and recognise that a limited resource (road space) has to be used most effectively and efficiently – and that means dedicated PT use. It will be a hard sell for some, but converting existing motorway lanes on the NW motorway to light rail HAS to be the way forward with a limited budget.
Silver lining for the neglected NW?
Now that its bloody obvious the NW will not be seeing any bus or light rail RT in the next 10 years, or 20 years or likely 30 years or longer into tomorrow world, isnt it about time the western rail line that goes to Huapai was brought into use for passenger services?
All this faffing about with imaginary never-going-to-happen reallocation of SH16 lanes to PT is not fooling anyone out NW. Just get on and sort out the existing railway, no more excuses or bullshit, lets do this. Get on the ball GA.
The northwestern motorway has been completely stuffed by the Waterview Tunnel. One metric shit-tonne of traffic was added to and from the north and two metric shit-tonnes of traffic needlessly added of people from the Isthmus now using the NW as a route into the CBD. Reducing lanes on a buggered up motorway when they are just about to finally get it to three lanes isn’t going to help greenhouse emissions. A lot of those people have no choices but to use a car so they will continue to use their car and sit in a queue for longer burning more fossil fuel to achieve the same journey.
Should they not have built Waterview then?
I assume the Northwest (including the likes of Huapai) are now settling in a pattern optimized for access by car. As is that other satellite town, Orewa / Silverdale. By the time any proper transit comes along, it won’t matter anymore because only a handful of people and businesses will ever be in the catchment of whatever proposed station. Near-total car mode share will be quite literally set in stone by then.
The rest of the North Shore has settled like that. Shopping around involves driving around between Big Box stores. Smaller stores are scattered around in that light industrial area and completely unreachable on PT.
And Warkworth. We invest in a motorway, but not in rapid transit. We will see the artefacts in the settlement pattern soon enough.
Correct, Roeland, the NW is now settling into car-orientated development. There were SHA developers who wanted to build transit-orientated development around the railway station at Huapai, but they walked away after AT/MRCagney, and with support of GA, killed off the railway plan. The development is now all around cars, and the opportunity for greenfield TOD has now passed. Any future mass PT will be the usual ass-backwards expensive retrofitting that Auckland does so well.
Geoff this is more of childish and bitter nonsense. GA has no such power, and nor in fact do consultants.
You clearly have trouble separating fact from fantasy.
Sorry Patrick but Geoff is completely correct. This is not childish and bitter nonsence. The proof was presented at the Labour party meeting held at henderson council office when the reps for the trains to Huapai group questioned the Minister of Transport on why the HR line to Huapai was being ignored and it was not the minister who replied.
He handed itover to GA’s Matt Lowry to respond with the main reason being the proposed LR was the better RT solution.
So GA were speaking for the Labour party and the current Transport minister. GA were effectively killing off the railway plan.
“This is not childish and bitter nonsence.”
“the HR line to Huapai was being ignored”
“GA were effectively killing off the railway plan.”
I hope you buy your tinfoil in bulk. Making as many hats as you need must be expensive.
Patrick, I didn’t say GA has such power. I said they supported AT/MRCagney killing off the railway plan.
That is factual. You share responsibility in the creation of the norwest’s traffic congestion and the 100% car-orientated development at the expense of a rail service that was planned to start in 2015 and SHAs revolving around said rail service.
But as Bogle mentioned – It was someone from GA who the minister got to reply to a question about killing off rail. I think that clearly shows GA is joined at the hip with those who killed it off.
You left Kiwirail, Jacobs and Beca off the list Geoff. They’ve also conducted assessments that identified it as a poor way to spend public money. Maybe it’s not a huge conspiracy to kill off a great project? Maybe it’s just not a good idea and no number of second opinions can change that?
Interesting that you keep saying “killed it off” like it was a live project. It never was, never had the service or construction planned, never on the programme, never funded. A paragraph of text in a strategy document from 15 years ago isn’t “planned”, Auckland is full of those bright ideas.
You guys inhabit some kind of alternate reality. One so filled with bitterness and anger, and so misdirected. There must be some way to focus all this energy more productively?
Take a leaf from our book; you want something, believe it can work, build the case for it patiently, do the work. Find allies, build bridges, cooperate. That’s what we do here, in plain sight.
Yelling at others, inventing conspiracies, making threats, and wasting everyone’s time with abusive comments, will not get you anything you want…
Also heavy rail to the north west had a BCR 0.003
Even Transmission Gully had a better BCR than that.
So umm yeah
Better idea is to pressure the Finance Minister to part with more coin to get NW LRT back onto the agenda
‘You guys inhabit some kind of alternate reality’
Thank God for that as this alternate reality sucks. Every morning commute stuck in SH16 congestion taking an hour longer to get to cbd.
Can’t wait for the proper reality to kick in, pleasant electric train journey from Huapai to cbd.
‘One so filled with bitterness and anger’
Not so, just disappointment but realisation that PT won’t ever improve, certainly no RT.
‘ and so misdirected. There must be some way to focus all this energy more productively?’
Yes indeed, rather than dream about decades away virtual LR schemes this energy directed to improving local roads, Kumeu gyratory and feeder to nearest rail station, Waitakere Rd to Swanson.
Have you better idea than –
“Stay calm and hurry up waiting on LR” ?
Ben Ross, thanks for that essential information
‘Also heavy rail to the north west had a BCR 0.003‘
So that really puts the kibosh on any rail based solution to the north west.
So That’s the end of north west LR as well, the BCR would be based on same criteria as HR to Kumeu/Huapai. Or wouldn’t it actually be a lot worse as LR needs built from scratch whereas the HR line,stations,signalling, etc, already exists?
Bogle – Re; LR to northwest BCR
Possibly, but also possibly not, new line, new catchment, possibly shorter travel times to CBD.
Bogle – NW light rail includes Westgate, Massey, Lincoln Rd and Te Atatu, a much, much bigger catchment than Kumeu/Huapai, so the benefits would be much bigger. The costs would also be a lot higher of course as it is a new line.
Bogle, a BCR is a benefit – cost ratio.
Those two things you are talking about are vastly different, they will have vastly different benefits, and vastly different costs.
There is absolutely no way you can compare one to the other.
Jezza & NickR, I should have said I was referring to LR from Westgate to Kumeu, not the NW LR into the cbd.
Thanks Patrick. Nice to see it laid out like that.
I’m wondering who’s overseeing this process:
‘But it now appears the NZTA’s finances are tighter than expected. According to Auckland Deputy Mayor Bill Cashmore, he has been told there are plans by the Government agency to look for savings in the ATAP budget. “There are some things in the ATAP plan that they won’t be able to fund in the next three years,” Cashmore says.’
There are some things in the ATAP plan which we’d be better off if they didn’t fund. And there’s been acknowledgment by Councillors that ATAP didn’t go far enough. Building more roads is not responding to the challenges this city is facing.
I think we need to declare a Climate Emergency. Under emergency provisions, it will become quite clear that Bill Cashmore’s thinking here is out-of-date, harmful, and unable to provide for our children’s future:
‘But Cashmore says attempting to cut money from State Highway funding and roading to pay for public transport projects would be problematic… “Public transport has to be part of the solution for all of this. But if you stop spending money on roads what are the compounding economic effects going to be? It’s about having a balanced approach.” ‘
https://www.interest.co.nz/news/99925/number-major-transport-projects-could-be-delayed-over-next-three-years-nzta-reviews-its
Climate emergency?! Give me a break.
More like a debt emergency.
Well Bill is right that the target is a balanced city. But given that we start with an extremely out of balanced one; it can’t regain balance through balanced investment. We have to catch up with Active and Transit spending cos we did none at all through the motorway decades.
We are fitting these systems sequentially not concurrently; we built an expanded the motorways, only, over decades, now we need to add the complementary missing modes.
But what does balance mean? You look at European cities and they are “in balance” with a car mode share that starts at 40% on the high side.
What is happening in Auckland at the moment is uncritical thinking. We have too many cars, therefore we need more roads. Wouldn’t a more valid approach be, with the city facing a carbon emissions crisis to ask, how can we reduce the numbers of people travelling on our roads so that we have less congestion?
If the goal was set to increase PT ridership by 15% annually (and the discussion on this site last week suggested that a change of this order is necessary) then Auckland may not need any more roads, anytime soon.
Auckland has a debt crisis because much of the spending is wrong. In my area there is a $30 million car park under construction that would hold PT fares at last years levels if the money was applied to this. $50m is going to be spent on Lake Road where buses run at 30 minute frequency. Has PT really been tried as a solution?
Yes Patrick, transport options are way out of balance and it is a shame that the current political leadership lacks true conviction to change it.
We don’t spend anywhere enough money on our state highways as it is now and you want to cut it? That’s nuts.
We spend far too much money on the wrong parts of the state highway network. $300m on SCI would have funded 100e if km of median wire rope barrier.
We should have been dividing our highways for the last 30 years, but we have failed miserably at this.
If it’s like the city’s motorway network it’ll take longer to complete than its designers envisaged! The 1956 motorway plan was originally intended to be done by 1970 or so – wild optimism bias – but ultimately took until 2016.
Auckland’s RTN could be done in the 2030s, but there’s a chance that it won’t be completed until the 2050s. If the former, then the city will still be growing strongly for several decades. There will be a need to think about how to continue to transform the transport system.
If the latter, then further growth is likely to be slower, and there may be less need to continue to invest.
I think the former scenario is the one we should aim for, because slowing down transport delivery is a bad thing in a growing city. We might as well start asking: what next?
Well that’s kind the sub-plot of this post. We are doing the incremental method faster now, and in just five years that’s going to mean a huge improvement, to so many parts of the city:
The West (via CRL)
The East (EB1+)
The North (NB extensions)
The Airport (via Puhinui)
The deep South (electrification to Puke)
The City Centre (CRL, A4E)
All significantly upgraded.
That just leaves the two big gaps: Northwest and the Isthmus and Mangere. Waiting on nzta to get their heads around Light Rail. My guess is that that’s a next five years deployment, so 2024 on.
After that its rail across the harbour; early 2030s.
Along with these rail projects we need to see the crosstowns start too, the Upper Harbour, Balmoral Rd etc. And a big Ferry fix.
All the way the electrification of buses and ferries.
I think you’re too pessimistic with 2050. The city is so much bigger now that even expensive projects are a smaller proportion of the economy.
Anyway we have to: https://theconversation.com/climate-change-we-can-reclaim-cities-from-the-car-without-inconveniencing-people-110917
Re the last link its worth noting that cars (not commercial vehicles) in Auckland produce around 3% of NZ’s greenhouse gas emissions. If you remove agriculture it’s about 6%. Passengers in buses (GWRC data) each produce over 135g/km – commuters in private cars around 120. So moving people from private cars to buses increases C02 emissions. So no benefit in moving people to buses and even if there was then you are only dealing with a tiny amount anyway
Where are you getting those silly numbers from? Got a link?
Both Auckland’s climate emissions and dangerously poor air quality results overwhelmingly from road transport. The vast bulk of which are single occupant light vehicles:
4.1 Emissionsfromtransport
Emissions from transport are summarised in Tables 2-1 and A-1, and Figure 2-1. On- road transport accounted for 86.1 per cent of total 4939 kt CO2e emissions from transport. Contributions from other sources were 5.2 per cent from aviation, 7.7 per cent from shipping, and 1.0 per cent from train, ferry and LPG.
http://www.knowledgeauckland.org.nz/assets/publications/TR2019-002-Aucklands-greenhouse-gas-inventory-to-2016.pdf
46 pages ffs. What page does it give CO2 figures for passenger/kilometre in a Bus versus in a car. That would be interesting. You can cut and paste if you can find it.
I think it is generally accepted that newish buses are good for city air pollution but the C02 emissions are no better than cars. Euro6 engines are incredibly clean – in fact in polluted third world cities they actually clean the air! It’s generally thought there wont be a Euro7 engine as the power reduction would increase C02 too much.
My 135g/km figure is from GWRC – AT will have the same data. Just ask them for the monthly C02 in tonnes per month and divide that by the monthy passenger kms they will have. Might be a bit better than GWRC numbers as they have made a hash of the buses down there and the ridership is down a fair bit.
Re the 3%/6%, I think if you check that out you will find it correct.
Graeme if you come here claiming data you better bring it. Cos that’s flat out bullshit.
Aucklands buses certainly need to be cleaner, as in emissions free. I certainly don’t share your admiration of Euro VI, it is only comparatively better.
But the idea that moving ~40 people with one engine is worse than each with own plus the two tonnes of metal each is sophistry.
The thing about buses is that they do not always run fully-loaded and do a fair amount of running either very lightly-loaded, or else empty and out-of-service. Same with trains and taxis. All needs to be factored in to the total emissions picture, although if the vehicles are electric (like the trains) they will at least have no direct-emissions to add to their carbon-footprint.
So Graeme, do you know if the figures you give (135g/km bus-passenger and 120g/km car-commuter) includes the non-productive emissions-overheads also? Private cars do not have the same “empty running syndrome”, although they can still have plenty of unproductive-running as well as unnecessary or very low-value, discretionary running. It would take a fairly wide-ranging study to capture and aggregate all the emissions of each mode so that they can be directly compared. And then there is the carbon-footprint for production and maintenance of vehicles and roads (/rails). The true picture is complex.
Dave, by using the city wide figures for buses, Graeme was including the empty bus syndrome. I like the approach of looking at it in aggregate like that; it cuts through many assumptions. The problem is not having good enough data, and not having similar data for cars. But it’s good to ask for the data.
One change I’d make is extending it to include trains, which I’d do because of all the people who take buses to the trains, so their journey is bus+train. This would be interesting to track over time, as we become more electric.
I’ve found AT saying in 2017 that they can now track bus occupancy data, so I will try to track that down. In Auckland, anecdotally, occupancy in the offpeak has been rising steadily during the last 10 years. It makes sense that the more connected and more comprehensive the network, the higher the average occupancy.
Heidi:
The Wellington figures are not city wide, they are region wide, including services within & between the rural towns.
Agree that the whole PT network should be included. This would show that most Wellington Region passenger-km are electric rail. Leaving out rail gives a misleading result as the main trunk routes serving the Hutt, Porirua & Kapiti are electric rail with bus mostly serving low density suburbia via connections. Compare this with Wellington City (Eastern, Southern & Western suburbs) where the trunk routes are bus based.
Also worth noting Wellington City bus routes have ~75% of total regional boardings for around 55% of regional service-km. Graeme’s claim that taking the bus has no CO2 reduction benefit may be true at a regional level but is almost certainly incorrect for Wellington City.
Those figures would put Wellington’s buses at the most emitting end of the band and their cars at the least. This is from the IPCC. The data seems a bit old but I remember reading the MoT’s fuel efficiency data for NZ’s fleet and it showed nothing’s really improved here for quite a while.
https://i.imgur.com/kcYlnzP.png
Road transport accounts for 17.9% of NZ’s gross emissions, up 6.2% between 2016 and 2017, and up 93.4% between 2990 and 2017.
Agriculture accounts for 48.1% of NZ’s gross emissions, down 0.4% between 2016 and 2017, and up 13.5% since 1990.
While both sectors need to change practices, it is clear that road transport is heading quickly in the wrong direction, and requires a complete rethink.
Splitting it into car vs commercial is interesting, and complicated. I’m not sure where SUV’s and utes driven by company directors sit. Also where expensive road expansion in the name of better freight efficiency and commuter travel savings sit when those outcomes aren’t realised, and the result is mainly truck volume increases (eg Victoria Park to Newmarket).
As you say, there are many benefits to PT. Many of these have a complex interaction with carbon emissions profiles. The driving mode pushes buildings and amenities apart; that’s one of its contributions to carbon emissions – travel demand goes up purely through increase in distance per trip. At the same time, that reduces the attractiveness of active travel, so again, this is a big contribution to carbon emissions.
In other words, each passenger km on a bus is associated with some number of person km by active travel too, and with a reduction in person km by car due to the more compact city.
The figures you’ve given don’t account for this, even though the UN has said that a compact city is the most important route to city low carbon emissions transport solutions.
I agree that carbon emissions from commercial vehicles is a big worry.
Graeme, here are some figures from The Productivity Commission Report. At p20 transport comprises about 20% of NZs gross emissions. At p341 light passenger vehicles comprise 59% of transport emissions. Also from p342 NZ is ranked fourth among OECD countries for transport emissions per person.
You may seek to minimise the effect of cars in Auckland as contributing to the problem, but you won’t win this argument. As the Prod Com says at p12, transport emissions have risen more than any emissions source since 1990. Much of this comes from Auckland. There is a real problem and if no-one else is looking at it, the rest of NZ has expectations that Auckland will fix the problem.
Hi Johnwood@takapuna,
My numbers were a bit lower but on your numbers 59% of 20% is 11.8%. Auckland has 35% of NZ’s population so that’s 4.13% of NZ’s GGH emissions are cars.
If you removed 250,000 cars you would save 1%. You just have to wonder if its all worth it? I think in the business case for the CRL they say it will remove about 1000 cars.
Graeme, I’m going to put my reply to this at the bottom of the comments.
The problem is the regional fuel tax is being collected from the North West on the assumption that it’s going to be used to help deliver transport improvements. ATAP laid out LRT to the Northwest as a Decade One project. Putting it back is a breach of a moral contract and severely undermines the argument for a regional fuel tax in the first place; it leads to questions around whether this should be higher in places that do have rapid transit, and whether it should be charged at all in places that keep having rapid transit delayed or pushed back.
You know a decade is 10 years, eh?
A decade is 10 years except in ATAP. In ATAP ‘first decade’ means we will do it sometime but nobody knows when, ‘second decade’ means we might do it but it won’t be anytime soon. Third decade means we are never going to do it but some people want it so we will pretend we might one day do it just to shut them up.
I understand that, but I also know that clock was ticking from 2018. So far it’s taken an extra six months plus and counting to even get a business case together.
I may be being pessimistic, but given the current rates of progress, I’m not super confident that this will be up and running and powering my commute by the year 2028, especially if the start date is currently ?? as above and it already being mid-2019.
It’s frustrating. But they are rather turning an oil tanker here. And once it gets its new course it will be just as hard to turn again. Like the CRL; that puppy is about to crank up for real, but it sure has taken a great deal of preamble.
If you haven’t guessed it from this post I am seriously concerned about the NW, but do think there’s a nearer term way forward, and have a post on it coming up this week.
Stand-by caller!
Buttwizard, northwest light rail was never one of the projects funded by the regional fuel tax anyway.
The 1956 motorway plan isn’t complete. There are a few major components missing. That’s why the North Western motorway needs to be so wide with so many lanes, as it is also trying to do the job of what the New Lynn/Henderson Motorway would have done. Without the New Lynn/Henderson Motorway, heavily congested arterial routes (such as Lincoln Rd) came about as western subrub residents try to get to their nearest motorway.
I thought you wanted everyone to live a hunter/gatherer lifestyle in TRaumarunui. How does a motorway figure into that utopian vision?
The North Western is also now doing the job of the Central Motorway with some using the Waterview to SH16 City bound ramp as a way into town.
Can you show the GWRC CO2 figures for buses versus cars please Grant. Where did it come from.
It would change a lot of how we should be approaching our lives if its true.
Hi Royce – it’s from a LGOIM request
GWRC ’s response follows:
Passenger kilometres
There were 2,138,000 bus passenge boardings during November 2018 with an estimated average trip length of 5.9km giving a total of 2,614,200 passenger-kilometres in November 2018
CO2 emissions
The modelled CO2- e emissions for the bus fleet operating at the commencement of the new network in July 2018 were 17,082 tonnes.
(GWRC provided emission data for each bus type – and it was in line with their 17,000 tonne figure)
So that’s 135g/km per passenger – but they could not supply NIS km. So it will be a bit worse. Maybe 10% more – 150g/km perhaps? BTW the average loading in-service was 10.7 people. I would hope AT buses to be better than this and their CO2 to be lower.
The car stuff is easy – average of the light vehicle fleet (incl utes and vans) is 181g/km. Average loading is 1.5 people – so 120g/km per person. New light vehicles are 151g/km – so the figures are improving. Taxis are almost all hybrids. Ubers are mostly Prius’s – they are 100g/km so are really good. Two passengers in a Prius are 50g/km each – far better than the bus at maybe 150! You wouldn’t think that would you?
There are really good reasons to get a bus – the dangreous noxious emissions are brilliantly low and the road-space capacity is incredible esp for double deckers. But just not as a way to reduce C02 emissions.
correction to the above – should read “12,614,200 passenger- kilometres in November 2018”
My cut and paste removed a ten million passenger km!
So 17,082 tonnes multiply by 1000 equals kilograms then multiply by 1000 equals grams. Then divide by 2,138,000 multiply by 5.9 kilometres equals 12,614,200 passenger kilograms.
17,082,000,000 divide by 12,614,200 gives me 1354 grams per passenger kilometres.
I’ve been hoping Graeme would fix this. I’ve not looked at either figure, but perhaps the carbon emissions are for a year and the passenger km for a month? That would put the figure at 113 g/passenger km.
Average loading of light vehicles in AKL is 1.1
A taxi with two people is still only one; the driver is part of the machine not someone taking a journey.
Bus loading is higher in Akl than Wgtn too, will see what AT say.
Also not true that bus noxious emissions are low; they and service and delivery vehicles are the big source of terrible air quality in AKL city centre.
http://knowledgeauckland.org.nz/assets/publications/TR2018-028-Impacts-of-transport-emissions-Auckland-city-centre.pdf
https://www.nzherald.co.nz/index.cfm?objectid=12236907&ref=twitter
All this says is we need to reduce ICE vehicle numbers and replace what’s left with emission free one.
WGTN looking pretty silly taking out the trolleys now…
I don’t think the AKL loading is 1.1 but it would be good to be proved wrong.
Here is the only proper study I found
https://www.pinnacleresearch.co.nz/research/survey/vehicle_occupancy.pdf
It is 1.39 for weekday AKL and 1.83 and 2.03 for Sat/Sun. That averages 1.55 so actually more than I said.
The Prius example was two passengers plus the driver for 50g/km. If you include the driver it’s 33g/km. If CO2 reduction is your thing buying a Prius and taking a couple of friends to work is hard to beat. The Uber and hybrid taxi emissions can look good but you have to take into account the km driven around without passengers of course – to make it comparable with the bus example.
Agreed old buses are pretty bad for noxious emissions – incredibly I think there were no emissions rules for heavy diesel vehicles till quite recently – maybe 2011? I believe this related to syncronisation with Aussie for rhd trucks. But the new Euro6 are amazing and Euro 5 are pretty good. Euro6 are much better than Euro6 diesel cars
https://www.wattstvc.co.uk/news/euro-6-heavy-duty-engines-are-cleaner-euro-6-cars
“The tests found that on an engine load basis, heavy duty diesel vehicles are approximately 10 times better than lighter duty diesel vehicles at reducing nitrogen oxides.”
Yes the 1.5 average loading is very different to what we have – what’s that from, Graeme?
Where did you get your value of 181g/km? MoT’s fleet statistics:
https://i.imgur.com/84PvVyR.png
And they note that even these figures are optimistic:
“There is good evidence that the gap between laboratory results and real world fuel economy has been widening. A 2015 vehicle with a certain real world fuel economy is likely to have a lower laboratory result than a 2010 vehicle with the same real world economy.
The implication is that the test value results for the newer vehicles shown in this section are becoming increasingly optimistic. Figure 9.4 shows that the average laboratory value for new light petrol vehicles was 192 g CO2/km for vehicles entering the fleet in the fourth quarter of 2010 and 167 g CO2/km in the fourth quarter of 2014. That suggests an improvement of 13%in fuel economy. However, based on the result above their real world economy may have been about 219 g CO2/km in 2010 and 207g CO2/km in 2014, or an improvement of 5.5%”
So if the newer vehicles are more like 207g/km, would you put our fleet at about 220g/km? With a loading of 1.14, that gives 193g/km.
I’d be interested to know what our bus emissions are in Auckland; certainly it’s a newer fleet than yours, but using the IPCC data I’d be looking more around the 95 mark. Calculations I’ve seen in the UK use 89.
So roughly half as much emissions by bus than by car, and that’s before you even put the urban form and active mode compatibility factors in.
And just for a bit of fun, please don’t take offence as I think it’s good to look at the figures!
There are really good reasons to use a car – with a complete network, the access it gives in rural areas particularly are fantastic. But just not as a way to reduce C02 emissions.
Hi Heidi
Here is item about the fleet 181/151g/km CO2 emissions – sounds about right?
https://www.stuff.co.nz/motoring/news/104972992/fuel-for-thought-as-average-emissions-continue-to-drop
Also worth noting is there is far more used EV’s than new ones imported (four times) and prob the same for hybrids. So the fleet will be improving faster than the new car figure would suggest.
I haven’t seen recent UK bus loading numbers but I thought European loadings were far higher than here. About twice I think. Any idea of the Auckland loadings? Wgtn might be only 9.7 when I look again at the figures
Buses emit 1000-1400 g/km of CO2 at a constant 20kph. More with stopping and starting. Wgtn buses are mostly quite new – the fleet is 50% Euro 6 I think.
Graeme, you’re trying to compare very different bus and car data.
For buses you took the overall carbon emissions for a sector in real world conditions but with some large assumptions on average journey length per boarding. For cars, you’ve used the manufacturers’ claims on emissions per km, in test case conditions, which have been shown to be not just wrong but increasingly so. The MoT link I gave discusses this. This research paper looks into how this is happening.
https://www.sciencedirect.com/science/article/pii/S0360128516300442
“A reported difference of 30–40% between official values and real-world estimates was found which has been continuously increasing.”
So the figures in the motoring news article will need to be adjusted.
Cars in congested Auckland streets will be further from the manufacturers’ claims, of course.
As to the occupancy levels, I think 1.2 is usually used; the 1.14 figure was from the Auckland city centre at morning peak. I don’t accept 1.5 as being anything like realistic in Auckland (and I wouldn’t use research based on a 1997/8 Household Travel Survey).
The best way to analyse this would be to look at the transport carbon emissions per capita for a compact city based around PT and active travel, and for a sprawl city based around the car, because that would take into account all the wider effects, including land use effects, of providing road space and funding for public transport vs providing it for private vehicles.
This map just gives country data, but it is indicative of the problem we face: https://wec-indicators.enerdata.net/transport-co2-emissions-per-capita.html
NZ is in the worst band, with 3.11 t CO2 per capita for transport.
Hopefully someone can link something similar for cities.
It’s hard in rural NZ, but Auckland should be aiming for per capita emissions much lower than this. We can do that only with well-developed PT and active networks.
Hi Heidi
That car occupancy study did find work trips to be 1.12 but still found the overall occupancy to be 1.55 if you calculate it. Perhaps if you have been using 1.14 for your modeling then are way out on the benefits of a bus. You can’t just use data for central city Auckland in morning peak surely!
Also the light vehicle data will include a large percentage of utes and vans which will not be commuters who could change to a bus as they are carrying stuff around. The average of the car-only fleet will be less than the overall light vehicle fleet of 181g/km. Perhaps 170g/km? So at 1.55 average loading that’s 110g/km for car passengers
Buses are 1000 to 1400 g/km measured on the same basis as cars – so say 1200 average – and if GWRC buses have 9.7 people on average IN SERVICE then that’s 124g/km pp.
But cars don’t have an NIS factor and if that was 10% of the IS km – then the bus passenger would be 136g/km.
So it’s slightly worse than I said originally – but hopefully AT is doing a lot better than Wgtn for loadings so the emissions may equal or better cars.
I think my point was there isn’t a great CO2 saving to be gained. If any. On the other hand they are good for congestion reduction and the newer Ad Blue equipped buses were very good for noxious emissions. So save people but not the planet.
1.5 is the average car loading on urban roads (page 5-155): https://www.nzta.govt.nz/assets/resources/economic-evaluation-manual/economic-evaluation-manual/docs/eem-manual.pdf
1.15 is average car loading for travel to work (page 9):
https://www.pinnacleresearch.co.nz/research/survey/vehicle_occupancy.pdf
A car running at 10l/100km produces 230g/km https://www.greaterauckland.org.nz/2013/02/28/whats-the-deal-with-transport-emissions/
Based on average occupancy and average emissions, cars produce 157gCO2/km.
Euro 4/5/6 buses (which almost all in Auckland and Wellington are) produce ~1150g CO2/km (page 9) at *average* of 20km/h, not *constant* 20km/h. https://www.atrf.info/papers/2017/files/ATRF2017_115.pdf
A bus only needs an average occupancy of 7.3 to produce less tailpipe emission than a car at average occupancy. I can’t find anything reliable on bus km and ridership km in Auckland, sorry. I’d eat my hat if it’s lower than 7. That would mean almost 1,000,000,000 bus km per year.
Thanks, Sailor Boy. Vehicle occupancy numbers in a place with transport choice and costs internalised are useful. In Auckland, vehicle occupancy numbers are a bit useless as a design input.
Higher car occupancy is usually due to people being chauffeured. A mum taking her 11-year-old son and his friend to soccer, with the younger daughter in the car, then returning home, will have an apparent occupancy of 3, on average, for a journey twice as long as is needed. A good system would have the two boys doing the journey by bike.
Looking at the raw numbers, this car trip acts to make the carbon efficiency of driving look better through increasing the average occupancy rate; yet it’s a car trip that should be making it look worse.
Once we have a safe cycling network and a public transport network that children, elderly and mobility impaired people use independently of their parents, our car occupancy numbers will be a useful input.
Hi Sailor Boy
The real world v lab CO2 the NZTA allow 12% difference. So the latest figure of 181g/km becomes 203g/km
The average NZ car doesnt use 10l/100km – its will around 9 I would guess. You can see here in Table 1.9 the 2017 light vehicle stats – your figure is way out.
https://www.transport.govt.nz/assets/Uploads/Research/Documents/Fleet-reports/1b33252a3d/The-NZ-Vehicle-Fleet-2017-Web.pdf
These figures include vans a utes and are 2 yrs old – the trend is strongly downwards. 9l/100km would be a max average for cars. Anyway at your 2.3 factor that makes it 207 – which is near the 181g/km with the NZTA’s 12% loading (203) So we can see this must be validated. 205 would sit in the middle and be a useful number to use.
At 1.55 passenger loading for urban Auckland – ie where buses might be – that’s 133g/km in real world numbers
My GWRC numbers were real world and work out as 135g/km PLUS km done NIS. I have conservatively estimated this to be 10% – so about 150g/km pp. But as I said I would assume AT figures to better the 9.7 (in service) passenger loading and I hope will be closer to the car figure.
Graeme, are you able to answer Royce’s question about your figures for the real world bus situation coming out at 1354, not 135? Is my guess correct that one input is yearly, one monthly, meaning the figure should be 113 for buses, before the NIS adjustment? Or is there another explanation?
Also, why are you still talking about a 1.55 passenger loading yet a NIS factor for buses? They’re similar, but car occupancy levels will be more inflated due to the chauffeuring than the bus km need to increased for NIS.
Hi Heidi
I have asked GWRC for confirmation is is 1708 not 17080 – the data was for July 2018 so I presume its a month.
The chauffeuring you mention will be more than offset by the fact the emissions include utes and vans – which emit about half as much again as cars. I am interested in the CO2 benefit of changing from cars to buses – not from people in vehicles that can’t change to PT.
Also the 181g/km (now) and the 151g/km (new) that the light vehicle fleet emits – includes vans and utes. They average over 200 for new, So I will get a figure for cars only and that will be less again.
Is it only in Auckland that contractors drop their grandparents off at clinics in their utes, kids are taken to soccer in huge SUV’s and big families use vans for all their travel? I don’t think you can exclude those vehicles from the chauffeuring effect.
Are you still using the 151 and 181 from the advertisement with the Motoring Industry Association’s figures? Despite the linked information about how the industry is cooking the books more and more each year? The correct ones to use are the MoT’s, in the vehicle fleet statistics that you’ve linked. I’ve already linked that. As I quoted, they’ve calculated what this is after adjustment for the industry false claims, as “207g CO2/km in 2014” and the graph shows that the profile hasn’t changed since then.
Together with the older cars that are less fuel efficient, I’ve suggested a value of 220 g/km +
Of course this is going to change as more people buy electric cars but the effect of the economy and people switching to PT for lifestyle reasons will have more effect more quickly than electrification.
Thank you Grant I often wondered after seeing so many buses running around empty. Serious thinking needed now. I know a mobility scooter but I can still walk. I can cycle I suppose but I always worry about the traffic and I am not keen on leaving my bike lying around even when its chained up. Who could of thought saving the planet would be so complicated. I can catch an electric train and I just came home from Manukau city on the 380 electric bus. I asked the driver how he found it. He said it is quite heavy and it bounces around a bit. Also its only 4 wheels so he thought an extra axle or axles would help. Also it quite heavy to steer. I said he will build up muscles he laughed. But he is right it does bounce around a bit as for extra axles I suppose they would just add drag and reduce mileage between charges. I expect because of the axle weight they might be paying higher road user charges. So for my way of thinking we need to get on and electrify the bus fleet. Heidi’s anti sprawl and anti car stuff is all very well but in the end we still will move around. Off course the diesel SOX’s and NOX’s are a huge reason to move to electric although we have used natural gas in buses in the past and bio diesel are mean’t to have lower noxious emissions. So as much as Trump might want us to use “made in America freedom gas” in balance I think we should electrify baby electrify rather than frack baby frack. And we should dump the use of diesel as soon as possible.
Completing the RTN? Never. It will now continue to evolve, and be added to as long as Auckland exists.
What was really significant was STARTING the RTN. For the first time in our city’s history, we actually started building a coherent city wide integrated transport network. A network that uses, more then just more cars and more tarseal. Prior to this, transport planning here, was almost entirely, just the adhoc provision of more tar seal to move and park those cars. Inevitably, succeeding in only moving the traffic jam just further down the road. Car capacity was acheived at massive expense to foot and cycle movement, and to the considerable detriment of city amenity and air quality. The ultimate show of the futility of this approach was that it became necessary to provide car transport to get most of our children to and from school, and to, after school activities, contributing to the massive costs of time and money of such inefficiency.
The beauty of the RTN is it’s elegance, in both layout as an interconnecting grid, and also it’s spacial efficiency. The Fanshaw Street bus lanes are a dramatic example of moving far more people per lane width then the adjacent general roadway. The spacial efficiency is also realised by the release, to more productive use, of the land required to store cars at both ends of nearly every car journey.
The CRL was due to be completed in 2021. It’s now delayed. Just goes to show that no one in this country can get an infrastructure project completed on time.
I don’t think the completion date for an unfunded project really means much. Pretty much every infrastructure project will have appeared in a plan with a proposed completion date at some stage in it’s life.
It’s not unique to NZ either, this happens all across the world, the only difference is we generally don’t hear of overseas plans until they are actually starting to happen.
I agree Mike. If you look to China, they have doubled the size of their metro system within the last 5 years. The reason NZ is so slow is because of all the bureaucracy involved in these projects, and just sheer laziness of NZ workers. No one is allowed to work on Sundays. No one is allowed to work past 5pm. CEOs, project managers who are paid 6 figures a year turning up to work at 9:30am only to have ‘morning tea’ at 10:15am. I’ve worked with these people so I know what it’s like from the inside.
That is absolutely nothing like my experience of large scale construction projects. Whether it was working 12 hour days as a labourer, or my dad, a site manager, getting to work by 6 every day.
The construction industry in New Zealand is a very high stress industry to be in. Massive pressure to perform often against the odds. There has been a lot of publicity recently highlighting this, and the very real injury and death toll on it’s workers. Both in physical injuries but also in mental health. Far too many good people are being lost to suicide in this industry.
I note in recent months the blog is depicting AT’s RTN plans, and we don’t see the CFN brought up anymore.
Has GA dropped the CFN and adopted AT’s plan instead?
Also, Patrick, are you writing this with your AT hat on or off? You publicly stated you would step back from the blog because of your AT role, but appear to have since changed your mind. Perhaps you could publicly clarify who you are representing now.
Not criticizing, just asking. On the face of it, it would seem you want GA and AT to align their goals.
They are already aligned, because GA copied AT’s network.
Well for a start it’s actually the ATAP plan, which was jointly agreed by the Ministry of Transport, AT and NZTA. So not just AT.
But if you read the CFN document, you’ll see it is simply the ATAP plan with some extra assumptions on modes and stations for each line, and some extra main bus routes added. Did you not notice the CFN map is a literal copy of the ATAP map?
What advocate doesn’t want official agencies to adopt the proposals they advocate!? That’s the whole point. Why do you think we publish all this stuff in plan sight? With arguments, evidence, data, examples, theory. In the hope it’s ignored?
I suppose we could sit around, proposing no plans, no alternatives, not testing our ideas in public, but rather scouring the horizon for others that do, then imagining absurd conspiracies about them, spend all our energies whinging about them, fanaticising pathetic and absurd motivations to project onto their plainly obvious and open public activities…
Let me think harder on that choice; I’ll get back to you which I think works best for improving society… and which is more likely to lead to good policy getting adopted.
Take your chill pill Patrick.
What I mean is, is the CFN2 still current? Are you guys still pushing it in its entirety?
The AT/ATAP map is obviously simpler, but it seems to be the only one you ever show anymore.
You might want to check your online conduct Patrick. You represent AT and have public accountability and responsibilities when publicly discussing AT’s transport plans.
You wouldn’t want screenshots of your public interactions appearing in a high level review of AT…
Sounds like a threat there Geoff via insinuation
Geoff, you raise a valid point about which hat Patrick is wearing. I read something on mainstream media on the weekend, commenting about their view of a strong alignment between GA and AT. People will have perceptions.
I have been concerned recently about what I call “back slapping” regarding the progress that AT has made with the RTN. Of course, celebrate success, but there is so much more to do, don’t get carried away with it.
The recent progress should be measured against the abysmal big picture – 80+ % car mode share – amongst the world’s worst – and with no drastic change anywhere in sight.
I hope the changes in prospect make a real difference; but I suspect not. I think the answer lies somewhere among road or congestion taxes; lower PT fares; and a range of measures to collect revenue to build more PT infrastructure. Politicians will find many of these measures tough, but the blue print lies with the cities who have already implemented these types of changes.
“a strong alignment between GA and AT. People will have perceptions.”
The only sensible perception is that GA have so successfully influenced public policy that the transport body is now largely aligned to them, including adopting GA’s plan for the rapid transit network.
Great post. Loving the comments from the editorial team too.
After years of you guys battling for every little win its great to see such huge wins.
Geoff you’re funny. Send for the Stasi, quick.
As was mentioned on Twitter yesterday there are days where we need to focus on the victories
There are three larger ones with
Eastern Busway
Airport to Botany Stage 1
K Road cycle way/improvements
There are plenty of small victories like removal of slip lanes and raised tables
Then there are the strategics like the CFN 2.0 blending into the ATAP
All part of good advocacy and democracy at work
But this means we don’t rest.
With the ATAP under the knife, no money for any light rail projects and other non car projects suffering set backs the real battle now beings: to see these RTN and freight rail projects through to fruition.
Reply to Graeme:
“You just have to wonder if its all worth it?” I think that’s a strange thing to say when 64% of NZers think climate change is an urgent concern. I suspect most people would agree our future is worth it. Auckland Transport says:
“3.2 Auckland context – environment and health impacts
A review of the main sources of CO2, NOx and PM10 (particulate matter) emissions in Auckland shows that road transport is the largest source of greenhouse gas emissions and accounts for 34.8% of emissions. Cars are responsible for the highest road transport GHG (24%), with commerical vehicles being the next largest emission source (11%). This highlights the importance of encouraging Aucklanders to make the shift from private vehicles to sustainable public transport.”
Your goal in looking at the figures seems to be to answer the big question of whether investing in a public transport system can deliver lower carbon emissions. This requires looking at more than just the raw numbers of carbon emissions per current passenger km. Provision of different modes affect how many km people can and can’t and must travel. Currently some people have limited access, others are being forced to do trips to provide access for their dependents. We need to look at the whole system and the behaviour and land use changes that occur with provision of infrastructure for different modes.
But here’s a summary of the figures so far:
The MoT’s 207 g/km for a new car suggests the average of the fleet will be well above this.
The bus emission figures for the Euro 3,4,5,6 buses we have, based on tendering for route conditions, with an average speed 20 km/hr (thus including stopping and starting in Auckland’s congestion) are 1281, 1175, 1138, 1163. We also have a few electric ones and will be getting more. The average emissions per bus, based on the make up of our fleet is therefore around 1180g/km – similar to your figure.
The rail emissions are presumably close to zero.
The next step is looking at occupancy levels, and that’s where we need more data for both cars and buses. Your assumptions put cars slightly better than buses; mine put buses much better than cars. But once rail is included, I’m sure you’ll agree that public transport is much better carbon – emissions wise than cars are.
Putting freight onto rail, developing quality urban public transport, establishing a national public transport network, and providing the missing networks of active travel are all necessary to reduce transport emissions, which are large and increasing. But the easiest two are developing quality urban public transport and reducing traffic speeds and volumes to encourage active mode transport.
They are also the most equitable – people who don’t drive need alternatives. They are far cheaper than a transport system based on everyone having their own car. And save enormous public health money because both involve more physical activity, both cause far fewer injuries, and their public health and social costs are positive instead of negative.
Because public transport is much more space efficient that private cars, there’s no way our roads would cope if it was removed without introducing severe equity and access problems. Only public transport is space efficient enough to move our population around, particularly as our population rises.
You’ve used figures for regional Wellington so they in no way represent the carbon emissions from Auckland’s urban congested traffic. I think it’d be great if you persevere, however. Try to get just the Wellington City figures.
The good thing is that Aucklanders are consistently asking for better public transport, and the network is developing well.