Auckland’s public transport network has undergone significant change in the last decade. The upgrade and then electrification of the rail network, the Northern Busway, HOP and integrated fares, and most recently the roll out of a complete overhaul of the bus network along with a couple of significant bus/train interchange stations. These improvements have played a significant part in seeing PT ridership increase from around 55 million annually in 2008 to 95 million now – almost half of that (18m) has been on the rail network or Northern Busway.
There are significant infrastructure changes coming in the coming decade too with major projects like the City Rail Link, extension of electrification to Pukekohe, Light Rail, the extension of the Northern Busway, the Eastern Busway and at least the start of a busway from the Airport to Botany. All involve significant construction and unfortunately most are over three years away from having impact. But improving public transport in Auckland isn’t just about the big projects. There’s still a lot that needs to be done to improve services and the overall customer experience.
Outlining just how public transport will improve over the coming decade is the role of the Regional Public Transport Plan (RPTP) and the draft of the latest version is now out for consultation. The RPTP is a statutory document that sets out the “policies and actions that will be used by AT to drive our approach to public transport planning, design, implementation and operation“. It even lists what changes will be made to each specific PT service. The plan takes a 10-year horizon but is refreshed every three years.
To give an idea of the importance of the RPTP, the version adopted in 2013 was what introduced New Network and the zonal fare structure we have today. While that plan represented somewhat of a revolution in how we plan for public transport, this version builds on that and so falls into the evolution category. But evolution takes time and unfortunately, like the big infrastructure projects, most of the good stuff is not due till the second half of the decade which puts them at greater risk should the political and/or funding climate change.
Onto the plan.
The key network changes
The new bus network that’s just been rolled out is based on the three principles of frequency, connectivity and simplicity. This means:
- Key routes that run ‘frequently’ all day, every day.
- A network designed around transfers, which helps make it possible to have more frequency
- A network that is simpler and easier to understand
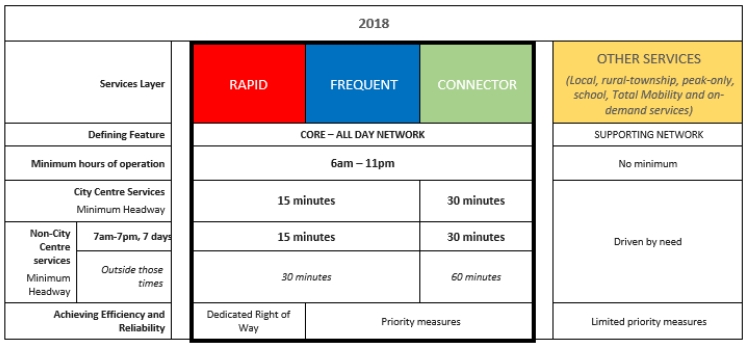
The table below shows how the network is defined – although not everything meets this definition yet, for example, the rail network still operates only every 20 minutes off peak and on weekends and the Northern Busway services don’t have a fully dedicated right of way.
Looking forward to 2028, AT want turn it all up a notch with frequent routes running a minimum of every 10 minutes all day and with those frequent services having priority along their entire route so they’re not subject to congestion. Connector services are also expected to see improvements. This is shown below.
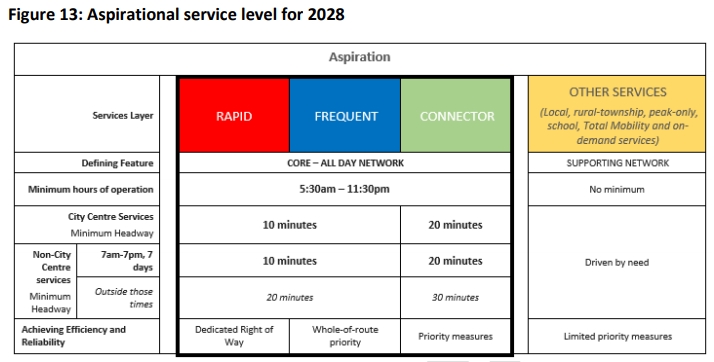
Fifteen minute frequencies are usually considered the bare minimum for a ‘turn-up-and-go’ network and shifting even to services every 10 minutes makes a significant difference to usability of the network.
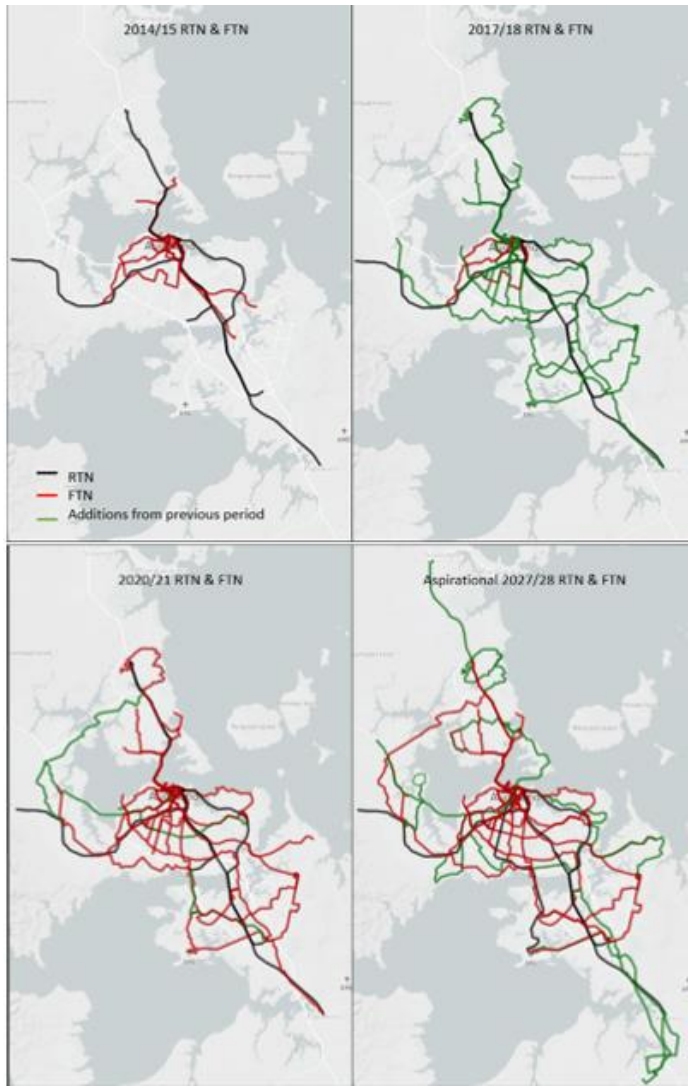
On top of services running more frequently. AT also want more frequent routes. The routes that are planned to be upgraded are shown in the maps below which shows how things have evolved in just the last few years and how they’ll change in the next three and next ten years.
As mentioned earlier, most of the changes aren’t till later in the decade and below are the service improvements AT hope to make by 2021.
- Improved public transport to the airport
- Provision of the Airport to Puhinui RTN Link
- New regional connection from New Lynn to the Airport
- Core service improvements on FTN whole-of-corridor routes
- Additional weekend services NX1 (Northern Express – Britomart)
- Additional all-day and evening frequency on route 95C (Glenfield Road frequent branch)
- Additional all-day frequency on route 27 (Mt Eden Road)
- Additional weekday service at all times on route 33 (Great South Road/OtahuhuPapakura)
- Additional peak and evening service on route 32 (Massey Rd/Mangere-Sylvia Park)
- Additional inter-peak frequency on route 24 (Sandringham Road)
- Additional inter-peak frequency on route 22 (New North Road)
- Additional peak frequency on route 70 (Botany – Pakaranga – City Centre)
- Other improvements
- Extra inter-peak and evening frequency on 195 (Blockhouse Bay Road)
- Extra peak frequency on route 743 (Glen Innes – Panmure – Otahuhu)
- Extra peak and inter-peak service on route 966 (Highbury – Ponsonby – Newmarket)
- Extra peak service on route 323 (Panmure – Carbine Road/Panama Road – Otahuhu)
- Additional evening frequency 35 (Manukau – Ormiston – Botany)
Perhaps the key infrastructure delivery to support these plans over the next three years is what AT call the Integrated Corridor Priority Programme which aims to give buses on parts of the frequent network the whole of route priority mentioned earlier. The corridors being focused on are below but are only for the Isthmus and South at this stage.

Improving access to PT
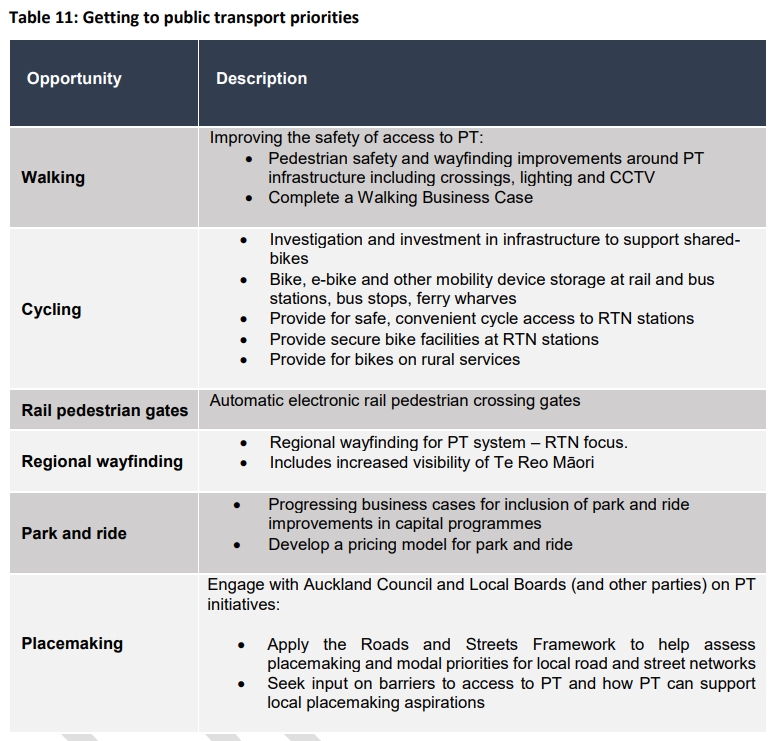
Along with making PT services better, AT also say they want to make it easier to get to PT. This is very much needed and one of the big pieces of low hanging fruit that exists. Here’s a summary of how they say they’ll do it.
Some other interesting bits
There’s quite a bit in the plan but some of the parts that particularly stood out include.
The impact of PT
This comes from the section looking at the impact the improvements to PT have already had. The comment about the impact on the harbour crossing really helps to highlight one of the values of good PT, it saves spending a lot more on some big, expensive roads.
However, at the sub-regional level the public transport network has successfully played a key role in increasing the capacity and throughput of some of the most critical parts of the network, especially during the peak period. This has enabled more Aucklanders to travel at peak times and access popular destinations. For example:
- A combination of PT, walking and cycling has allowed the city centre to keep growing without increasing reliance on private vehicles. More than 50% of travel to the City Centre in the peak is by PT or active modes.
- Around a third of Aucklanders making trips over the Auckland Harbour Bridge in the morning peak-travel period take the bus. By increasing the capacity over the bridge the Northern Busway has delayed the need for an additional harbour crossing and spending billions of dollars, freeing up funding for other transport projects.
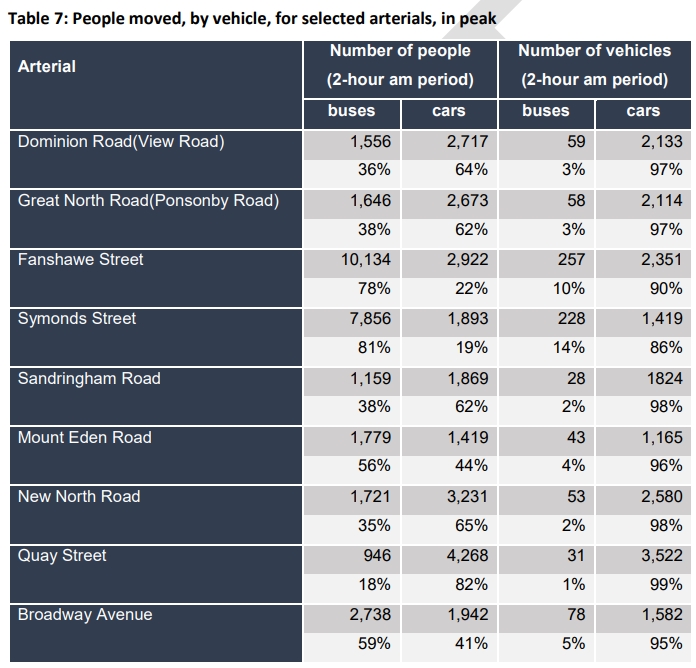
- During the peak periods, PT carries over a third of the people on key isthmus arterials such as Dominion Rd. (36 percent, am and pm peaks) and Great North Rd. (38 percent am and 42 percent pm), increasing to around two thirds for major routes into the city centre such as Fanshawe Street. (78 percent am and 66 percent pm) and Symonds Street (81 percent am and 82 percent pm).
It then includes this table with a break down by road.
Getting a better understanding of the true impact of PT
Alongside Central Government and Auckland Council, complete an investigation into the wider social, health, environmental and economic benefits of public transport with a view to expanding the vote-funding base accordingly for developing the public transport network
AT to investigate buying PT assets themselves
Undertake a Programme Business Case to investigate the purchase of key public transport assets to lower barriers to entry into a competitively tendered market such as depot, bus and/or ferry purchase
Outer Link to be reviewed
One of the biggest disappointments from the new network was retaining the Outer Link as is. AT have signalled they’ll review it and the Balmoral Rd crosstown services in 2019.
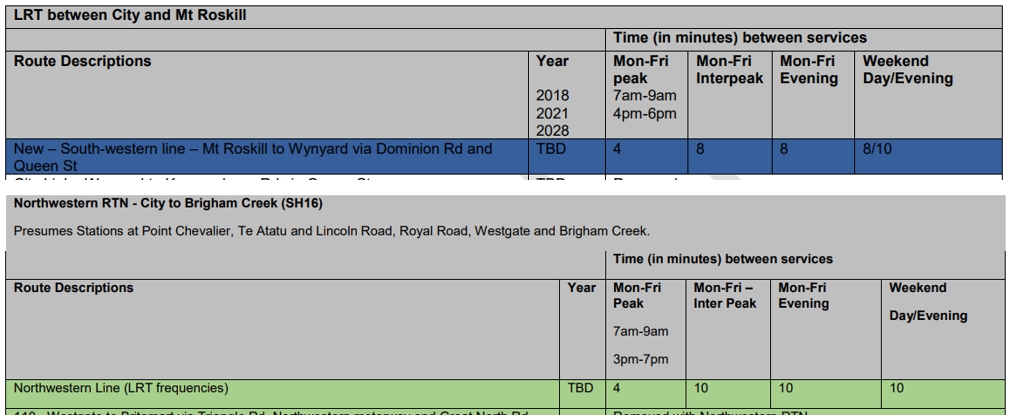
Light Rail frequency good
As part of listing details about all services, AT have to specify the frequency it will run. It appears frequency will be excellent with services every 4 minutes at peaks and at worst every 10 minutes on weekend evenings.
The not so good bits
There are a few things that particularly stood out to me as no so ideal.
The Farebox Recovery Ratio remains in effect
There’s still far too much focus on how much is collected in fares rather than looking at what will deliver the best overall return. The government have talked about changing this but we’re still waiting to here more.
Too slow on the uptake of electric buses
AT say that they’ll require new buses entering the fleet from 2025 to be low emission (electric). This seems too far away.
The role of PT
The plan, particularly in the text, still feels like it is too heavily focused on peak time commuters and dismisses or ignores the idea PT for a wider variety of trips
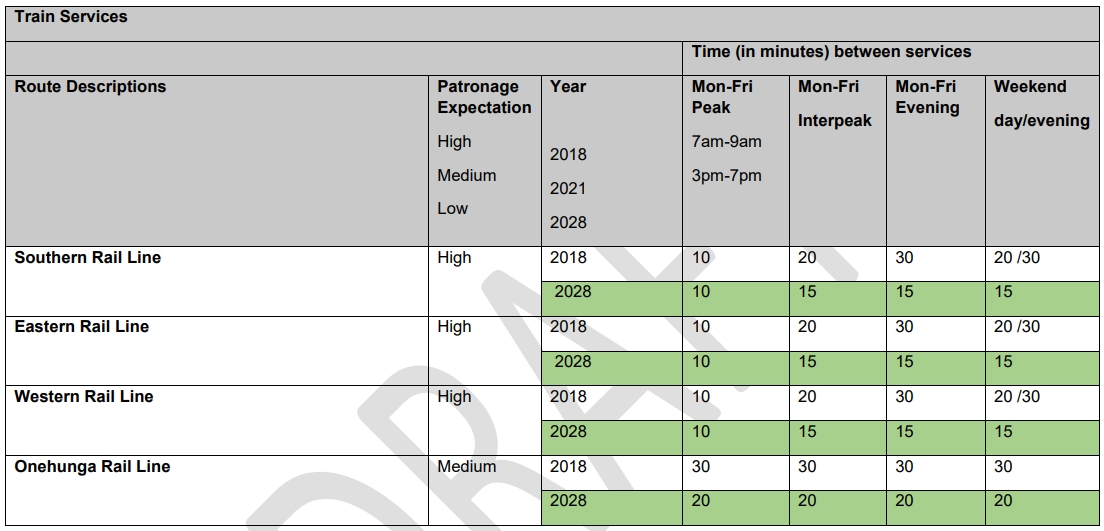
Train Frequencies vague
ATs service lists include the proposed changes to frequencies for each service, many with changes in 2021 and again in/by 2028. Rail notably doesn’t have anything till 2028 and bizarrely remains below the definition for a frequent service.
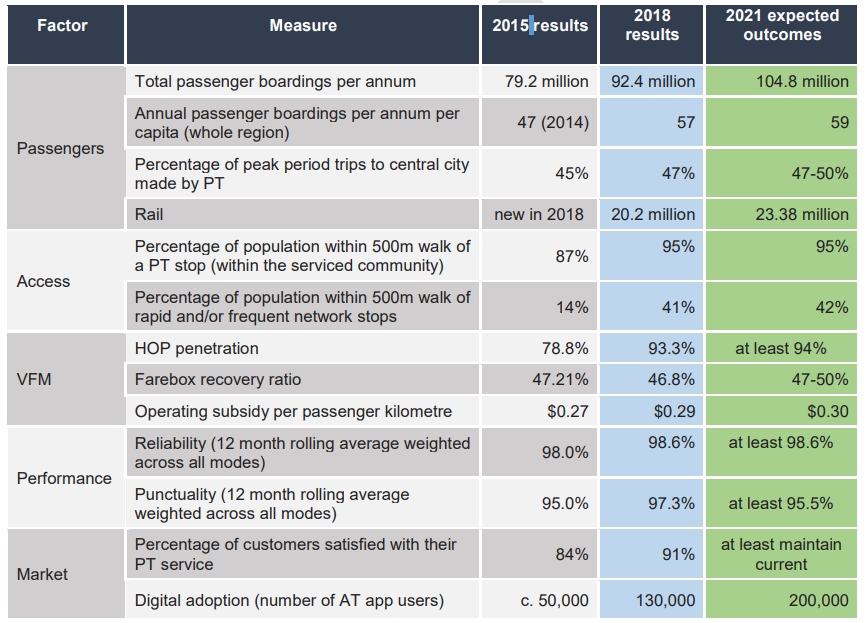
ATs expected results
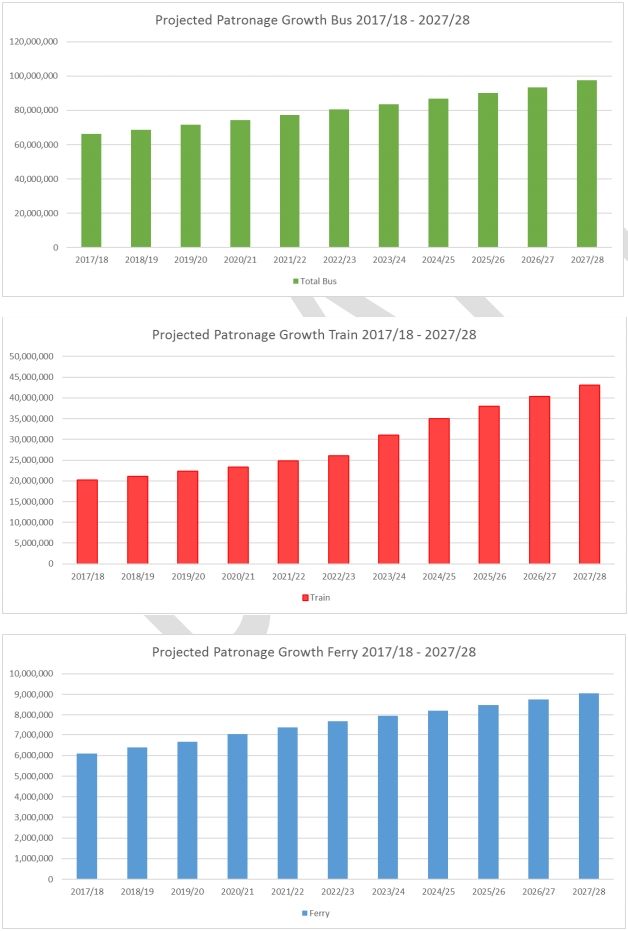
Here are what AT expect to achieve as a result of all of this investment. First, the 2021 results and while most are about keeping things about as they are now. the one that really stands out to me is the overall boardings number. Increasing to just under 105 million boardings represents only about a 4.3% increase in PT use per year. Given we’ve only just finished rolling out the new network this seems too low. To put it another way, in just the few months since the end of the 2017/18 financial year (30-June) boardings have already increased to 95 million by the end of October and it would not be implausible for us to reach 100 million by this financial year.
Looking forward, AT say they expect boardings to increase to 149.7 million in 2028 with rail trips more than doubling to around 43 million. However, they say these figures don’t include the impact of Light Rail to Mangere or the Northwest, both of which would generate significant ridership. Notably, the 150 million trips AT are predicting is significantly less than the 170 million trips ATAP says we’ll achieve by that time and while light rail may help close that gap, it won’t completely.
If AT and its partners manage to pull all of this off, in a decade PT will look and feel very different to what it was just a few short years ago.
Let me know if there’s anything missed that stood out for you.
The consultation is open till December 14 and there are some public sessions that people can attend listed on the website. What they haven’t included on the website is actually how you can submit your feedback – let’s hope that gets fixed soon.

 Processing...
Table 7 is a great example of why we need more continuous bus lanes along the key arterials and anyone who opposes can just shove it. Such a small number of vehicles carrying such a large number of people. It’s a no brainer that bus lanes are great uses of public space to move the public.
Yes, and when you look at the map for the Integrated Corridor Improvement Programmed, with some knowledge about the space constraints there, what are they going to do? They say the corridors will include Bus Priority, Safety, Walking and Cycling.
It’s clear what to do on places like Pakuranga Rd – where you can see people walking along the road because there is no footpath. A woman pushing a pram along the road for this reason was recently photographed! That road has many lanes that can be converted.
But what about older roads like New North Rd? To fit walking and cycling with the widths they need for Safety, and in a way that encourages modeshift – that is, makes it a Healthy Street, especially with trees – and to fit bus priority lanes, they’re going to have to do what cities succeed at doing overseas. One-way, no-general traffic, what’s it going to be, AT?
The solution with the least impact on driving would probably be three lanes – one each way with a dynamic bus lane in the centre, and no median strips, no parking. Since even this will bring resistance, I’d say AT needs to turn its public education programme up a notch too.
Hi Heidi
Are you sure that’s not Pararekau Rd? Pakuranga road has foot paths for its entire length.
Yes, quite sure. Have a look opposite Kentigern Close.
Now that I know where Pararekau Rd is, that’s a bit of a concern!! https://www.google.com/maps/@-37.0729967,174.920324,3a,90y,81.01h,68.58t/data=!3m6!1e1!3m4!1sUQ7mdZ2nmdZib0VxQVAx8Q!2e0!7i13312!8i6656
I’d prefer to age ungraciously and unwashed on an at-grade carpark in the city centre than left in a retirement village isolated by car infrastructure like that one…
One of those corridors in particular interest is New North Road. Currently this operates as a clearway in peak hours, only inducing demand for car travel and making buses get stuck in the congestion with them.
new north road really needs to get rid off the on street parking. It’s a vibrant bustling street most days but there’s no outdoor seating for the restaurants because of all the cars.
It could be one of the cites best dining experiences but it’s squandered.
That should have happened at Mt Albert after the village upgrade. Instead it’s still a gauntlet of cars blocking the carriageway to reverse in and out of on-street parking.
I’d also like to see something done about it in Kingsland.
You have to wonder why they are going with Dominion Rd first for light rail. More passengers travel on Broadway, New North Rd, Great North Road and Mt Eden Road.
Is it to do with bus travel times?
Thanks Matt. The budget for all this needs to be increased.
There seems to be a mindset that eking out a bit more priority for buses can be justified because it might reduce capital expenditure on new roading… How about lots more priority must be given to buses because the impact of the SOVs on walking and placemaking is so negative?
The target for the number of people entering the city centre by bus is way too low, once you look at it in terms of the liveability of the most densely populated area in New Zealand.
Heidi, yes absolutely there needs to be lots more money. I still believe that applying any money derived from a feebate scheme only to price improvements on PT is likely to deliver huge carbon emission reductions and huge PT ridership increase.
Why is punctuality dropping from 97.3% in 2018 to at least 95.5% in 2021? With more bus priority it seems the wrong way round, unless they’re planning to speed up timetables. Are they?
I’m intrigued by the line that says: “investigate the purchase of key public transport assets to lower barriers to entry” – that would be a massive step-change in procedure. Does that mean turfing out the PTOM ? That would be a great thing, as the PTOM seems to suck.
Are they talking about buying, say, the electric buses themselves, and then getting tenderers to bid for the rights to run them? Or are they talking about buying the bus depots and making them permanent assets, rather than each competing bus company have to find its own depot space?
It makes sense as the recent change in Wellington left bus depots abandoned when new providers who won the contract had set up their own. But this leaves things only one step away from owing all the assets and running the services themselves, just like it used to be in most cases. Returning to that would mean that subsidies weren’t simply being used to add the profit component. Remember the profits were meant to come from the extra efficiency privatization of bus services was meant to bring.
Agree. The ideologues left us with less control and less money. A shift back would be very welcome.
steven joyce left us with a nasty legacy that will hold pt back for years.
Depots I expect; they’re a much larger barrier to entry than buses.
Also big investment needed in charging infra at depots (bus depots and ferry wharves). Probably best done by public owner than individual operators. In partnership with electricity network companies.
Agree.
When they integrate cycling into their PT network, it’s going to explode in the CBD and in other place where there is safe infra to ride to the stations. And they will struggle to keep up with it, and it may even force their hands to change focus.
Hopes and dreams of mine, I guess.
I want this so badly! https://m.youtube.com/watch?v=L3M_GM_MDg8
Best way to increase public pressure for better cycling infrastructure is to lower the speed limits throughout all the local roads to 30 km/hr. As seen in Berlin, this meant lots of people took up cycling and there was public support for cycleways along the arterials and other cycling infrastructure.
AT needs to lower the speed limits to 30 so our population can make this welcome, healthy, switch too.
Oh my god. That is just pure cycle porn.
I’ve seen what bus priority opportunities get ignored in projects along roads that aren’t on the Integrated Corridor Improvement Programme. Even roads with over 18000 vehicles/day on one lane each way. If you look at the map of which roads are included, and see that some roads crying out for road reallocation – like Balmoral Rd and Greelane Rd – it’s clear that turning their PT up a notch is about 10 notches too few.
The increase in opex budgets that is signaled in the draft plan is to be applauded, but there is a risk that “local” bus services will be downgraded to pay for at least some of the increased frequency on Frequent and Connector routes – there is no specified LoS for local services, just a statement that it will be “driven by demand”. The investment in bus priority will be a double win – more patronage through better journey times and the ability to recycle wasteful opex (buses stuck in traffic) into more frequency.
Matt – your observations on the “peak focus” of the document are spot on. The concepts of an all-day, 7-day PT network seem to be getting diluted by the focus on peak congestion – I know that was a requirement of funding rules under the former government (if you weren’t relieving serious congestion, then you didn’t get funding), but surely the world has moved on now. Growing demand outside the peaks and actively pursuing policies that seek to spread the peak seem to messages that are on the margins in the current document.
I note the previous RPTP aspiration of having a 6am to 9pm span for frequent service has evaporated….
Wish we could get it revised, then. That would be powerful.
Ooops that was actually supposed to be a reply to your next comment, but I guess it makes sense here, too….
Table 7 must be counting both directions in total, which is fine, but if you look at the peak direction you’ll get a much larger PT share.
Can GA ask for the peak direction figures?
Their predictions for Access – no improvement over the next 3 years on one measure, and only one percentage point increase for the other – means AT won’t be meeting one of the prioritised goals of the GPS.
There are only two prioritised goals in the GPS, and this plan shows they’re not meeting one of them. Surely that means a rethink? I realise it means Council and Government have to do the rethink, because it is their programme of greenfields development that means more residences being put in near RTN and FTN routes can only hold their own against the many residences being built in inaccessible places. But AT should be advocating for change to the greenfields programme, pointing out their inability to meet the GPS’s Access priority goal if it continues. And pointing out how much more money there’d be if we weren’t wasting billions on the wrong infrastructure – more roads to sprawl.
I would add to the not so good is the the way the PTOM is structured and why the Minister of Transport is so oblivious to this?
Firstly its profit motive, because why else would private bus companies be in business? This aspect of PT takes away the ability to ensure every cent of spending on PT, goes towards it and not shareholders.
And why, yet another PT strike, this time in Hamilton, this time Go Bus that are paying their drivers shit money so they can win tenders to collect rate payer money.
Secondly and I think surely the most subtle is if one wins a contract and profit is the motive, why would that company turn on the air conditioning in its buses? Think about it, no air con, less fuel, more profit. I have lost count of the buses I have used that it doesn’t work or as I found on HE253, Howick and Easterns route 70, the A/C whispered out when stationary and went hot in motion. The trip was revolting as a result. The driver said she had no control over it.
Next bus I caught did not get to the speed limit, once! 41 km/hr over the harbour bridge, that is half the posted limit and the traffic was light. 30 -35 km/hr in a 50 zone. Jesus wept, it made my journey literally 3 times longer in that instance than if I took my car. Saved some diesel I guess.
So, do I take my air conditioned car, or a glacially slow stuffy bus? Tough choice AT!
Public ownership of PT is typically inefficient. At least that’s what I see in the numbers (happy to be proven wrong).
Direct comparisons are hard but you can get a feel for things by comparing rail/bus operating costs in Australian cities to NZ. In South East Queensland, for example, the state spends almost $2 billion p.a. running a rail network that carries approx. 50 million pass p.a. In Auckland we spend approx $200 million p.a. to carry 20 milllion pass. p.a. i.e. one quarter the cost per passenger. While some of that difference is due to the longer trips in SEQ, that doesn’t seem likely to explain all of it.
As for buses, the picture is a bit muddier due to differences in contracting arrangements (gross versus net etc) but it looks like ~$4-5 buys you one km of service in Auckland, whereas you need more like ~$6-7 in Brisbane.
All these comparisons are derived from publicly available data (operating costs amd GTFS data).
So it seems to me that if you want to reduce the services you can buy for a given budget then public ownership is a great model. At least the way they do it in Aussie …
And before i get accused of being a neoliberal hack, i should say that my heart leans left.
Have you done a comprehensive analysis looking at places like Northern Europe and South America, too?
Heidi, wages are so low in much of Sth America that I am not sure that a comparison would be helpful. In the places that I have travelled fares are also low probably because of the low wages and occupancies are often high. I think that you might be comparing apples with acai berries.
Quite possibly. But within South America, there could be places where it is more publicly owned, and others where it is more privately owned. That would be a useful comparison. Similarly in Europe. And in the US. I’m just wondering about how comprehensive Stu’s analysis is.
How do you know it is public ownership that is the cause of the difference? It could be state and federal levies, or taxes. It could be road user costs (it surely cannot be fuel prices) or any number of other expenses.
One thing that may cause extra expense is the sheer insanity like paid overtime and decent pay rates as you get in Australia. And to be honest, if we were to start paying like in Aussie on all levels, then so be it, bring it on! I know AT are misers when it comes to pay and conditions if they are directly employing (except for the executive level, of course).
And as we know Aussie train drivers get paid far more than here and its probably the only reason drivers here even get as much as they do, otherwise AT would merely be a training school for Aussie!
Only comparing to Australia isn’t ideal as other research had shown then tend to have much higher PT opex costs than other “new world” anglophone cities. Canadian and US tend to be about the same as us for opex per km as we do and many of those systems are publicly owned too.
I think there could be some value in AT owning the depots and hardware then leasing it to operators. For one thing, it might help provide a more consistent experience and have some economies of scale in procurement. It also makes buses and ferries more like how the trains operate.
Finally, IIRC TfL own the assets like the buses but lease them out to their commercial operators so this would be in line with that.
Yep, public ownership of indivisible assets is fine. I think wasp was arguing for a more extensive public ownership model, however.
In terms of how i “know” private contracting is efficient, my humble philosophical side asks whether we really know anything? And your comment simply begs the the same question in reverse: how do you know public ownership is more efficient? Of course the answer is neither of us really know for sure either way
And yes there are lots of reasons why OPEX in Aussie might be different. Nowhere is an ideal comparison.
At the same time, the I see cities in Australia that have contracted out their bus services realising per unit Opex cost savings in the order of 20-30%.
I believe, given ATs decisions to run more services than initially planned, that they realised similar savings here in the wake of PTOM. Probably slightly smaller due to fact we were more efficient to begin.
So waspy, unless you have some data to bring to bear I think we’re done?
I think AKL has a decent model, really, and public ownership of depots and perhaps vehicles would reduce barriers to entry in the next round of contracting.
A decent model? Pleeeease… I’m not allowed to see what measures a bus company is taking to introduce specific driver training on a route, because that’s a private issue not in AT’s control. Changes needed, but that only become apparent after contracts are let, have to wait for the contracts to come up, instead of AT having flexibility to shift resources. And the killer for me is not knowing what profits they’re taking, because that’s private information. Therefore we don’t know what of our money is being put into the coffers of shareholders.
There seem to be a good range of models in Northern Europe to analyse. If it’s been done, I wonder if anyone has critiqued the analysis?
Let’s not forget that an inefficiency in public transport may not really be an inefficiency once you start looking at the modeshift it might have encouraged, and the air quality, climate change, public health, urban form consequences of that. So it’d have to be a really good analysis.
Meanwhile, your generation, Stu, is having to pierce through the neolib propaganda you were weaned onto. You do a bloody job of it, but sometimes, I wonder… 🙂
There is no reason that public ownership of PT should be any cheaper or more expensive.
The benefit of public ownership comes from being able to manage all the components of the system in the public interest, without having to enforce that through a contract.
The downside of public ownership is the organisation becoming a large bureaucracy that tries to solve numerous non-transport related issues, much like NZR from 1950s to 1980s.
Heidi it’s standard for financial information to be kept confidential. Pretty much everywhere? If it wasn’t then you’d probably get fewer bidders and less competition, especially from larger operators for whom the Auckland market is relatively less important. I’d argue the larger operators (who incidentally tend to have lower profit margins) are the sorts of operator we want in Auckland, rather than the hyper-local bus company fiefdoms that currently exist.
Ultimately PTOM is competitive tendering with a grandfather clause that favours incumbents. I don’t like the latter but it won’t apply next contracting round afaik.
In terms of bus driver training, i don’t think the company should have to tell you what they do. But I would ask whether AT sets expectations/standards around training and how they monitor compliance.
One place to watch might be Helsinki. It looks like the planning, management and operation have all been publicly owned until this year? Now the bus operations have been privatised. I wonder what the effect on efficiency – and on information availability – will be.
I suspect our model is pretty good too just perhaps need a NZ wide special minimal driver conditions protection law that IIRC the government was looking into. Too easy for them to become the target of the cost savings. The driver strikes surely at a sign this is needed. This and the AT owning of assets as mentioned sounds good to me.
Is it because AT do not own the bus hardware that we have the plethora of busses terminating in streets distributed all around the Cbd? Instead of a proper central bus terminus.
I don’t see anything in the revised RPTP for a city bus terminus, or have I missed it?
The South Eastern Queensland rail network consists of 13 lines witha system length of 689 km. There are 205 trains in service with 75 more under construction. Don’t you think the size of the system relative to Auckland’s toy network would explain a great deal of that cost difference?
Well that only suggests that the SEQ network is incredibly inefficient and unproductive compared to Auckland. A system length almost seven times the size, with ten times the government subsidy, to move only two and a half times as many people!
That suggests Auckland’s ‘toy’ system is at least four times more effective per unit.
the fares seem quite cheap in SEQ, well when using a gocard anyway
Yes Auckland’s system is.much more intensively used. And post CRL we’ll have similar levels of patronage to seq.
As for the latter, i know it well. Note that the size of the network impacts more on infrastructure costs, whereas here we are talking mainly about operating. There may be a link through track access charges but I’d have to do more digging.
Part of the high costs in seq, from what I have heard, is associated with accounting shemozzles. But there seems little doubt that the state-owned Queensland Rail are expensive service providers.
It’s useful to compare AKL and SEQ to Perth, where rail carries ~90 million pass p.a. at a cost of about AUD $.50 perkm. Auckland is about NZD $0.25. QR would be much higher than Perth methinks.
https://www.google.com.au/url?sa=t&source=web&rct=j&url=https://www.committeeforperth.com.au/assets/documents/ReportWWTWKU_TheEvolutionPerthPassengerRailJune2011.pdf&ved=2ahUKEwiQmI6s-uHeAhVLQ48KHRrxBcIQFjAQegQIBBAB&usg=AOvVaw3TmJTfzOAqTFQEQN3EKLdv&cshid=1542682140246
Surely the aircon in good operating condition could be added to the PTOM contracts if not already so. Don’t need to throw the baby out with the bath water.
I would imagine A/C fitted and working is a basic requirement in 2018. I know some of the older fleet doesn’t have that but at least you can open windows. And realistically no operator can upgrade tbeir entire fleet quickly!
But who is checking if bus companies are doing the right thing?
Who is checking if they dribbling around the streets? The timetables have so much fat built in, it encourages slow trips!
These things turn off the attraction of leaving the car at home!
Very concerned about the low-ball ‘expected outcomes’ they look designed to be easily met. And/or are an indication of a lack of attention to strategies of ‘transformational’ mode shift of both government and Council.
Would much rather AT set ambitious targets and missed by a bit than low-ball ones and slayed them… Perhaps this is a culture issue?
No plan to make the rail core of the RTN actually rapid all day for another decade risks the entire PT strategy: The top of the hierarchy must be, well, top. This should be a matter or urgency. That 10 min freqs are possible at peak means they must be technically possible interpeak too.
Love the expansion of the FTN to more and more routes.
A great deal hinges on the Corridor programme, the detail here, especially at intersections, will be crucial. Turning lanes and flush medians will need to be switched for PT and Active modes…
Is there a possibility that AT might be afraid of bold targets because of the possible public attack/loss of further PT funding if the targets are missed even by a little bit?
An outcome that follows logically from a risk-averse and education-averse organisation culture.
The low-ball ‘expected outcomes’ are simply in line with the RLTP and ATAP. Let’s not pretend PT is going to improve much when we’re wasting our money on roads. The induced traffic is insidious, in terms of its effect on both traffic volumes, and mindset.
Gone is the era of campaigning for better PT. We need to campaign to stop the road building, or we’ll be stuck with realistic low ball targets forever. Exceeded, when they are, only because of spasms of increased access made possible in small pockets, as a way of giving the impression that AT are living up to their grand words.
I agree Patrick. We keep hearing about better PT, cycling, walking, etc. So why not make the AT board and management incentivised to deliver? Things tend to happen a lot quicker when someone’s big fat bonus hinges on it. All that low hanging fruit that hasn’t been picked will magically become a priority…
Patrick, well said, but way too polite. 4% growth is a disgrace particularly when the ten year target is ridership of 170 million. It makes me wonder whether Lester Levy has even read the lofty words on top of his name in the Annual Report.
CRL is now 2024 and so with AT’s current plans ridership seems stalled. I wonder what the climate change Minister’s thoughts are about this because it seems Auckland’s continuing emissions growth will be a real impediment towards achieving any meaningful reductions.
Roll on the Vienna Solution.
I always thought Dominion Road was the busiest bus route other than NEX – yet it is way down that list. I wonder why it was chosen for light rail over say Mt Eden Road?
Exactly. They seem to have chosen it as a way of replacing buses rather than as a means to carry more people. Looking at the car numbers you can see it will have more impact on Dominion Rd than on many of the other arterials.
There was a post here a while ago showing overall volumes using each corridor. Dominion Road was ahead of everything but the Northern busway and Onewa Road, not sure why this data is different?
Suggesting the peak / off peak pattern might be different? If that means Dominion Rd has higher offpeak numbers, I can see why that would support a better case for light rail.
Dominion Rd has more overall buses and ridership but I don’t think it’s as peaky as other routes and does better off peak and on weekends.
yes the 8 minute inter peak frequencies that light rail brings will be a step backwards for dom road. The high off peak use is either driven by or drives the useful 5 minute frequencies.
And what happened to the bus priority measures for dominion rd. a while back here it was detailed how the bus lanes were going to be made continuous through the intersections and now dom rd has dropped off the Integrated Corridor Priority Programme map.
What you’re missing with this sort of analysis is network thinking; Mt Eden, Dom, and Sandringham should always be considered together, Dom is absolutely the right route for the capacity and quality uplift being, among many other things, in the middle. LR there will enable the parallel bus routes to continue to work well too, while drawing riders from across the Isthmus.
And yes Miffy it is intended to reduce driving volume there, even if NZTA can’t bring themselves to admit it… no doubt this kind of thinking will take quite a while to be accepted in that organisation, as in AT.
Patrick perhaps you could stand out there on the side of the alternate roads people divert to and tell people they really shouldn’t be driving. Not sure how you will tell which ones previously used Dominion Rd though.
Come, miffy, those local roads need road blocks to make dead ends. In today’s world of Google instructions and saturation congestion, it’s the only way to cope. Increased people flow on the arterials, and local roads returned to local uses.
I like dead end roads Heidi but very few urban designers do. They have even tried to connect them up especially so people who live there can have a through traffic problem too.
Oh really? Where? Did they succeed?
Dead end roads? Do you mean, as in cul-de-sacs? You do know that cul-de-sac literally means the end of the bag, don’t you Miff? It’s like the appendix – a relatively useless little backwater, cut off from the main passage. But in my case, cul-de-sacs literally give me the shits. Give me some decent through traffic any day.
When people can walk, cycle, scooter past the road block, though, it doesn’t feel like a cul-de-sac. The benefits are permeability and safety without the through traffic.
You’ve probably all seen this, but for those who haven’t:
https://en.wikipedia.org/wiki/Braess's paradox
Connecting more roads together to speed up traffic flow may actually make congestion worse.
Gaaaaah
https://en.wikipedia.org/wiki/Braess's_paradox
I do believe one of the readers here used it in a submission against the EWL, a classic situation that could be subject to the paradox.
No one needed to do that when Albert St changed from 25000 to 2500 vehicles a day simply by digging the middle of it up.
I know they teach that vehicle traffic is exactly the same as shit in a pipe at Engineering school, but, rather than only obeying the laws of gravity, we all actually know that cars have drivers, and that drivers have agency. People change their behaviour readily when faced with a new situation.
It is very easy to conceive of all sorts of changed, and better, behaviours occurring after we change the streets. And especially as that comes with a new fast and direct stylish LRV turning up every 4 minutes.
So what’s likely? Above says there are ~1000 drivers, both ways, per hour at the peak on Dom Rd. Even if only half of them changed to either using Waterview (say those from the other side of SH20) and some choose to drive o Mt Eden or Sandringham Rds, then we only need a few hundred to use the new LR or some other mode like cycling for it yo all be peachy.
And is simply isn’t credible that the only LR passengers will be current bus users, that is not consistent with every other PT improvement undertaken in AKL in the last couple of decades. And this improvement is a massive one. The directness, priority, frequency, and quality of this is going to be an exponential uplift.
Everywhere modern LR has been added well to cities recently the ridership problems have been on the upside not the low one.
This will work very well. Too well maybe…
Last Saturday’s conversation in point: ‘Heidi, you’ll never believe. I’ve started taking the bus to work. It’s wonderful. I didn’t know why I didn’t do it ages ago. It’s so much more relaxing. And there are so many buses at that time in the morning. You never have to wait long. And I can get things done. I LOVE it.” True conversation. Local mum who works in town.
Yes I think the risk is very much on the upside. The stations on LR seem to me to be much better positioned than the ones on HR, and with the addition of the airport, I suspect LR will move more passengers than HR.
Table 7 doesn’t make sense according to the data I have at hand.
The only way I can reconcile the figures is if they have taken the snapshot on View Road itself. However this misses the additional 600 passengers in the two hour peak that use the dominion road expresses and other routes that run past View Road.
Why you wouldn’t measure the busiest point on the corridor I don’t know.
Dominion Road is indeed the busiest bus route outside the northern Busway.
Of course the number of users is only part of the equation, the other parts are the number of buses replaced and critically, the ability to replace them.
Dominion Road is relatively simple to replace bus with LRT along the whole corridor from Dominion Road, up Ian McKinnon to Queen St, creating one corridor that has LRT and LRT only.
Mount Eden Road on the other hand shares its bus corridor with New North and Sandringham Road serivces, then joins in with umpteen others on symonds st and Anzac. So converting Mount Eden itself to LRT would be one thing, but then what do you do with all the rest of them along the way? Mount eden is only one of about 18 routes on that bus corridor.
Same issue with Broadway etc, they are busy bus corridors because they talk routes from all over the isthmus and east.
The reason they decided on Dominion Rd is there is a designation along that makes it easier to knock down old buildings and widen the road so the light rail will fit.
There is a road widening designation along Mt Eden Road too, and various others.
The number one reason they picked Dominion Road is that it points straight into Queen Street, unlike any other route which is full of various buses. So you can add the new capacity as new capacity, and not just as replacing bus capacity with the same amount of LRT capacity.
+1. It’s almost as if Dominion Rd was destined to become the perfect first light rail link in NZ & also gives an alternative to the airport which also means a RTN for Māngere. So many birds killed with one stone I can’t believe it. (Disclaimer: I don’t think we should kill birds with stones or generally with anything).
Rather than aiming for 10 minute frequency we could go for 12 minutes so 5 per hour. The other thing that looks useful would be the bus priority lanes into and out of the Manukau bus station. It can take ages to get there if traveling on the 33 bus on great south road too many traffic lights.
And yes too slow on the introduction of electric buses.
Why would we want them aiming for a lower quality?
Bus Lanes are definitely needed along the 33’s route.
Pedestrian Access to stations has, in my experience, been generally sacrificed in order to gate stations. Having to walk the entire length of the platform in order to get to the single entry point is, in fact, quite an additional ask and makes the station much further away.
Nothing much about fare price except the percent fare recovery. I still see a number of parents get on the bus with there own HOP cards and then have to pay for the kids. In my view the kids should be free if they are accompanied by an adult with a HOP card.. The parents could have a special endorsement on their hop cards to allow for family travel. I am sure this would reduce the number of cars endlessly circulating around the suburbs and reduce the number of near empty buses as well. In addition it would be a good thing for families who exist on a benefit as it would reduce the need for them to own a car or at least save them money running a car or a second car. And good education for the children on how to use public transport and why they shouldn’t ever be completely dependent on the almighty car.
We need something to discourage that driving of kids around to activities, and it needs to involve the parents not even having to go with them. Like cheaper fares, safer pedestrian amenity to and from the bus stops, and a culture where children know they’re not going to be picked on.
I’m speaking from experience here; the ongoing work of keeping a group of four boys in my street going to a gym class together by bus. If the parents have to go to something local to the gym class, whoops, there goes the bus ride. Because there’s no way the parent will consider taking the bus there for their own travel. If they get growled at for not going far back into the bus enough, or frowned at for being a bit clumsy as they move around to sit next to each other when a seat comes free, or if the bus doesn’t stop for them on the way home at rush hour, whooops, there’s the pressure from some of the kids onto their parents to pick them up next time instead.
Free bus fares for accompanied children doesn’t fix any of this. Better pedestrian safety, lower bus fares for children and adults, and higher parking prices near the gym, would all be helpful.
Having said that, maybe free bus fares for accompanied children could be extended up to age 8 or so?
Integrated fares would also help a lot for this. Taking a family of four to the museum by public transport should not incur a $50 hit.
Where is AT’s commitment to fare equity and to extending the frequent transit network beyond 40% of Aucklanders, and why are there no targets for reductions in vehicle dependency such as a reduction in the size of the vehicle fleet or total fuel usage?
Fully agree; family fares, Sunday caps, off peak discounts, all of these things should be in the mix…
“off peak discounts”
What’s AT’s excuse? Got to be a deliberate policy decision not to do it.
Its so basic even GWRC managed to do it (eventually).
As per post & comments above, can’t believe the train frequency targets. Also not until 2028 for 10 min frequencies on FTN bus routes?!, Com’on was seriously considering giving up the car but not with that kind of target…let alone reality of meeting the target.
Case in point actually yesterday, family members travelling from Mt Wellington to a sports activity in Manukau midday and returning just coming into some peak times. Still the same, even luckily for us a choice of southern or eastern train lines, & two buses or 3 buses, all takes about 1:06 mins, no matter what the combination is, yet car ~12mins plus parking etc I guess. Most of this was due to useless 20 min interpeak train frequencies not aligning with 15min frequent bus or 20/30 min local bus ones.
Looking at the documents of local or connector routes planned to improve in 2021, I see some slight improvements to a handful I’ve used. So many more I’m sure could be better than hourly weekend ones by then for example the 782 to Mission Bay.
Farebox recovery not really the constraint given council debt limits. Also, Auckland is not out of whack with other systems. I think 50% is about right, probably a bit less in the short run and a bit more in long run.
Also, high farebox recovery rates are not all bad: they signal that you’re efficiently delivering services that people value. Of course if people truly are income constrained then higher fares will be bad.
When thinking about farebox recovery the question I ask is whether the average marignal user would prefer lower fares or better service?
If you think the former then lower farebox recovery makes sense. On the other hand, if you lean to the latter, as I do, then higher farebox recovery may be appropriate (given that it allows for more/better service for the same gross cost).
Parking revenue. $137.5 million just from levies in the city centre if we were to do what Sydney does.
Stop wasteful expenditure on new roads.
Then the farebox recovery can be changed. And service can be improved.
Could you see an argument for counting parking revenues that AT themselves keep as part of farebox recovery (if they don’t count them already)? After all, it’s all meant to be one integrated system, right? Parking costs aren’t just metaphorically the fare of driving but do have meaningful impacts on public transports (affecting passenger numbers obviously, but also the levels of congestion faced by busses).
Yes, it should certainly be put to good public transport use, anyway. The induced traffic effects are well known. And as the strongest determinant of parking demand is parking provision, AT’s provision of free and cheap parking is seriously impacting public mindset and demand for keeping parking. What public education campaign – even if they chose to finally implement one with any substance – can fight against the mindset they are incubating through their policies, that parking is a right?
I think we’ve discussed this before yeab? New sources of revenue don’t change tradeoff: when you argue for lower farebox recovery you are arguing for less service for the fiscal cost. Put another way, if there’s a budget constraint then lower fares means less service.
P.s. assuming demand is inelastic.
(topicalwhisper) “His dad works for Bayleys”
We’re not discussing the pros or cons of a farebox recovery system. We’re discussing whether AT has its sights set high enough for PT. And I’m arguing that they need to put money into PT and in the process change the farebox recovery.
Put it another way, Stu, where in the farebox recovery ratio is the benefit to society and environment of people taking public transport enumerated?
Stu, dropping PT prices presupposes that this will decrease farebox recovery. Vienna has moved to its very low prices with little effect on farebox recovery because ridership has grown so strongly. There has been a significant demand for capital expenditure which has been met by central government.
But if you shift allocation of transport corridors to PT surely you can put the same $10 into $4 general traffic corridors & $6 PT/active modes for example whereas previously it may have been $9 general & $1 PT/active?
Heidi, perhaps you could write a thread on centre city levies. It could well provide the inspiration for change in the same way that the RTN has been picked up.
The rail continue to disappoint.
Wait until 2018 to have a 15 min off peak is just lack of ambition.
In contrast, Light rail has 4 min peak and 8 min off peak.
My conspiracy is AT just try to make Heavy Rail as useless as possible to make Light rail appear popular.
Oh please, what is it about rail fans and conspiracy theories?
One important difference between LR and HR is there will never be any other user on the LR network, unlike HR which is in fact a freight network first. And is controlled by the freight operator. That is the big constraint here. It is in fact a bigger constraint than the lack of total grade separation that LR has, and which obsesses HR purists.
Both networks are compromised from total purity, but LR alone has total control of its lines for passenger services, though will always have some intersections and even some mixed running with pedestrians. Something HR doods struggle to comprehend.
Anyway, that is what explains the great LR frequencies from the start. And is obvious from that fact that the one freight free HR section, the CRL, will also have great frequencies from the get go, a few minutes at most.
Also LR trains are smaller so need higher frequency to move as many people.
They are also significantly cheaper to operate – they may even run at an operational profit?
Errr, wrong, LR trains will have similar capacity to the AM emus and not very different operational costs.
That’s not correct. The proposed LRVs are 33m long and 2.65m wide, an EMU is 72m long and 2.75m wide. While the LRVs will probably make more efficient use of space, there is no way they will have the same capacity as a 6-car train or the proposed 9-car trains.
“what is it about rail fans and conspiracy theories?” Well, rail tracks need a level ground to work on – also known as a Flat Earth… cos if the world was really round, all the trains would roll down to the edges and fall off the pancake…
Heidi, here’s an example from Europe to show that the AT model is broken, probably incapable of fixing, stuffed.
AT’s target over the next 3 years is about an extra 4 million trips per year. Vienna, off a base 10 times higher have just achieved a 7.5 million increase in ridership in the last year. The difference is talking about doing it (AT) and doing it (Wiener Linein).
With respect Patrick, the answer doesn’t lie in tinkering at the edges with changes to off peak fares, but in inducing the peak number of people to want to travel by public transport.
The application of feebate revenue will easily allow the staged introduction of the Vienna Solution.
Another interesting figure, or not – last year there were 778,000 annual public transport passes sold in Vienna. I doubt whether Auckland has that number of people who have ever rode public transport.
Vienna vehicle ownership is 371.5 per 1000 people cf NZ is 767 per 1000 people (2016 figures). If we could even half way approach that then we would not have a congestion problem in Auckland and the city would be well on its way to meeting near term emissions targets.
I’m going to link this here and in another post or two. Look at the modeshift in Toronto’s King St when they closed it to through traffic (not to all traffic, you could still access each property):
https://usa.streetsblog.org/2018/11/13/toronto-cleared-cars-off-a-major-transit-corridor-and-it-worked/
“The project, which cost just $1.5 million, has produced an 11-percent increase in average daily ridership, and as much as 34 percent at peak hours. Once the street was closed to cars, about 20,000 additional streetcar riders materialized practically overnight, the city reports. Biking, meanwhile, is up by as much as an astounding 440 percent, according to city estimates”
This sort of opportunity exists all over Auckland.
1.5million! and we are going to spend $11 million just on business cases for cycleways. All talk no action.
Where there’s a will, there’s a way. Where there’s not, there’s car dependency, high DSI, and plenty of money to be made in road construction and the auto industry.
Well there is wishful thinking if I have ever seen it ‘light rail frequency’ table. May as well include a frequency for Auckland Tomorrowland (AT) transit flying trains or the 2060 CRL2 north shore rail services.
The point being let’s get a rail in the ground first before dreaming up service timings.
Well you have to know what you plan on running before designing the infrastructure so that you can design the infra to cope
That may well be the case. I suspect tables such as this are there for an ulterior motive. They give the impression that something positive is happening with NW light rail and that will be used to deflect the persistent calls to do something NOW or soon to get rail to Huapai using the existing HR line.
This could be sorted out in a year or so but instead we get the 10+ year future LR promise excuse. I note that this LR is listed as going to Brigham Creek so could that mean Kumeu/huapai is many years after this?
It is a legal requirement to list any public transport service in the RPTP before it can be put out to tender for a service provider to deliver, so it must be included in this document before the rails go in the ground.
They also use this document as a guide on the firm plans for the future of the network, to help planning and integration. That’s why you see both the LRT lines and the various bus routes they hope to extend and upgrade.
The only ‘ulterior’ motive is that they have to put the things they want to run into this document before they can run them.
Thanks for that enlightenment.
Brigham Creek means running much closer to Hobsonville that previously indicated; this is a good thing both the North West and a future connection with Constellation Station.
Getting to Westgate and then going to Kumeu is ignoring everything west of the motorway, much better to go along SH18 and then dogleg into Whenuapai (where a massive new town centre is being built).
So maybe this LR routing missing Kumeu/huapai may give more rationality to an HR Huapai-Henderson dmu shuttle
It will be well after 10 years before it reaches Kumeu, there simply isn’t the population out there at the moment to justify it any earlier.
I’m surprised that they are going straight to what will be the maximum possible frequency right from the beginning at peak times. While they will be able to put on longer vehicles in the future, it does suggest we might start running up against capacity constraints in the CBD relatively quickly.
I note under Cycling they mention “Secure bike facilities at RTN stations”. Hope we’ll start seeing them in substantial numbers in the renders and plans. But what about a place to chain your bike up being a standard fixture at ordinary bus stops? Every bus stop to have a seat and a bike stand.
A few takeaways, having looked at Appendix 3:
* Significant development to extend the NX2 route to a new Whangaparaoa Station post-Penlink, with Frequent status all the way;
* No double deckers on the 22 and 24 until 2021. Thought the 24 in particular was a no-brainer for an upgauge;
* Double deckers mooted for the 82 (City-Takapuna-Milford);
* The 105 now will NOT become a Frequent route – this was foreshadowed to become frequent in time when the NN was first mooted IIRC;
* Interesting new service (364) proposed to Conifer Grove, currently unserved;
* The 762 and 814 become Frequent by 2028 – or even by 2024 in the case of the 814 (as the 76 and 81 respectively?);
* Evening (but not weekend) services proposed for the 966 – seems to be part of a general beefing up of services through Ponsonby, with the 20, Inner and Outer Links, 866/NX3 and 966 all getting a boost;
* Service in 2021 to Riverhead again, after so many years without service;
* Fulltime service to Warkworth by 2028 – evenings and weekends included;
* Great to see increases in frequency and span of the current 866 to become Frequent by 2028 as the NX3;
* Rail services – underwhelming frequencies, even in 2028. No reference to proposed Henderson-Newmarket-Otahuhu services;
* Ferry services – good increase in the span of service and frequency for some of the longer routes, especially Hobsonville