Tuesday’s Auckland Transport Board Meeting included a statutorily required review of how they performed for the 2017/18 financial year against their Statement of Intent (SOI). The results are outlined in their annual report, which provides a useful opportunity to take a step back from the day to day news and consider what was, for Auckland Transport, quite a year of change.
The report runs through a number of highlights from the last year, including:
- Appointment of Shane Ellison as the new Chief Executive
- Opening the Waterview shared path
- 15 new electric trains ordered
- New network implemented in the east, then the isthmus (the North came more recently)
- Adopting ATAP and then the Regional Land Transport Plan, providing a big funding boost to transport going forward
- Opening the Manukau bus interchange and the Pukekohe railway station upgrade
As might be clear from the relatively short list above, 2017/18 was a reasonably quiet year for project completions. Uncertainty about funding, which wasn’t really fixed until the Regional Fuel Tax came into effect on 1 July this year, meant that many long-planned projects weren’t able to proceed – the AMETI Eastern Busway is probably the best example of this. Furthermore, the biggest transport projects in Auckland – City Rail Link and Light-Rail – are no longer being progressed by Auckland Transport.
Chairman Lester Levy’s foreword continues his tradition of talking a good talk:
Transport infrastructure must serve the city, not consume it; it must support communities, not sever them. We have learned at great cost to human life and health that making cities great for single-occupant cars has undermined them for people and the environment. Travelling by private vehicle, whether electric, autonomous or otherwise, will not solve the biggest issues we face: space, speed and emissions. Auckland Transport is responding to these challenges and opportunities in a range of inter-connected ways.
This year’s refresh of the Auckland Transport Alignment Project (ATAP) and adoption of a new 10-year Regional Land Transport Plan in June sees for the first time the priorities of Auckland and the Government absolutely aligned and more importantly funded. Consequently, the RLTP outlines an exciting and ambitious programme of work that serves as our contract with ratepayers and taxpayers to contribute to developing an economically, socially, culturally and environmentally successful Auckland.
The plan, while still not far-reaching enough, is an important milestone. It starts to address the underlying causes of the longstanding infrastructure deficit rather than its symptoms – the implausibly slow decision-making that has blighted Auckland, our rapid and continuing population growth, and an equally long-standing car dependency. Fifty percent of the overall budget is for operating expenses, which recognises the importance of maintaining and optimising our existing assets so they are longer-lasting, safe and functioning optimally.
The RLTP emphasises safety as a top priority. The most common cause of deaths worldwide among young people aged 15-29 is road traffic accidents. The consequences are devastating and I cannot over-emphasise how important the safety element of our work programme will be. In 2017, the Board commissioned an independent, expert review into Auckland’s sharp decline in road safety performance. This hard-hitting report produced 45 recommendations, all of which we have adopted without question. To deliver on the Vision Zero principle that no road deaths are acceptable, we will need the support of many agencies and importantly that of each and every Aucklander to behave responsibly.
Reallocation of street space for a wider variety of users embeds the reconceptualised approach to safety and is critical to tackling congestion. Our streets will increasingly change through the addition of light rail, bus and bike lanes, wider and better footpaths and bus stops as well as the addition of proven safety enhancements like raised pedestrian crossings and calmed intersections. These changes will encourage drivers to slow down through town centres and near schools.
Public and active transport will increasingly challenge car dependency by enabling safer, faster alternative journeys with increased confidence in arrival time. Unless a sizeable percentage of drivers makes modal switches, congestion will adversely impact economic growth, jobs, housing and quality of life. The Board of Auckland Transport stands strongly behind its policy of reallocating street space, an approach consistent with the Auckland Council’s and the Government’s aims for our city and furthermore well supported by evidence.
There’s a lot to commend in these words. They highlight the critical importance that needs to be placed on addressing our road safety crisis, and they also emphasise the need to reallocate scarce street space to more efficient modes.
However, there’s a lot to do as Auckland Transport’s performance on a pretty wide range of metrics during the 2017/18 year was pretty poor. Even public transport ridership, which has grown strongly for a number of years now, plateaued (it’s ticked up again more recently):
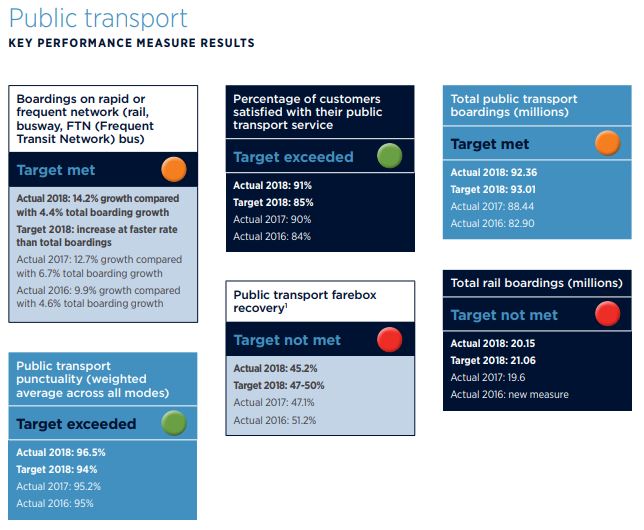
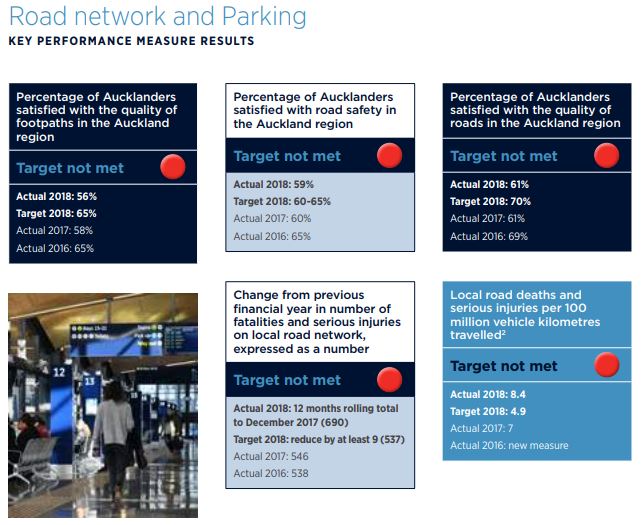
The stand out area of shocking performance was, of course, road safety. Deaths and serious injuries for the 2017/18 year ended up exceeding 800 – compared to a target of reducing them from the year before.
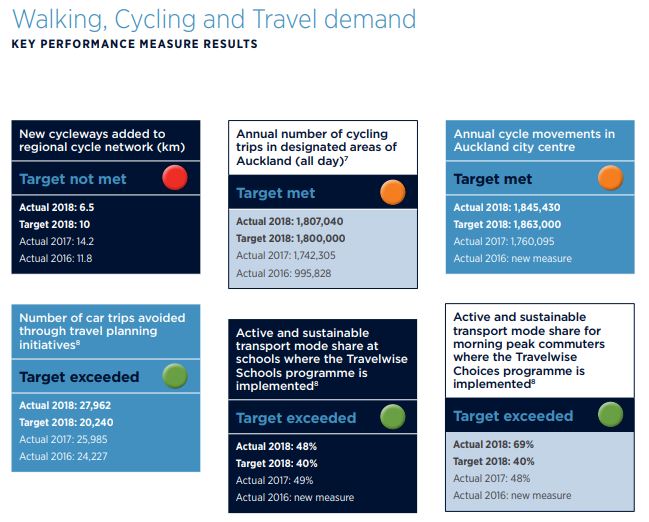
And Auckland Transport’s poor performance in delivering cycleways meant they failed miserably to meet their relevant target. Despite this, cycling use continued to grow and both targets relating to cycling trips were met.
Looking ahead, Auckland Transport has no excuse now to not ‘raise its game’. For the first time in its existence, funding really isn’t a barrier to making rapid progress – and with the Regional Fuel Tax now up and running there will justifiably be huge demands and expectations for progress to be shown.
The words in Lester Levy’s foreword suggest that we should see really exciting progress. The funding is in place and the Council and Government are both strongly aligned. Let’s just hope that counter-intuitive restructuring and (presumably) leaks from disaffected staff don’t hold things back.

 Processing...
The most exciting bit of what you quoted above is, “The plan, while still not far-reaching enough…” Attaboy, Levy!
Greater Auckland needs to push, constantly, that the ATAP and RLTP do not go far enough. Even if AT found cohesion and commitment, and stopped hindering all the progressive projects and approaches, the plan still uses multiple billions of dollars for building traffic-inducing roads. That traffic makes every progressive project less successful. And it’s money that should have been spent on safety and modeshift.
Greater Auckland has been successful at promoting public transport. Now it needs success in stopping the road building insanity.
Truly appalling progress on cycleways. Northern Auckland, Eastern Auckland, and Southern Auckland have had zero cycleways completed this year, and only one has been completed in Western Auckland.
They need to give a better reason for this, and an explanation about what they’re doing to overcome every hurdle to avoid it happening again. Who can we turn to, to make this demand? Trouble is, right at the moment, I imagine we’d get enormous spin designed to undermine cycling further.
‘An explanation about what they’re doing to overcome every hurdle’
From AT? You make a wonderful jape. I think AT should name change to Auckland Roads then a new entity named Auckland Mobility be created to deal with everything transport related except roading. Adjust budgets accordingly moving toward a 90% for AM vs 10% for AR.
Yes, and in allocating that 10% of the budget between the various road maintenance needs (because of course we’ll be crippled with road maintenance well into the future with all the roads we already have, and the 40 km of roads we’re building each year) business cases will be required to show how retaining that particular road in good condition serves the network, whether all the reallocation to serve the other modes has been done, and whether the roads connecting to it are likely to be maintained, because if not, maybe this one shouldn’t be…
Yes, I jest. So funny to reimagine the power balance.
So if we’re building 40 km of new road a year then surely the bare minimum length of roads safe for cycling in a given year is 40 km? In practice it needs to be probaly 80+ km given the starting point, not all of it would be cycle lanes or paths but it highlights how seriously underwhelming even our targets are.
Yes, and the lost opportunity with those 40 km of greenfields roads is that those areas could have actually provided a lifestyle alternative. They could have been based entirely around PT and active modes, with no infrastructure for the car. Sure, plenty of people wouldn’t want it, but those people have the rest of the city to choose from.
“and the 40 km of roads we’re building each year”
Is it that much? I submitted an OIA request this year asking AT to tell me the kilometres of roads they had laid compared to the kms of bus lanes. In the reply they forgot to mention the number of kms of roads. If I had been writing their reply I also would have been too embarrassed to include the two sets of figures in the same document.
Here are the bus lane figures: 29 kms in 3 years. The target of 40kms was only missed by 11 km. I find it heartening that they gave it their best shot, and that they will do the remaining 11km this year.
I
If you need a quote for the number of roads, the RLTP says:
“AT’s asset base is continuing to increase as Auckland grows and new assets are added to the network. Analysis of recent trends indicates that 40 km of new roads are likely to be added to the local road network each year, and traffic will grow by 2.4 per cent each year.”
NZTA’s road building is in addition to this. Area of paved surface given to the new roads vs area given to new buslanes would show an even more stark contrast.
Perhaps they can’t find anyone willing to make up some cycle forecasts.
LOL
Joking aside, I think a 4-5% increase in cycling numbers in 12 months is a good outcome. Even from such a small starting point given the incomplete network. Also assuming they are fairly comparing before/after and not just adding new counting sites and saying it is growth.
The only info they need is that it pays $10 back for every $1 invested.
The safety targets will presumably remain unmet for a long time. I’ve written a post about some of the recommendations in the Safety Report that will not have been met, regardless of how much Levy says they have been committed to ‘in full and without question’. Hopefully out soon.
Meanwhile this year’s safety projects include devices specified by the AT Code of Practice which should have been replaced over a year ago by the Transport Design Manual, but that STILL hasn’t been released. Some best practice specified in the TDM would have made a difference in these safety projects (eg the Te Atatu St project wouldn’t be relying almost solely on speed humps to try to slow traffic).
And then there’s the whole subject of speed… and AT’s reluctance to understand that whole-of-city changes can be made, and then consulted on after a year or two, by which stage the population will know what they’re submitting on. Only by making it whole-of-city can the entry/exit signage costs be avoided, and can the cultural shift that is required happen.
Nothing happening at the moment suggests there’s any urgency in AT about cutting speed, and reducing the road trauma it brings.
I was amazed that AT decreed that the maximum speed for electric scooters should be 10kph. Not amazed by the decision because it is sensible; but rather amazed that AT for three years have done absolutely nothing to reduce vehicle speeds on shared streets. I would have thought that a one tonne car travelling at 50kph was a greater hazard that a 100kg scooter travelling at 27kph. Best of luck with the 30kph vehicle speed campaign Heidi.
Rail is under-performing.
Nothing has been done about the increase in frequency, decrease in dwell time and improvement to line speed.
Now AT feels the pain. Restructure the staff who is responsible for this inaction and replace with those who can.
They already did that, rail underperforms so AT restructures the cycling and walking dept out of existence.
If that is the case, Lester Levy is either out of touch with the reality, or incompetence.
What’s interesting is that delivery of cycle lanes is arguably one area that is largely within ATs control.
So to fail on that measure is extremely disappointing, and something I’d hope to see addressed almost immediately.
Levy talks here about creating ‘wider and better footpaths’. Where is he going to find the extra space for this?
I think there have been a lot more pedestrians around, not just in the shopping areas but walking instead of using cars. I wonder why are there no stats for this?
When all the proposed bike lanes are built I hope the cyclists will use them and leave the footpaths for the pedestrians.
People ride bikes on the footpath because there’s no safe alternative for them, it’s no different from cycleways such as Nelson St being full of pedestrians because there’s no footpath. A comprehensive network will allow mode separation which is of course what everyone would like except for in slow speed zones likes the shared spaces etc.
“more pedestrians around… why are there no stats for this?”
Good question, Anne. When people walking aren’t even counted, they don’t get attention, and they don’t get funding. Engineers are able to tailor their research for vehicle occupant safety because they have traffic counts and can work out crash/vehicle statistics. When you don’t have crash/person walking statistics, nor information about how an intervention increased or decreased the numbers of people walking, you can’t focus your research and you can’t build up a knowledge base about what walking infrastructure is safest or most likely to influence modeshift.
And if I remember correctly, there isn’t a mechanism in the Investment Assessment Framework to assess investment in counting pedestrians, in order to secure funding and prioritise where counting projects should be undertaken.
In contrast, vehicle counts are being taken regularly and comprehensively throughout the city and country.
I didn’t know we didn’t count pedestrians. I’d suggest it’s an oversight but the failure to count groups and the harms that come from that is such a well known issue that someone somewhere has to be actively okay with this… which is big problem.
Frankly, people are sufficiently keen for work experience you could probably get a volunteer based pedestrian counting exercise up pretty easily.
Yes, an ex-politician enthusiastically told me of some volunteer counting projects she’d organised to demonstrate a point. But it shouldn’t come down to volunteer work. And it’s not that it’s never done; it’s just not standard practice.
Some safety engineers have been calling for a systematic national programme and database of pedestrian data to help inform engineering design for a while. Failing to provide this cannot be an oversight, given the IPENZ papers and presentations, etc. An indication of the attitude towards the practice is indicated by the NZTA being unable to provide any pedestrian data for the areas surrounding the Waterview Connection because they had “lost” it. Had the information been used in any design or calculations, the numbers would still be visible by looking at those workings. Instead the NZTA couldn’t even point me to any reference to use of the data in any report.
The cost of counting pedestrians, compared to counting cars, is undoubtedly a reason. Again, the safety engineers have come up with methods to reduce the cost. Cameras can help. Quality data can be obtained using methods such as recording where the most discerning users choose to cross a road. People with mobility frames, wheelchairs, walking sticks, etc, do in general choose the safest crossing devices and arrangements. If this was recorded throughout the country, we’d be building up a good database of which devices are preferred.
And actually, variety in devices – rather than national consistency – would allow a natural testing process by users which, if recorded through counts like these, would quickly enable evolution to safer vulnerable user road design.
The other thing that’s interesting about the failed (and too low to start with) target on the delivery of the cyclelanes, is that we now realise that the targets for cyclelane user numbers relies on the network of cyclelanes as planned actually having been built. They weren’t, so you couldn’t expect the user counts to meet targets.
And yet user counts exceeded targets. The latent demand is huge.
“We completed the Roads and Streets Framework and the Transport Design Manual in November 2017. The two documents are complementary. The framework… [a description] … is being used across AT in a range of projects… One of the integral parts of council amalgamation was to create for the first time a consistent, customer-centric wayfinding system for all of Auckland, and for all modes of transport. ”
I am blown away by how progressive you are, AT. What fantastic ideas! A few questions, though:
Where’s the Transport Design Manual? I think you might’ve overstepped the mark with ‘completed November 2017′ given that it was still having work done on it this year. It’s most certainly a fudge comment, when you haven’t released it yet. And your safety projects, as just one example, are sorely showing the signs of still having to use the AT-COP instead.
Since the Roads and Streets Framework is so useful (and it truly is a piece of world-class work) – why have you put it under review for its ’emerging financial implications’? Is it that the title of this report “People First” is a farce?
And where is this wayfinding system for all modes of transport? It’s certainly not the journey planner – that only includes journeys by motorised modes, and it recommends pedestrian paths to buses such as walking through the Greenlane roundabout and through the service station on the corner of Sandringham Rd and Balmoral Road. It’s certainly not signage out and about. I’d be interested in knowing what you mean, and what budget got allocated to it.
The thing that I have noticed is there is nothing about the on going sale of the old SA/SD fleet of carriages , are they still on the books ? . I have seen in different press releases that a large number of them [31 -30SA’s &1SD] have been sold and now at the Hillside workshops to be upgraded and KR are converting 3 SA’s for the great sights trains , and 9 [3SD’s & 6SA’s] could possibly be used for the Hamilton – Auckland service . So who now owns them AT or KR ?
So if AT still owns them and with them being sold has the money gone through the books or is it part of their lose .