As I sat down to write this “Development Update” post, the 30th one I’ve done, I realised I didn’t really know what I wanted to write about. So I thought I’d throw it over to you guys, our Greater Auckland readers.
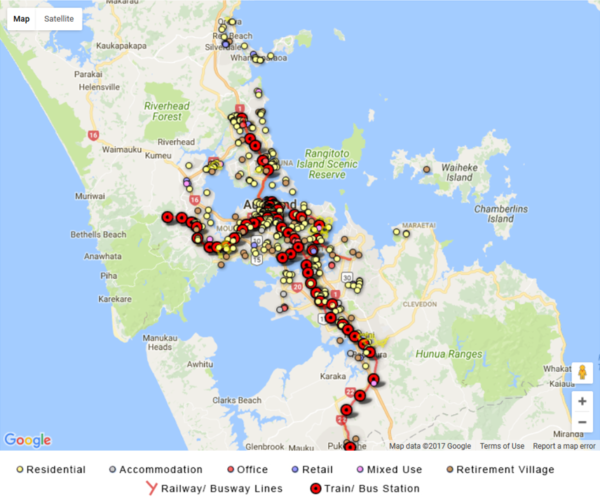
These posts are about development, in the sense of property development and what is happening and where. They link back to the RCG Development Tracker page, which is a sponsored page (the only one) on the Greater Auckland site. That page has an interactive map showing all sorts of things being built or planned, and extra info on apartments and terraces in Auckland.
In the last three years, I’ve written a lot about housing in Auckland, because the housing shortage is a big problem and part of the solution is getting more homes built. I’ve focused on apartments and terraces. These are a great fit for our aims at Greater Auckland: they tend to be close to jobs, study, shopping and good public transport. Long term, they’ll be cheaper to provide than houses on the fringe (and help reduce fuel bills, congestion, and greenhouse gas emissions).
I try and mix it up a bit, and talk about Canterbury (where there’s been heaps of rebuilding since the 2010-11 earthquakes) and things besides housing. Offices, shops, industrial buildings, hotels and schools all get a mention from time to time. Pretty much every type of building there is.
And most importantly, I’m writing for a general audience. People who are interested in “improving the quality of our cities”, especially Auckland, but aren’t really involved with construction or property or any of that other stuff. Sort of YIMBYish.
So let me know… what would you be interested in reading? Want it a little bit less or more technical? Shorter? Less on housing? More references to classic 80s heavy metal songs? More linking back to transport issues? Talking a bit about the actual RCG Development Tracker map and updates, without sounding too marketing-y?
In the meantime, I reckon it’s time for a quick housing update, since I haven’t looked at this for a few months.
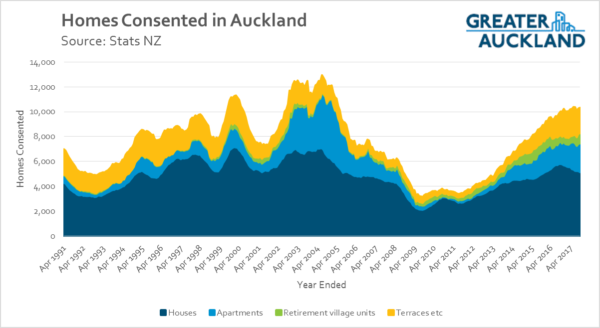
Building Consents = New Housing Supply (more or less)
There’s no official measure of how many new homes are built or completed in New Zealand. Stats NZ building consents data give the most reliable info – but that’s showing how many homes are ‘approved’ to be built, not how many are actually finished and ready for people to move in.
Stats NZ are trying to give better info on home completions, and we’ll likely hear more on that in 2018. For now, their early work shows that 97% of building consents do result in finished homes, taking about 10 months on average. Auckland has more of a time lag, so 2018 will probably be the first year we hit 10,000 completed homes, even though we’ve been consenting 10,000 homes a year for the last two years.
Anyway, here’s that consent data for Auckland – divided into different types of home:
And the graph below shows housing consents across different regions:

Greater Christchurch did a pretty good job of rebuilding homes after the quakes. 30,000 homes were consented in the last six years, enough to make up for 8,000 homes lost in the “red zone”, maybe another 5,000-10,000 damaged or destroyed, and leave at least 10,000 to cater for population growth. Consent numbers keep dropping, and Christchurch may well be ‘oversupplied’ with housing… a good problem to have.
Consents in Auckland, Hamilton, Tauranga have all plateaued. With builders in demand across NZ, I can’t see the consent/ build rate lifting much further in the short term. That’s a pity, because those homes are needed – especially in Auckland!

 Processing...
The Homes Consented in Auckland graph shows the impact of the Local Government Amendment Act 2004 rather well. All that bollocks about integrating land use and transport gave us a major decline in houses consented. It proves that policy has an impact but not always the result people claim.
cause or correlation?, discuss…
Thank you I shall. The LGAAA(2004) gave regional planners the control they had always sought over local planning. It was the biggest change for a generation in how land was released for development. The ARC had control over the Metropolitan Urban Limits with no effective appeal rights to owners. They held hearings where each owner was given 15mins and that was the sum total of your input. With no appeal and no ability to get them to consider a private change to the MUL the ARC basically got a right of veto. The LGAAA required each Council to introduce a plan change that firstly restricted land supply and secondly banged on about integration of land use and planning. It enabled Council to pass a lot of their costs of development onto the owners who responded by simply not developing as their costs blew out. That was despite demand for housing increasing. https://www.barfoot.co.nz/market-reports/2016/april/auckland-house-prices
The result was less land could be developed and those sites which could be, became impossible given Council transport demands.
The part none of us really understood at the time was when regional planners said transport and landuse should be integrated, what they really meant was people would live in cars.
You’re welcome.
I presume that the limits were there to encourage brownfields development over greenfields. What prevented brownfields development happening at the rate required? Was it developer preference based on previous experience? Just enough tantalising greenfields availability to deter consideration of brownfields? Zone rules? Processes too difficult or uncertain?
If you look at the 2nd to last graph you will see a big decline in apartments at the same time. I think part of the answer is the transfer of costs onto developers that occurred reduced the number being built, but also I think apartments got bigger so fewer were built in each building. That was in part a substitution from houses to apartments. I haven’t got data to back that up, I just remember doing more house sized apartment jobs. The mistake the ARC made (followed by Auckland Council) is they thought brownfields was a perfect substitute for greenfields houses, when in fact there was a wealth effect that was significant, it cost more money to provide similar utility.
The last graph shows it was an Auckland effect only at that time. The GFC issue started to hit in 2008 and that hit NZ wide. Overall we are only now getting back towards the numbers that were built pre LGAAA.
I can fully believe the larger apartments had an effect like this.
1, it seemed as though former planning rules basically only allowed new houses where you had an 800m section that you could split and housing prices more than doubled in a decade. It was almost impossible to build apartments, or terraces, or develop new land.
Have the processing teams at council failed to adapt to the new rules? I get the impression that they don’t permit any non-compliance at all at the moment. I don’t know how anything can get built like that.
The Auckland Isthmus Plan had quite generous rules for medium density development in places like Dominion Rd that were not often taken up. Allowing development and seeing it eventuate are different things. The low hanging fruit at that time was the CBD and fringe areas where owners realised nobody would want an office building so they built apartments. That defined the market for a long period. Prior to LGAAA we were moving from area to area on the periphery of Auckland doing greenfields houses. That stopped. The people who stopped it are responsible for the housing crisis. They caused the problem. They heard evidence at the Auckland Plan hearings that they were the cause but the carried on anyway.
So when apartment development was happening on the CBD fringe but not on Dominion Rd, was that because the returns were lower there because the height limits, etc, were too restrictive? Or was it because only so many developers are interested in brownfields development, and if you prefer greenfields, you’d just do that?
John I look forward to your updates and often refer to them. I would want a little more detail. Regional consents per capita for instance would make it easy to compare the relative ‘booming-ness’ of our different metropolitan housing markets. It would also allow for international comparisons.
I think Stats NZ needs to investigate if consent figures really does measure the net increase in housing stock. I think consent figures are only measuring the gross increase. I do not think that Stats NZ accounts for number of houses demolished as part of the build process, for instance?
This is not a criticism of intensification -I am a big fan it. Rather it is a criticism of the lack of accurate public data on housing supply.
Finally, John you may be interested in this paper I have written about housing and population booms.
https://medium.com/land-buildings-identity-and-values/why-is-it-hard-to-enter-some-cities-land-use-27433fc2b166
Brendon, your comment about the lack of accurate public data is something I fully agree with, and suggest is a tool that the new government could implement as a basic means of understanding the problem the country faces. I cannot believe that it would be complicated to establish a national system of recording information from building code completion – it’s probably all being entered into local council databases already, in one form or another.
The additional expense would be minuscule when set against the ongoing cost to society of not defining the nature of our housing challenges properly, and the value of having reliable data to guide policy and investment nationally and locally would be immense. It’s up there with a national definition of what “affordable housing” actually means….
Cheers Brendon, and I enjoy your writing and insights too… keep up the good work!
And as mentioned above, Stats NZ (and some other people, including Auckland Council) are actively looking at getting better measures of homes consented -> underway -> complete. They released a paper on that this year, which I linked, and they’ll be working on it further in 2018. So there should hopefully be much better data from next year.
And I think they’re also wanting to reconcile the numbers of demolitions, etc. The deficiencies of the data on that became very clear after the CHCH quakes, and are also a snag for measuring intensification as you say…
Construction hoardings are up, and earthworks begun at 1 Taylors road, Morningside. Not on the tracker, anyone know what’s happening there?
http://www.nzherald.co.nz/property/news/article.cfm?c_id=8&objectid=11158337
That’s a “retail” development – I do cover those, but only the bigger ones.
Anyway, the site is owned by Briscoe Group (who run the Briscoes and Rebel Sport retail chains). They’re shuffling around their stores/ head office in the area – it’ll become a temporary Briscoes while they demolish their existing store nearby, then become a Rebel Sport when the current Briscoes is rebuilt.
See https://www.nzx.com/companies/BGP/announcements/301566
That land should become a mixed use complex at the very least.
And just because I’m so angry about bad planning leading to homelessness (see below) I’ll stick it to the Briscoe’s head who has bought two adjacent properties in Herne Bay and instead of developing them into multiple residences, is making one family home, and is unhappy with how many helicopter flights he’s allowed per week.
http://www.nzherald.co.nz/business/news/article.cfm?c_id=3&objectid=11957247
Briscoe’s is now on my boycott list.
Agreed, what a complete and utter waste. Willing to bet money that it won’t be street facing either :/
Had to laugh at his justification – ‘I don’t own a helicopter, I just charter one when I’m heading north to play golf and don’t want to drive to Onehunga to catch it’. Ahh, that sounds much more like the common man!
Thanks John! And I share the disappointment of the other commenters 🙁
Thanks John, I enjoy these posts. What I’d like to see more of is tracking how development conforms or doesn’t conform to the Unitary Plan objectives. And also, if ever possible, how much support for brownfields development is being provided in the form of public spaces and amenities. New small parks or plazas or sports facilities, etc, and how they’re funded.
The Unitary Plan has already lost 25% of its total zoned capacity and 50% of its up-zoned capacity, as modelled by the NPS-UDC (using commercially feasible snapshot/point in time modelling) from 2016 to 2017 -442,000 down to 308,000 in total and 270,000 down to 130,000 for brownfield development.
The figures are hidden in the below report.
http://infocouncil.aucklandcouncil.govt.nz/Open/2017/11/PLA_20171128_AGN_6728_AT_SUP_WEB.htm
5. The enabled feasible capacity for dwelling supply, as modelled for the 2016 draft Unitary Plan recommended by the Independent Hearings Panel, was for approximately 422,000 – being 270,000 (modelled) in brownfield existing urban areas and 130,000 (assumed feasible) in future urban areas, with the remainder being potential Housing NZ developments and future dwelling growth in rural-zoned areas. The new modelling shows, principally due to rising construction costs and flat to declining sales prices, that the brownfield enabled feasible capacity of 270,000 has since reduced to 140,000; and that the future urban feasible enabled capacity has changed slightly as it is now modelled, from 130,000 to 146,000 dwellings.
Gosh. Still taking that in. So under rising construction costs and flat to declining sales prices, the possible greenfields number goes up a little, and the possible brownfields is nearly halved! That’s a big difference in just one year. Presumably this modelling reflects the economic realities for developers.
The benefits to the city of brownfields over greenfields development (in terms of liveability, a functioning transport system, and retention of agriculture and ecologically diverse surroundings) are huge. If this report is correct, Council’s and Government’s reluctance to ramp up its own building programmes or even to provide incentives for brownfields development is allowing the city’s planning to be determined (ruined) by small changes in the economy.
It feels like we’re on a small craft with no rudder, no sail and no skipper.
Yes I am surprised that this information has not got more publicity. I think there needs to a superabundance of upzoning been made available in Auckland’s isthmus, in particular. And yes I would look at the incentives for intensification. Central government gets 15% of those rising construction costs back in GST, whereas for local government intensification means more costs -for example -old or constrained infrastructure has to be upgraded -such as Victorian era combined sewer and stormwater systems which are passed its used by date.
I’m concerned about this and other ‘big housing numbers’ – including what looks like a big backdown on the 400,000 homes target in the new draft Auckland Plan – and will be writing on that early next year.
Heidi I have turned this information into an article. Will you and other readers share this on social media?
https://medium.com/land-buildings-identity-and-values/aucklands-unitary-plan-update-b04457da495e
Yes, I will. I note one error: “brownfield developmental supply which fell from 270,000 down to 130,000.” Should read 140,000.
What stuns me is that a sensitivity analysis would have shown up the variability in the predicted numbers, quickly displaying their uselessness for planning. It’s not like we’ve seen anything in our economy in the last year that is unexpected. This is poor, poor modelling.
As other commenters have said in other posts, the market may have been able to provide the required homes if given a better regulatory environment 15 years ago. Today, the market is simply unable to do so. We need a massive government building programme, and as it is in existing urban areas that this needs to happen, we need compulsory acquisition of underdeveloped commercial sites to achieve this. I’m volunteering the luxury car yards and all the at grade carparks first. But there also needs to be a ban on the Ships – the MacMansions replacing modest homes, where a complex of several apartments should be being built. Perhaps Council should offer a partnership to people wanting to develop their site to provide more homes, but don’t have the money to develop.
Having read about homeless wahine maori and survival sex, and about the lifelong preventable diseases being doled out to malnourished homeless children. this failure of Council to provide a better plan makes me very, very angry.
You make some valid points Heidi. We need to do better -I am pretty pragmatic and will accept any and all plans which will build more houses.
The current mix of topics is OK. I skip through what doesn’t particularly interest me and delve into what does. Any reader can do likewise, as interests them. Keep up the good work.
+1
There are huge new greenfield developments missing from that map. The massive Weiti development off East Coast Road between Long Bay and Stillwater, and the Nopilo and Matua vineyard developments at Kumeu/Huapai
Hi Evan, yes you’re right. I’ve deliberately left greenfields housing out of the free map, except for a few like Hobsonville Point and other higher-density ones. I might add these next year…
I do property investing so your posts are useful for me to identify growth spots and trends.
Those information are useful to locate urban regeneration opportunities.
Love the posts John.
I’d like to see a focus on a particular area from time to time. ie an article that focuses on Ponsonby Road and Great North Road, or on Albany, or on Manukau CBD as I don’t get to explore these areas much.
Thanks – and good idea, I’d like to do a few more of those. I’ve done ones on places like Stonefields and Browns Bay, but plenty more places need a review…
Hey John. Love your work. I was wondering if you knew anything about this development? https://imgur.com/a/laZ1d
I can’t seem to see anything about it