Auckland Transport have now (finally) published the ridership numbers for July, the start of a new financial year. Of course we already know that in August, rail usage hit 20 million trips but it’s good to be able to see the other results as well as some of the ancillary information around ridership.
July is always interesting as school holidays take a bite out of usage compared to the surrounding months. However, comparing usage to July last year is easier as there were the same number of working days.
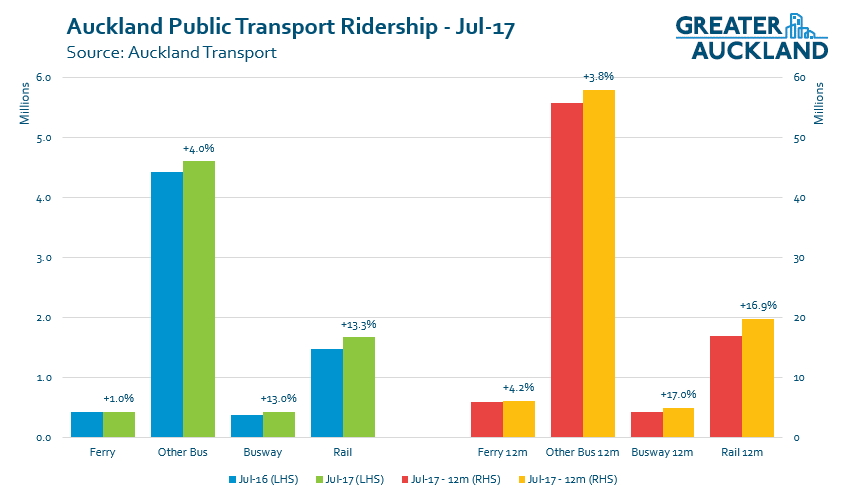
Here are the high-level results for the month and compared to July 2016.
- Total trips – 7.1m, up 6.4%
- Rapid Transit – 2.1m, up 13.2%
- Rail – 1.7m, up 13.3%
- Busway 429k, up 13.0%
- Other buses – 4.6m, up 4.0%
- Ferry – 430k, up 1.0%
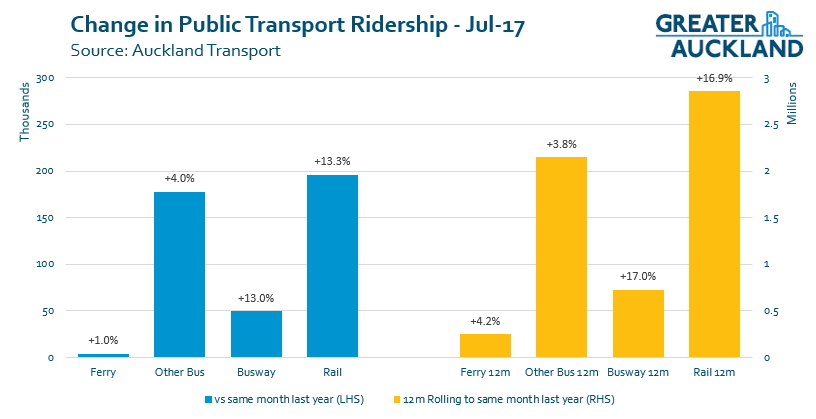
The graph below highlights these changes as well as the numbers at an annual level.
One of the things that you can see is that despite being a much lower percentage, the Other Bus category still grew what appears to be a fairly similar amount to rail. The graph below highlights just the change
As I pointed out from the June numbers, we were on track to to reach two milestones in August, both associated with the Rapid Transit Network. On the rail network we reachede 20 million trips annually, almost three years sooner than the Ministry of Transport thought possible. We were even closer to a milestone on the Northern Busway which based on the results above, needed just an 8% increase on last August to reach 5 million annual trips. I’d be very surprised if we haven’t already reached that. We also continue to close in on 90 million total trips annually and could potentially reach that milestone this month.
Along with the ridership numbers themselves, there are some interesting trends in some of the ancillary figures.
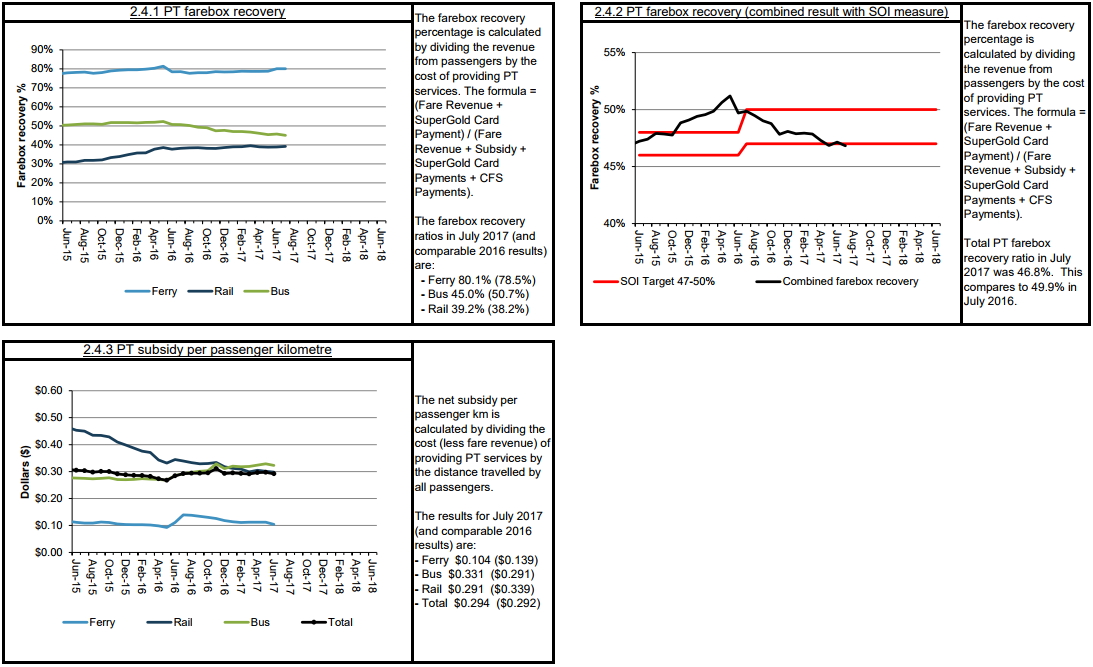
Farebox Recovery
Farebox recovery (the percentage of operating costs covered by fares) continues to trend down. This is mainly impacted by a drop in the performance of buses which could be a combination of a few things, such as:
- The roll-out of Simplified Fares last August.
- Contractual changes, primarily related to the roll out of the new network often running more service than existed previously.
- AT and the bus companies put a lot of extra resource into addressing March Madness to ensure it went smoothly, which it did. However, adding extra peak services to cope is often one of the most expensive uses of PT funding as it requires additional buses that are only needed for one or two runs a day.
I also find it interesting that rail has plateaued despite rapidly rising ridership.
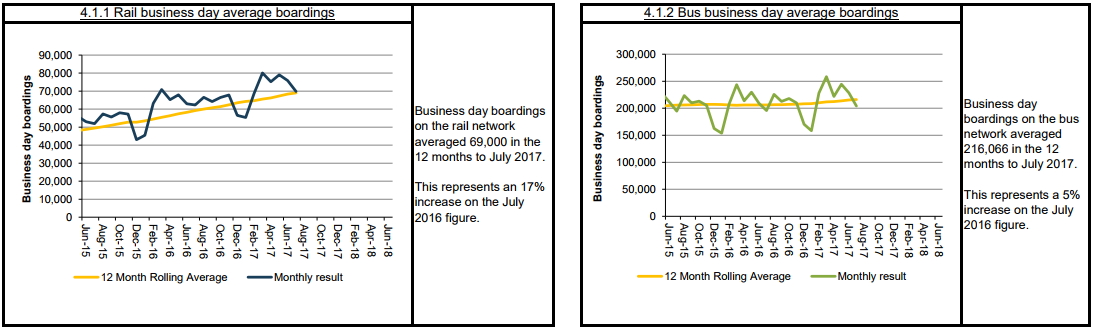
Weekday ridership
Weekday boardings are often a better metric to use when talking about PT given they’re not impacted by things such as weekends, public holidays or events. As you can see below, rail use on weekdays has continued to soar and is now at 69k per day with some months hitting an average weekday around 80k per day. It’s also pleasing to see the bus numbers starting to trend up a bit.
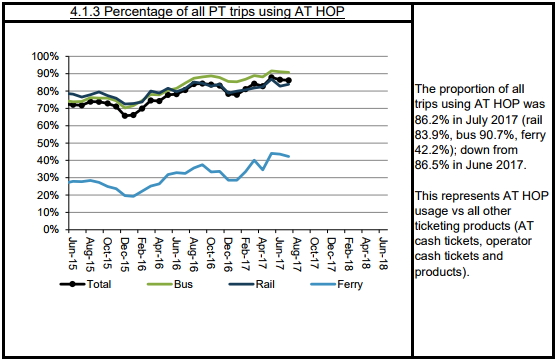
HOP Usage
Use of HOP has improved and is over 90% for buses. That’s pretty impressive when you consider that during the first quarter over in Queensland, they had 86.4% of trips use their Go Card, which has been around for a lot longer.
Hopefully we don’t have to wait as long for August’s stats as we did for July’s.

 Processing...
Looks like rail is going to be stuck at 2-2.5m new trips each year. AT really need to get ten minute all day frequencies running ASAP to continue the growth.
10 minute off peak services are not possible with KiwiRail’s freight access path rights
so why have KR not already restarted the construction of the 3rd main?
I think there are many inexpensive ways to improve patronage by making it easier for locals to get to and from the platform.
Build the paths joining the streets behind Meadowbank station, build an underpass at Newmarket, Construct simpler,quicker bridges over to the platforms eg at Penrose and Puhinui, add access to Sylvia Park from Carbine Rd, open the northern entrance at Otahuhu station, move the Parnell station, include 2 or 3 entrances at K’Rd etc
@JimR, you’ve nailed it.
These small inexpensive investments are needed to boost patronage and revenue to a point where farebox recovery is back within target.
After that, of course 15 minute all-day frequencies across all lines are needed (10 minutes is a bit of an ask @Alphatron). That’s one extra service an hour.
That’ll guarantee patronage growing at double digits every year until the CRL, and of course maybe even in the 20 percentage points after the CRL
With Farebox recovery i wonder how the deal with transfers under the Simplified Fares, the old system it was clear how much went to bus & train, i suspect a lot of train journey include a bus trip at one end, that might explain the leveling off
I didn’t know we could hop off without tagging off the train and board a bus, only tagging off on the bus? Have I misunderstood something?
If you catch a train from Bitmomart to Papatoetoe and then the bus to the airport, that is a three stage journey. Previously you would be charged a three stage for the train and a one stage for the bus. So the farebox contribution of each leg was clear. Now you are charged a three stage fare for the whole journey. Richard’s question is regarding how the fares are allocated to each mode with regards to farebox recovery under the new fare structure.
My understanding is that fares are allocated on a kilometre travelled basis. In our example above, if the fare is $4.85 with 23km on the train and 7km on the bus, then $3.70 is assigned to the train, and $1.15 to the bus.
AT lets get moving with continuous improvements in public transport frequencies, speed of services & operating hours for Buses, Trains, Ferries. People need choices & options to use their vehicles less & public transport more.
I heard that after the success of the new network, in turning one measured trip into two trips, they are considering running separate trains between each station. That way you get on at Britomart, cross the platform at Parnell, cross again at Newmarket etc. Ridership will continue its upward climb.
While i normally don’t like mfwic’s comments, he’s kinda right here. There should be a break in the ridership graph since the thing being measured isnt quite the same.
People transferred between services long before integrated fares existed and for that matter hop cards. Any break in the graph now would be artificial.
That’s why AT measure things like passenger kilometres and journeys as well.
These upward charts are surely a mandate (if still needed) for increased investment public transport.
The differences in the modes also reflect the impact of investment by AT; with huge investment in rail and massively subsidised fares, the uptick in ridership is impressive. With ferries, AT’s other strategy of neglect shows the damage that poor transport policy can do. By randomly locking ferry users out of ‘simplified’ fares, charging passengers more than double the normal fare and keeping service frequency low, it is still possible to achieve zero growth in ridership in a city where demand for it is high.
This was meddling from Steven Joyce and National, he gave Fuller’s exemption from being part of integrated ticketing. There’s nothing AT can do about it. Much like their meddling in the roll-out of HOP and forcing Snapper into the picture slowed that down, most PT projects are significantly delayed or negatively impacted by National’s ongoing dislike for transit and refusal to fund it.
Still stunned to see the consistency of the growth on the Rapid Transit lines. Incredibly gratifying to see theory play out in practice. I mean I always confidently expoused it would, but reality often makes a fool of the even the most certain theorist…. On it rolls.
Also isn’t it interesting what a convincing rail line that busway makes, at least in ridership growth. Such similar rates.
+1 on the busway!
I caught that busway today, having found myself in Albany this morning, and those buses fair races along that dedicated bus lane. Also, they doesn’t need to stop/start for traffic or swing into bus stops all the time, which makes the trip smooth and every bit as comfortable as a train. It’s brilliant!
For now I’d say it still feels a bit disconnected, at both ends. I first had to be dropped off by car to get to the station, and on arrival it seemed to lack a connected terminating station at the city end. These things can be fixed soon enough though, and overall I was very impressed.
Southbound busway buses get stuck in traffic at Greville Road and now NZTA have decided to add EV’s to the already congested T2 on ramp. FFS!!!
That’ll be because National thinks our Paris Commitments can be met by a policy around electric vehicles…
Extending services to midnight would enable nurses who work the 3 to 11 p.m. shift to catch public transport.
Yes improving span is overdue. However note firebox recovery issues in post above.
Well it’s time that that stupid farebox recovery ratio requirement was knocked on the head. Was simply a method for National to try and defund services.
+1. Get’s in the way of creating a really usable city network. Can always keep it in mind but don’t be transfixed by it.
Not just nurses. I used to work shifts in one IT role. Could start @ 06:00 or finish @ 23:00, or switch those around if doing a night shift. Public transport didn’t work for those shifts. Whilst I haven’t done shift work for a very long time, there are those that still do (outside of healthcare) and they’d benefit from more coverage too.
It also highlights how much serious effort is needed in the biggest part of the PT sector, general bus. There, poor attention to what they like to call “customer experience” leaves a lot to be desired, and some of the unsexy but important stuff like bus priority through suburban areas, and the untapped potential of the existing carriageway on the northwestern motorway. CBD to Waterview, for example.
Improved bus stops in the suburbs would make buses far easier for a huge fraction of the population.
Yes we don’t need overpriced expensive chic shelters for buses or trains. We need large robust ones that actually provide shelter from the elements and can hold more than 4 people.
I’d be interested to know what impact the New Network in the west has had. Very casual observation suggests to me (in respect of buses entering and leaving the K Road area, offpeak):
18 (New Lynn via Gt Nth Rd): loads seem extremely light (4-5 pax average in offpeak), especially given this will be a double deck route . . . soon (?)
110 (Westgate): loads seem not bad (10-15 per offpeak trip
132 (Te Atatu Pen): loads seem very light
133, 134 (Henderson via Te Atatu or Edmonton Roads): loads are higher than I anticipated – perhaps 10 pax avge offpeak
195 (Blockhouse Bay Road/Green Bay/New Lynn): Loads seem very good (10-15 pax offpeak), especially considering that offpeak frequency has doubled.
Of course, this is only part of the picture, and there’s no way of telling how many of these pax are genuinely West Auckland originating, and how many isthmus-originating. And of course they’re just my casual observations. The route I’d be most worried about is surely frequent route 18, which may have lost a lot of transit passengers to the rail at New Lynn – such as those who come from Glen Eden and previously had a through service to the central city. The frequncy has been increased at the same time to every 12 min offpeak, every 6 min peak, and I worry that this may be too much with DDs in operation.
Would be interested in others’ observations, and also any “official” comment on the outcome of the NN implementation in the west.
Have some gripes about last services though, weekdays:
18 – 00:00 last bus, why every 15 mins right up to midnight then last one smack on 00:00, what about people finishing work at 00:00, having a 00:15 would of been smarter
195 – 23:15 last bus, crazy that theres no improvement here, AT told me this was to run later under central NN but now they are saying they are not changing it because they changed it under west NN (but without improvement…)
110 – 00:05 last bus, odd that they pick to run this one so late, especially when closer by Te Atatu services finish around 35 min or more earlier. – would also note theres nothing to connect with at Westgate once you get there, so if you were going to west harbour, hobsonville or etc; tough luck. Would note 00:00 18 (to new lynn) connects you with options of route 14 and 154 around 00:40 for comparison. So much for Westgate being an interchange.
132 – 23:19 last bus, leaves a lot to be desired, esp on Friday and Saturday nights where there is no more niterider
133 – 23:30 last bus, leaves a lot to be desired
134 – 22:55 last bus, this is probably the most logical way to Henderson after the trains stop at 22:00 Mon-Thu. Yet it ends so early.
Yet when you look at central service improvements under NN west (i.e. NN Rd and S Rd) some services quite a bit past midnight now.
Yes would be great to have open source data access to AT’s bus data. The Sylvia Park frequent 32 bus to Mangere I’m interested in for example. Seems quite empty/totally empty at the Sylvia end when I’ve happened to see it, but that’s normally inter peak or at night. Thing is until we have the Central NN, it overlaps with the existing services a bit like the 515 & 757 from Otahuhu township.
Just one comment: doesn’t the farebox recovery graph lag by one month compared to other indicators? That means that the effects of this 6+% growth won’t be felt until next month, for example.
It used to but doesn’t seem to anymore, has been that way for a little while.
Is there a matrix of boardings & alighting from & to each station somewhere like we have had in the past?
I think that data is released on annually whereas these are monthly reports.