Auckland Transport have now published the ridership figures for June. The month is one of the most important in the year as it represents the end of the financial year and so the results are what become the official results for the year.
The month was also interesting as it’s one of only a few months we’ve had over the last year or more where there have been the same number of working days in the month as the same month the year before. In fact, there were the same number of working days in June 2015 too. Here are the high-level results for the month and compared to June 2016.
- Total trips – 7.7m, up 11.1%
- Rapid Transit – 2.2m, up 20.3%
- Rail – 1.8m, up 20.6%
- Busway 441k, up 18.9%
- Other buses – 5.1m, up 8.0%
- Ferry – 434k, up 4.8%
One of the things that has been notable in recent months has been the return to growth on non-busway buses. This is important given those buses still make up the majority of PT trips. At this stage, I’m not sure how much of that is related to the new network in the areas that has been rolled out compared to strong growth on routes such as Mt Eden and Onewa Roads. Whatever the reason it’s a good result.
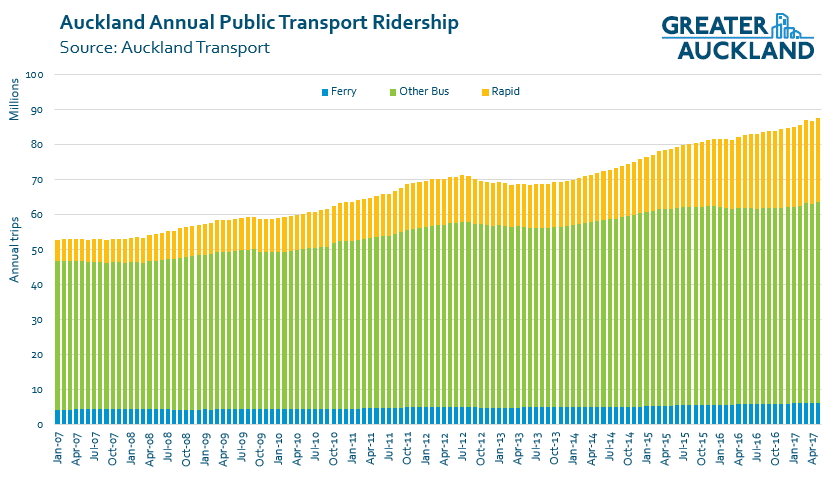
But the most interesting results are the annual numbers. For the year we ended up with
- Total Trips – 88.42 million, up 6.7% (was 82.9 million).
- Rapid Transit – 24.42 million, up 16.5%
- Rail – 19.60m million, up 16.7%
- Busway 4.83 million trips, up 16.5%
- Other buses – 57.85 million, up 3.2%
- Ferry – 6.15 million, up 4.6%
The rail network continues to creep closer to that 20 million target the government set for starting the CRL earlier than 2020. At current rates, we’re likely to hit it in August. We’re also likely to hit 5 million annual trips on the busway in August too.
Here’s the normal graph showing the changes over roughly the last decade, with rapid transit being the biggest growth factor.
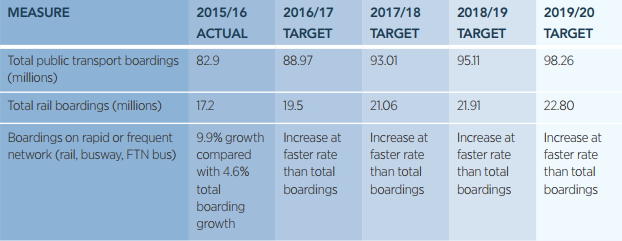
AT had a target for the year of 88.97 million trips across all PT so they did fall a little short of that but they did exceed the rail target of 19.5 million. They now only split out the rail target from the total so the other modes don’t get (public) targets. Looking forward though, their targets for 2018 through to 2020 are very concerning. As reported in their new Statement of Intent, for the 2017/18 financial year their targets are 93.01 million total trips and 21.06 million rail trips. Those represent increases of 5% and 7% respectively and given rail has been experiencing double-digit growth for many years, for it to suddenly drop to just 7% seems fairly unrealistic. The targets for the subsequent years are equally silly in how low much of a low bar they set, so much so we could surpass the 2018/19 targets a year early.
To me, it seems there can only be three possible reasons for these targets being so low.
- AT are being completely unambitious and setting targets they feel they can easily achieve. If this is the case then it’s time to set them some new goals
- AT think that they’re close to tapping out the potential PT market, an absurd proposition given Auckland’s high growth, congestion, low modeshare, and poor PT services (particularly off peak). This is especially so compared to comparator cities.
- AT are expecting capacity constraints to kick in resulting in people simply not being able to get on services.
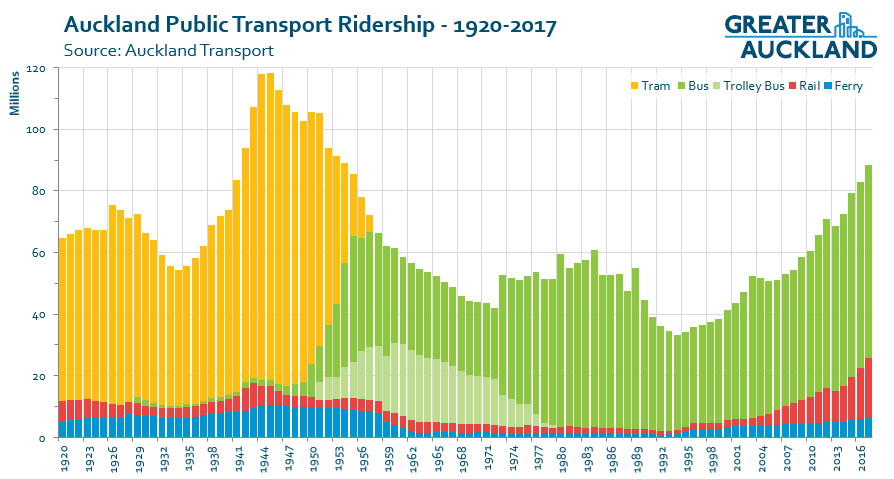
The 88.4 million trips did help pass another milestone though, we finally surpassed the total achieved in 1955. Had we achieved the target of 88.97 million trips, we would have passed the 1954 result too. However, it’s still some way off the highest ever year for PT use. In 1945, right at the end of WW2, our mostly tram based PT system carried 118.2 million trips. Usage held up well following the war until the trams started to be removed in the early 1950’s and it kept falling until the oil crises in the 1970’s.
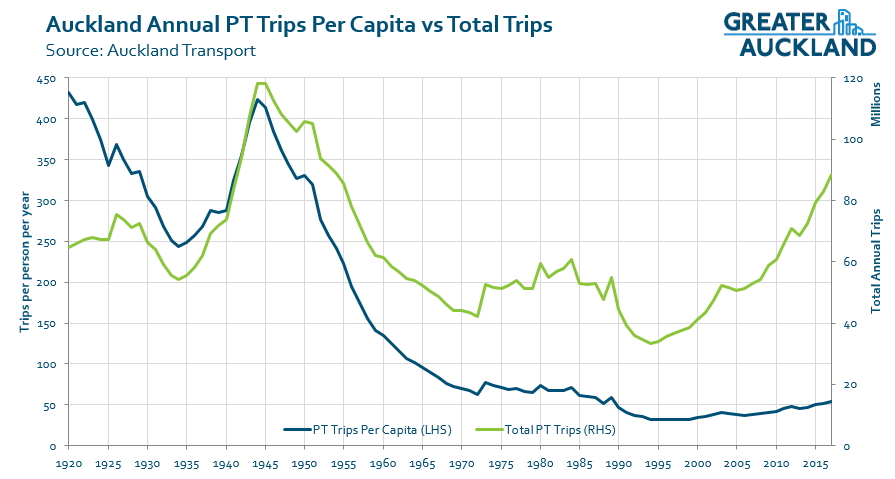
Of course, back then there were far fewer people living in Auckland too. Per capita usage was over 400 trips per person, by comparison it’s now at just under 54 trips (and increasing), and that’s up from a low of just 32 from the years 1994-99.
Edit: as requested, here’s the results with the ‘per capita’ results

 Processing...
The Greater Auckland graphs are absolutely fantastic. What programme is used to create them?
How hard is it to show the Auckland Public Transport Ridership 1920 – 2017 adjusted to be per capita?
Just Excel, as for per capita, not hard. It already exists in my file
would love to see per capita graph too
Have added a ‘per capita’ graph for those interested
Fantastic, Matt. Except it’s so dismal!! Thanks.
The early 90s long bus strike ( or was it a lockout) shows up clearly as the ‘big dip’ in that era. A lot of people moved over to cars and never went back. 10 years of lost passenger growth.
I still think the second hand Japanese cars entering the market at that time made a big difference.
Wonder what accounts for the small spike in ~1989. Anyway quite flat really overrall since about then which slightly surprises me though last two years to 2017 would have been stronger?
Excellent – thank you Matt.
If you could what would be even more stark would be to see a graph with total trips (actual) vs total trips (adjusted based on population growth from the original baseline point of 240odd million trips) – would imagine it would have been over 1 billion PT trips pa in that case.
@ Grant – the spike is probably a result of the recession following the ’87 market crash. Then in the ’90’s things were picking up again and cars were getting cheaper.
Agree. I’ve not seen the 1920 to 2017 ridership one before. Thanks Matt.
Set lower targets —> look better when they’re achieved.
There are a few services with 3-car sets during the peak that are running into capacity constraints, but there are lot of 6-car sets cruising around with loads of capacity so I think 7% is rather unambitious for the rail network.
Not sure when they are planning on reducing the track through Mt Eden to single track as I imagine this could reduce growth for a while.
jezza – I would guess soon, as there’s a lot of construction activity and porta-cabins being moved on site around the prison and Normanby Rd. It’d make sense that they would want to get that out of the way as soon as possible, as it will cause a lot of disruption like you said.
CRL package C5, which is the Mt Eden connection, has not had its EOI released yet so your portacabins will be for something else, quite probably another apartment development. C5 comes out in the first quarter of 2018 I think, and the RFT for the shortlisted consortia will probably follow about 3 months later. Tender design will probably take about 6 months (a guess) and so I would not expect any construction related activities for 18 months at least. Some P&G work may happen beforehand though.
Must be work on the prison then perhaps? I can’t imagine the carpark there would be developed into apartments – the view wouldn’t be one to inspire much. Maybe they’re building another multi storey car park – not like it’s needed
I’ve often wondered about that multi-storey car park!
They are jus in the process of starting a new building – from memory Dominion are the builders
The bridge over the rail line at Normanby Rd could be the likely project ?
That’s all going to be part of package C5, so it definitely isn’t that just yet.
Probably the porta-cabins are temporary prison housing 😉
Single track is going to be a nightmare so expect as the norm unreliable services and delays. As for the specials that service Eden Park, that will definitely be problematic.
Surely with the importance of this line double tracking is paramount? Anything less is unacceptable.
I just don’t see how they could build the junction without going down to a single track for at least a year :/
I imagine services would be reduced to every 20 mins, so it would depend on how long the single track stretch was as to what delays are experienced. There is a significant stretch of single track between Pukerua Bay and Paekakariki that works OK with 20 min frequencies.
The moment trains get out of sync for a plethora of reasons, and it will happen and I well remember it on the western line before double tracking, and in Wellington, the whole programme goes out the window and people lose faith, quite rightly.
I’m sorry but after working hard to gain patronage some half arse budget model sold as a bit of pain for gain crap will not work.
I guess it would come down to how much more expensive it would be to maintain two sets of tracks through the worksite, I imagine it would cost quite a bit more but I’m not expert on construction.
The single track through the Newmarket station worksite between 2008 and 2010 worked fine. I imagine the section through Mt Eden might take a train a couple of minutes to pass through, so I think you might be overstating the knock-on effects a bit.
I would prefer they maintained two tracks as it would allow existing frequencies to be maintained, but not at any cost. It would be interesting to see if every second service terminated at Kingsland with good bus services provided to midtown how many would choose this option. It could be quite a few given the circuitous route by rail from Kingsland to Britomart at the moment.
Yes don’t think it’s going to be that bad, a short section, minor waits when there is a clash. Hopefully they can get some accuracy in their time keeping by then. Stopped buses & trains while you are on them are more of psychological thing more than anything in the grand scheme of a 24hr day.
The housing crisis after the war was solved by greenfields developments and roads. The graph shows so clearly what happened to public transport ridership as a result.
Petrol rationing which would have driven PT usage during the war years didnt end till May 1950, all though the personal usage quantity may have risen one the war was over. A lot of the reasons for restrictions were the lack of shipping for the imported petrol.
As for the housing , that too was in short supply after the war so took some time for the new suburbs to start being built.
the growth on the general bus network is extremely encouraging given that the NN is yet to roll out in many places and will continue to be refined and improved for many years to come.
But I do wonder how much of an effect the Double Deckers have had. My experiences catching buses on Mt Eden Rd have been much better since they came into service, because most buses now have a small amount of capacity left when they get to the peak load point, so are not leaving people behind quite as much.
Regardless of the cause, long may it continue!
Battery powered trains for Pukekohe and a backup for when CRL works disrupt overhead electrics.
http://www.nzherald.co.nz/nz/news/article.cfm?c_id=1&objectid=11893413
Yep 17 new trains by 2019 should hugely boost capacity
Unfortunately it still needs the council and the government to fund it, unless we change the government there is no way they will be in service by 2019.
It’d be an easy bribe for the Nat electorates out west, to say they’re getting new trains. I don’t see why the government wouldn’t fund these, they’re low cost (relatively), and popular with voters.
Wouldn’t surprise me that this is exactly what happens in the next couple of months.
Don’t forget the part where they also ‘pay for it’ with an interest free loan to the council.
Hopefully they order them as mostly permanent 6-car BEMU or even better order them in a way that cars can be mixed and matched to create permanent 6-car EMUs and BEMUs.
Creating permanent 6 car trains is a bad idea. Firstly if a single carriage has a door problem the whole 6 car set is out of service rather than a 3 car set.
Then you have maintenance schedules which allow more 3 car sets to be in the workshops during the off peak hours while others are meeting the lower capacity requirements or are running more frequency. ( Its better off peak to have 2 x 3 car trains in say 20 min rather than 1x 6 car train) the other thing with maintenance is that its based a round running times. The peak times are relatively short so 3 car sets are better sitting in yards if not needed. Same goes for weekends.
Virtually every rail transport system has split train sets for very good reasons, whether they are running trainsets of 2 , 3 or 4 cars.
17 extra trains,I assume at that pricing they wil be 3 car trains, it would be interesting to see the configuration and if it would be possible to use some of the existing cars with cabs to allow some of the new cars to be non cab types to allow 6 car trains
I imagine they will be 3-car sets as the depot can’t handle six car sets I believe. In fairness we are years away from having capacity issues with 6-car sets. The tranches purchased after the CRL opens will probably be when we have to start looking at continuous 6-car trains.
I think the double decker buses are helping capacity and therefore growth but there are far too few. Birkenhead have 5 now I believe but it’s hit and miss capacity wise most of the time at peak.
Lack of capacity with the majority of the bus fleet and the cost of these buses plus the fact that the limited numbers of EMU’s may be why AT seem rather ambitionless.
+1, double decker buses should be the norm on Onewa Road services with single deckers only used to boost peak capacity, rather than the other way around.
As a goldcard bus user I prefer a single decker and double the frequency. Not owning a fancy phone I can’t run that app that tells you how long the next bus will be. The worst was a midday journey from Wairau to my Birkdale home that took longer than it would take to walk – that was using Maxx website for its advice.
I suppose my view of North Shore buses is they are empty and that is probably not the experience of the youngsters on this website.
However the sight of a Birkenhead Bus Company bus in its proper livery always cheers me up and the new double-deckers are in that drab scheme that makes one blue and grey.
Given that I was specifically talking about the Onewa Road buses which run at least every ten minutes all day and are always full I don’t think your criticism applies.
Thanks Matt, really interesting to see the history. So the trams moved over 300,000 people per day in the 1940s! The fall when it switched to buses and trolley buses is dramatic. Anybody who wants to restart the BRT vs LRT debate should be forced to explain that graph.
Anyone who wants to start that debate will have to explain the Northern Busway. Why go back 80 years to compare when we have a real-world example of BRT working super well at moving loads of people?
Northern Busway is great. OK even for double deckers. Where is the parking? Not for me but for most users.
park and ride is an expensive way to grow patronage in built up areas. Much better to improve connecting services, like AT is doing. Note also that less than half of existing users access busway using park and ride. Sometimes what is visible is not always what is important.
Less that half?! maybe before 8am. It’s 14% across the day actually!
An expensive way, and also a way that destroys the place. The bus station needs good cycling and walking connectivity and carparks destroy that.
The simplest way to grow patronage is off peak, shoulder and weekend cheap fares. Surely the next easy picking.
Yes. I wonder if someone can explain what the drivers for AT are? I’d heard that the student concession was decreased at one point because it had been taken up too much (great patronage but therefore using up more of the budget) so by decreasing it they reduced patronage and kept more budget. Is that correct? Would the same thing happen with offpeak fares? Increasing patronage being cool but if it hasn’t been budgeted for, they don’t really want it? I’d love to understand the 50% rule or whatever it’s called.
Auckland transport is required to achieve 50% farebox recovery across the network. So overall, the cost of supplying public transport needs to be covered 50% by user fares, and 50% by subsidy. Some routes are worse, some better. A number of busy ones will have more than 100% farebox recovery, i.e. that fares more than cover costs and actually make a profit. This is used to offset other routes that are less productive.
This requirement is set by central government, not by AT or council. The 50% figure is of course completely arbitrary, some politician decided that half-half was ‘fair’. It doesn’t give AT the flexibility to really manage service deilver costs, fare prices and subsidies particularly well.
The good news is that the PT system is becoming much more efficient with investment in new infrastructure and the redesign of the networks. So getting 50% cost recovery isn’t really a problem any more.
Thanks Nick. So if Peter’s suggestion of off peak fares is brought in, and it increases patronage, is there any other reason why AT would have to curtail that? Cheers.
I really do struggle to see how anything more than a half full bus can’t be profitable? Sure they are bigger, more expensive and use more fuel than a car but if you have 30 people on a bus then that is at minimum $95 for say 30 minutes (for arguments sake rough numbers). Driver = around $10 (@$20p/h), fuel = $25 (@ $1/l, bus (incl maintenance) = $18 @$650p/day, then you have a few other things like rego/RUC/insurance call them $2 for that 30 mins) =$55 per 30 mins. Even if it was $65 that still leaves $30 profit (or around $1000 per day). Sure there are times when the buses are driving around empty (there are also times when they are completely rammed). So you can see why AT has gone and renegotiated with the bus companies as they must have been creaming it!
Add in leave cover, recruitment and management costs, break costs for the employee. The for the bus, add cleaning, the stabling costs, the spare buses needed for maintenance, the spare buses needed to accommodate peak (or deadtime for buses that are being used in the peak), then add the dead run to start and end the service, then add in $219 a day of depreciation for a double decker with a ten year lifespan.
The *marginal* cost of running a bus once you have it is reasonably low. The total cost of running a full week’s service permanently is really high. This is part of the reason that improving off peak frequencies makes such good sense. You have buses that cost 800k and are already at one end of the route that would have to run dead to the depot to sit idle otherwise.
+1
Over the 1 month period the number of users increased from about 7 to 7.7 million total.
That’s an extra 175 000 extra PT users per week
That must mean that many people have switched to using PT from their cars.
This more than offsets the 800? extra cars that are supposedly added to our roads every week.
Two issues with this 800 more cars number. 1. Is it net? How many are scrapped, leave AKL? 2. Are they moving much? Already our cars are parked 96% of the time, it is likely (NZTA odometer data) that each one in AKL is moving less and less, ie that 96% maybe creeping up… so are just storing more expensive imported tin than ever before. Either way it’s horribly inefficient.