Auckland desperately needs housing, and apartments provide crucial options for housing in accessible, high demand areas. Greater Auckland is actively working to enable apartments in more parts of the city, as a member of the Coalition for More Homes.
Tamba Carleton is a Director in CBRE’s New Zealand research team. In this guest post (originally published by CBRE, reprinted by kind permission), Tamba looks at where apartments are currently enabled and where they’re being built.
The nature of Auckland’s housing stock is changing. Population growth is being accommodated through a combination of “up and out” housing development which has been enabled by the Auckland Unitary Plan. This region-wide planning document became operative in 2016, having a transformative effect on the density of housing supply in Auckland. This post takes a closer look at the Unitary Plan zones where apartment projects are happening.
THAB (Terrace House and Apartment Building) is the most popular zone for apartment projects
Different zones have different capacities in terms of what can be done, both on individual sites and as a collective impact on the built form of Auckland. The Terrace House and Apartment Building zone isn’t widespread, making up just 7.5% of residential land in Auckland – each of the other three main zones, Mixed Housing Urban, Mixed Housing Suburban and Single House Zone cover at least three times the area. Still, the THAB zone is well suited to mid-rise apartments and accounts for 47% of apartment projects across Auckland.
The next most popular zone is Mixed Housing Urban, at 19% of apartment projects. This zone suits the low-rise walk-up typology of up to three storeys.
FIGURE 1: Summary of Unitary Plan Zones with Active Apartment Projects
| General Use | Unitary Plan Zone | Height Limit | Approximate Max. Number of Levels | Average Levels per Project | Total Hectares | Number of Pipeline Apartment Projects |
|---|---|---|---|---|---|---|
| Residential | Terrace House and Apartment Building | 16m | 5-6 | 5 | 2,485 | 44 |
| Residential | Mixed Housing Urban | 11m | 3 | 3.2 | 7,531 | 18 |
| Business | Mixed Use | 16m | 4-5 | 7.9 | 984 | 16 |
| Business | Neighbourhood Centre | 11m | 3 | 3.8 | 132 | 4 |
| Residential | Mixed Housing Suburban | 8m | 2 | 3 | 14,969 | 2 |
| Business | Local Centre | 16m | 4-5 | 4.5 | 246 | 2 |
| Business | Town Centre | up to 25m | 4-8 | 4.5 | 442 | 2 |
| Business | Metropolitan Centre | 72.5m | 18-20 | 15.5 | 382 | 2 |
| Business | City Centre | varies | varies | 46 | 261 | 2 |
| Residential | Single House | 8m | 2 | 2 | 8,539 | 1 |
Source: Auckland Council, CBRE
There are only two active projects in the City Centre zone currently; however during the peak in 2016-2017, there were over 30. Apartment development in Single House zones is rare.
Although the THAB zone allows up to 5-6 storeys, there are almost as many 3-storey projects in THAB zones as 5-storey projects. Conversely, there are seven projects that are 10-12 storeys in the Mixed Use zone, which generally allows 4-5 storeys.
Only THAB, Mixed Housing Urban, Mixed Use, and Neighbourhood Centre zones have more than four current projects. The other six zones in Figure 1 have either one or two. Figure 2 maps the areas of the zones with four or more projects, showing that the zones are spread across the urban area. Wide geographic variation has contributed to a rise in the suburban apartment pipeline since the Unitary Plan became operative. Of the 93 pipeline projects, 79 are suburban.
FIGURE 2: Unitary Plan Zones That Have Four or More Apartment Projects Currently
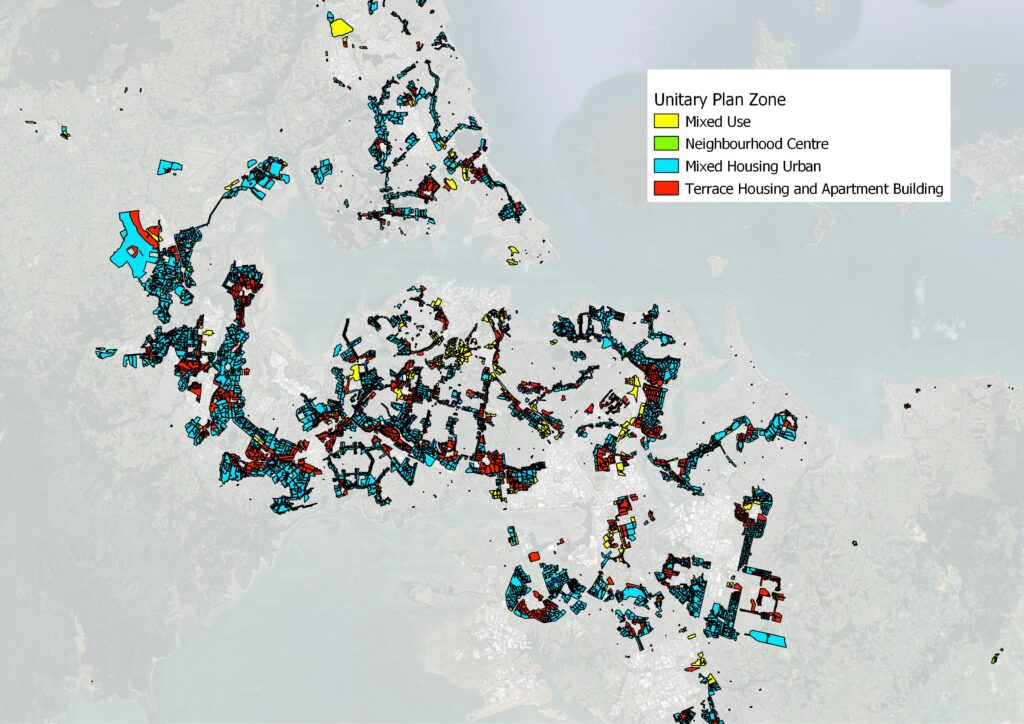
Source: Auckland Council, CBRE
Building consent data shows that over the past ten years, medium-high density typologies like apartments and terrace houses have come to dominate new housing construction. In the year the Unitary Plan became operative, standalone dwellings comprised 56% of residential consents, however by 2023 this proportion has declined to 27%. Apartment and terrace developers have increased market share from 38% to 69% over the same timeframe. A total of 18,400 apartment units have been built in the past eight years, lifting total Auckland supply to 45,000 units.
Plan Change 78 responds to Government housing supply legislation, which will double down on intensification. In “Going for Housing Growth“, the new Government has reaffirmed support for the 2020 NPS-UD (which allows for more apartments in certain locations), while giving councils an ‘out’ on the 2021 MDRS (which allowed for 3-storey development in most places). That means that Auckland’s shift to medium and high-density is likely to continue.
There is also new potential for apartment development in the Single House zone, subject to Plan Change 78 outcomes. This zone comprises 8,500 hectares, second only to Mixed Housing Suburban at 15,000 hectares, greatly increasing the range of locations available to apartment developers.
FIGURE 3: Apartment and Terrace Proportion of Auckland Residential Dwelling Consents

Source: Statistics NZ

 Processing...
Fascinating map. My takeaways:
Effects of ‘character’ zoning super clear.
Shows the clear need for Avondale-Onehunga or a similar off-road passenger service – that crosstown band is currently not well served for PT.
Northwest RT can’t come fast enough.
Maybe Auckland Council needs to bring in LVT for the city centre first – far too much empty land around in the city centre currently.
Fascinating map? Disappointing map! No wonder the general populace may be feeling a bit jaded with the whole process. The map of Zones looks more like the bottom of a pot that you have been scrubbing for some time, trying to get out a bad stain. No such luck – you’re stuck with the crud lodged between the gaps.
Not wanting to tell Auckland Council how to do their job, but perhaps what the map should be looking like is:
• Big broad brushstrokes of red colour, aligned with the major transit corridors of rail and bus routes. THAB on ALL routes please!
• Far more intensity in the inner city. Not blank. Housing needed here most of all!
• Keep the green colour for parks and greenery, because, you know…
• No areas of white, implying no zoning. This means you, Eastern suburbs!
• A regular sprinkling of neighbourhood centres, in a new colour, every 500m or so, across the motu.
• Everything else blue for Mixed Housing Urban.
So, solid blocks of colour, wall to wall. No more pot-scrubbers.
Trouble is developers sprawl, where they get land cheap. They don’t care if the infrastructure is there and are enabled by a.c staff who often have conflicts of interest
Lol. I must have been in the bathroom for that, seeing how hard Auckland Council and Auckland Transport fought against the greenfield plan changes and consents I have been involved with.
Yes, the good part was they fought so hard with every lame excuse that the decision makers didn’t believe any of what they said.
maybe take a drive to the infrastructure neglected north west and you will see what I mean. AC even allowed land reclamation, 7 hec of prev wet land next to the kumeu river at Kumeu central behind the shops, a huge contributing factor to flooding issues in the area despite vocal opposition from the community who predicted increased flooding which is exactly what has happened. AC is involved in the supporting growth plans to wipe out housing, green space and businesses in this flood zone/flood plain for bus lanes (which they like to try and kid us is a rapid transit corridor) despite 3 serious floods.
Yes maybe we need new names – are they still Townhouses if built in a field in middle of nowhere?
Special Character overlays really are disgraceful. All these pieces in the Herald etc make me laugh talking about the ‘demise’of Ponsonby Road. At no have any so called journalists looked at the fact its a 4 lane arterial with no cycling infrastrcutre and probably most importantly, the Waitemata Ward which covers Grey Lynn and Ponsonby actually shrank over the last few years. Compared to the foot traffic round the corner on K Road which seems to be doing great and has large apartment buildings nearby.
Council should just be honest, Grey Lynn is a museum, gate it off and bundle entry fee with your Motat ticket
Great post today by the way, enjoyable read 🙂
Zoning is one thing, but ability to fund projects is another. While borrowing is expensive and building cost are high, securing funding for maximum apartment yield is difficult.
CBRE did good work for North Shore City on the probable build for Albany Centre vs. the permitted maximum. Of course, a lot of factors have changed since then. But notice Kainga Ora’s difficulty trying to right-size a project next to Don McKinnon Drive which once had consent for two mighty tower blocks.
The worst risk for Auckland is developers falling short of the permitted yield in order to get some return on their investment, if they can only afford less than Zoning shows as desirable. A scatter of high-yield apartments along transport nodes and corridors may not overload infrastructure but may support PT and local businesses. This may be important if larger centres similar to Albany and Northcote struggle to fund the full development potential.
West looking All blue, yet no Public Transport available.
The alternative SH16 and dedicated bus lane is imminent! Come on
For some reason my comments earlier wasn’t posted.
Great post! I find it interesting that our terrible journalists have recently been writing artciles about he demise of Ponsonby Road and not once have they mentioned that fact its a 4 lane arterial with on street parking and no cycle infrastructure but more importantly it doesn’t mention that the Waitemata board which includes Ponsonby and Grey Lynn actually shrunk in the last census. Imagine if we had decent journalists in New Zealand who could put 2 and 2 together.
If those suburbs want to stay locked in time then its time we gated them off and included entry to them as part of your MOTAT ticket…who is going to want to drive across gridlocked town when their own suburbs are starting to build better cafes and restaurants?
council maps excluding Rodney and Franklin. Again.
Rating maps include these more rural districts,
planning and infrastructure funding maps – not so much.
From the maps here – its clear there are no apartments planned in Rodney or Franklin.
the maps are from the CBRE report, which show 100% of the zone in the AUP that have more than 4 apartment projects in them currently (ie not the sites where the projects are). Its not a conspiracy by AC to denigrate that well known apartment areas of Rodney and Franklin. Also, some what ironically, your username is clearly designed to be misleading and spread false information, west is best.
maybe an overlay of Healthy waters up dated flood maps and OLFP needs to be included? Would be interesting
Does it matter much if all the young people have left Auckland to live in Australia where there are jobs? If the only apartment dwellers soon will be immigrants waiting in NZ for PR or citizenship before shifting to Australia where there are still well paid jobs? If Auckland will be an empty city of geriatrics? So much for the Helen-N’John-Key economic miracles based on importing people and their money – when all that is left behind is elderly welfare-dependent parents and school kids.