As we invest in our public transport network, it’s critical that we not only invest in transformative projects like the City Rail Link, but that we also get as much use as we can out of the network we already have – which will also maximise the outcomes of those large projects. As such, we’ve long highlighted the need to improve our rapid transit stations, and how we access them.
Auckland Transport have slowly come to this realisation too and have recently released what they call the Auckland Rapid Transit Station Study which looks at how our current (and some future) rapid transit stations and ferry terminals perform. Here’s how their website describes it.
The Auckland Rapid Transit Study sets out a framework of best practice to better understand and improve the performance of rapid transit stations. The study covers a variety of the aspects of what makes great transit stations – transport access, land use, and customer experience.
About the Rapid Transit Study
Auckland’s Rapid Transit Network (RTN) generates a disproportionately high amount of patronage and the network is set to grow hugely over the next decade, with investment in the Eastern Busway, CRL and southern rail stations, to name just three, adding more than 20 new RTN stations to the network. Auckland transport have investigated station access and experience across the RTN network – including an analysis of existing facilities, customer experience and the ease of transport access and the land use around each station. The goal of this work has been to provide guidance for improving station experience and access, with the long-term aim of improving station access across the network, growing patronage, providing better end-to-end customer journeys and to create thriving communities around rapid transit stations.
This work has aimed to identify:
- Deficiencies across the network for access by mode, station experience and land use integration, and priority locations for investment.
- The key function for each station – and the ‘ideal’ vision for customer experience, access and integration.
- How access to transit can be improved for all users, and the high-level steps we need to take to enable well-functioning urban environments around rapid transit stations.
- The planning and infrastructure needed to support our growth, climate, transport and urban development aspirations.
- A tool for various public and private stakeholders that can break down the silos required for achieving common goals and making decisions together.
It’s described a bit more in the report itself.
For Auckland to thrive in the future, we must reframe our approach to growth, investment and integrated delivery. Recent policy has begun to use the term ‘well-functioning urban environments’.
This term calls for growth that is for the benefit of all people in an equitable and climate-friendly manner. The most obvious place to achieve this kind of growth is around transit stations. This is particularly important near public transport nodes, since it offers opportunities to address these various transport, housing and climate issues simultaneously. The goal is to have a compact city that is easy to move around by walking and cycling, with strong access to public transport.
The challenge is ‘well-functioning urban environments’ do not just happen organically. They requires cross-sector collaboration to break down complex silos. This study is a direct response to this requirement. A tool has been developed that captures the key actors and factors involved in creating well-functioning urban environments around stations. It captures and measures levels of transport access, land use development and customer experience around stations. The tool then establishes how far the area around the station must further develop to be highly liveable and accessible.
To achieve multiple policy goals, the transport planning horizon should extend beyond the rapid transit station itself. These stations are the key anchors for enabling thriving neighbourhoods. The existing and future rapid transit network is a city shaping instrument to make Auckland a better place for everyone.
In total the study covers 81 current and future stations, 45 train, 24 bus and 12 ferry. It’s notable that light rail isn’t included on here when other unfunded future lines/stations are. I also find it somewhat odd that ferries get included in a rapid transit study given there are no plans to make them frequent enough to qualify.
One thing that is interesting about this network is the authors say that if station catchments were developed to the maximum of the new zoning rules, they could accommodate 1 million more people. That’s more than all of Auckland’s expected growth for the next 30 years.

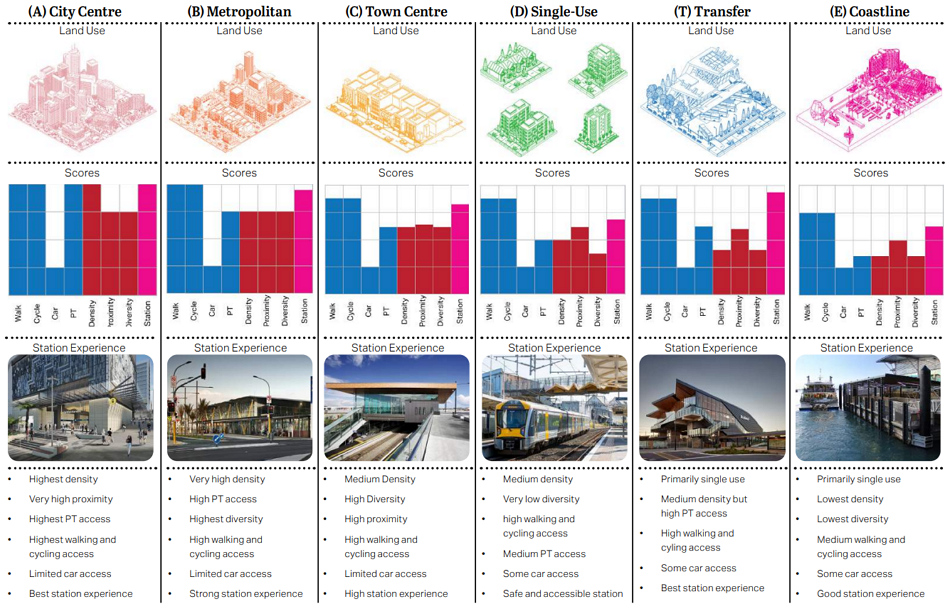
For every station, the study has assigned it a typology to compare their performance to. This is that we’re comparing outcomes more fairly as we shouldn’t for example, expect a suburban train to look like or perform like Britomart. This shows the assigned typology for each station and the expected scores for eight different metrics they’re compared to.
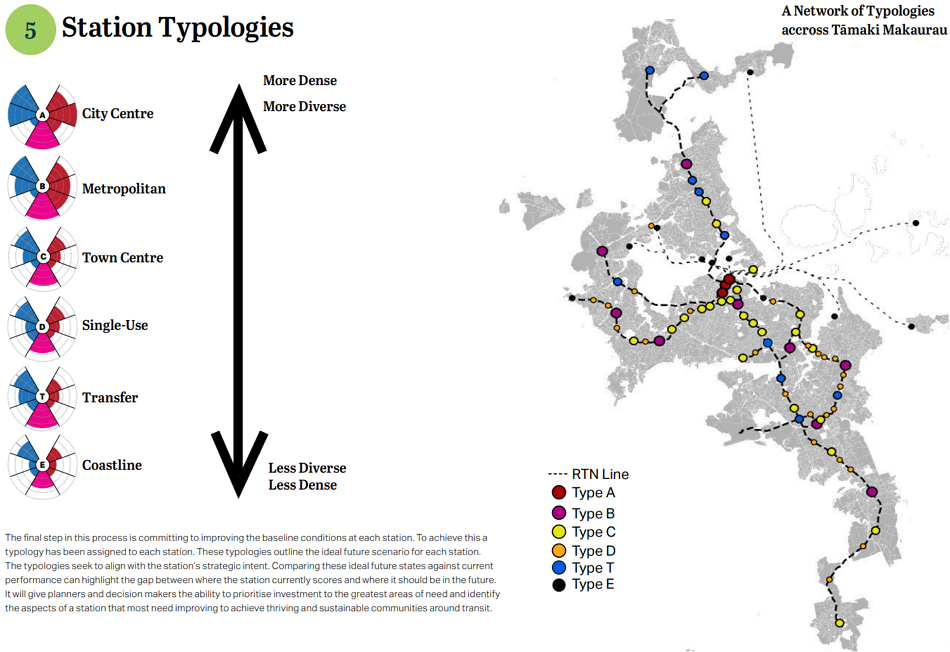
One thing that stands out is that at all stations, high levels of access by walking and cycling should be expected.
So how do our current and future stations compare. A high level summary of that is below. Access to stations by bike certainly stands out as by far the biggest single deficiency while it also highlights that we have an over-abundance of car access. It notes
Cycling access represents perhaps the most significant opportunity to improve access to Auckland’s rapid transit stations. It also has significant potential to increase patronage, reach more people and help achieve various policy goals.
It’s also interesting to see those deficiencies mapped out over a deprivation index map which shows many of the stations with the biggest deficiencies are also in some of poorer areas – places where getting substantially more people to use public transport could have a material impact on those residents cost of living.

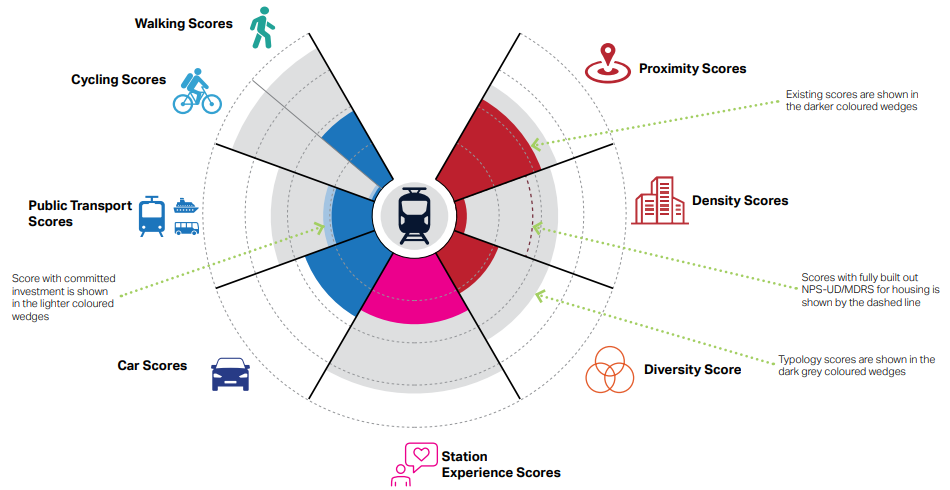
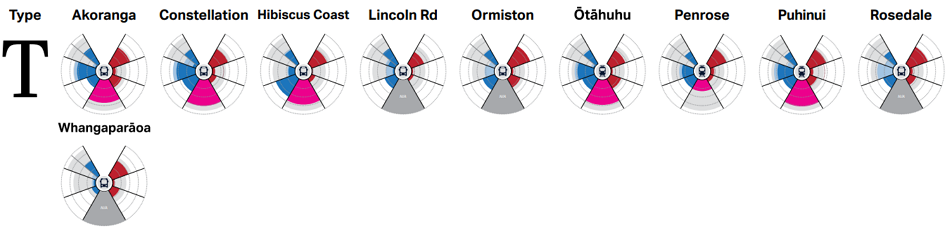
The study has deficiency maps for each of the eight metrics but they are also highlighted as a butterfly model. A quick description of how to read this is below
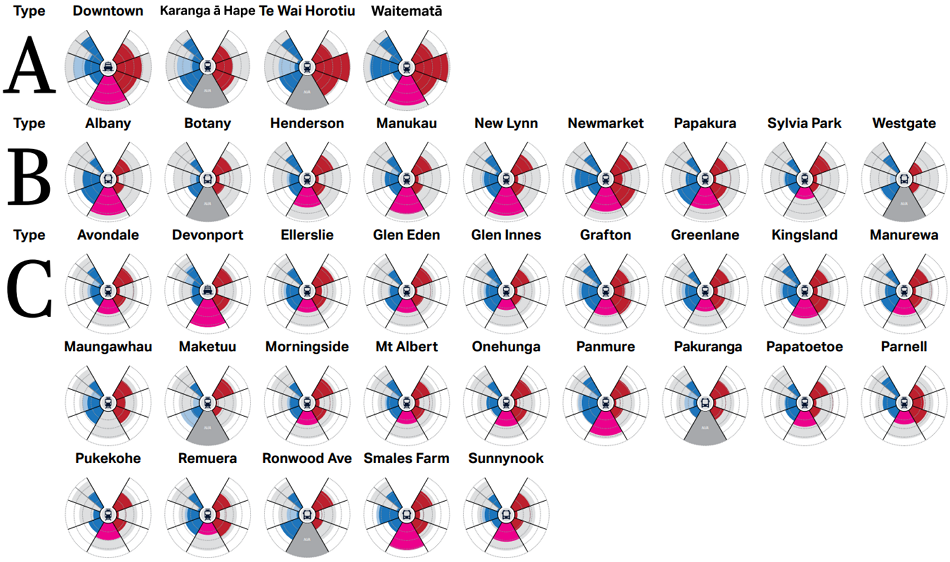
And these are the results for each station.

There’s more information in the report highlighting how they came up with the scores and it’s not just based on thoughts but includes a range of qualitative metrics based on GIS analysis.
The key benefit of this works is that it provides a baseline for how each station is performing and where things most need to be improved.The hope is that this will then feed into projects to address these deficiencies. However, fixing some of them, especially walking and cycling, is likely to require some significant changes within AT, such as being more willing to change street layouts and traffic flow priority.
Lastly, while there hasn’t been any announcement about it, they are doing a quick survey on if you agree with their findings. This is open till Monday 16 October.

 Processing...
The density score for Albany says everything anyone ever needs to know about albany. Infact the density score across all ‘metro centres’ is an absolute joke.
Albany has huge zoned potential for denser apartment housing, but not much has eventuated (like two or so large blocks north and northwest of the mall)? I’d be interested what is keeping that from developing more – maybe still simply that apart from the mall, some big box retail and the stadium, there isn’t that much urbanity that would attract people wanting an apartment. Maybe the busway will help a bit.
That is because the Council wrote too many rules. The more nonsense they put into their precinct plan rules the less likely it is that anything ever actually happens. The problem is these things are written by rules enthusiasts at the Council.
Yeah this is correct in my view. We’ve zoned for apartments but at the same time as we’ve adopted lotsa quite expenny rules that make apartment buildings less feasible, like balcony requirements, minimum floor areas, landscaping requirements etc.
Two things about Albany:
1. I ride there from Browns Bay every day I’m in the office. I’m genuinely surprised it ranks so poorly on cycle access. Not because it’s a good experience for a cyclist (it isn’t) but there are cycle lanes all around it and I would have thought AT would leap on claiming their existence. Are they protected, well thought, and cyclist-prioritising? No, of course not. But this is AT we’re talking about.
2. I assume the landbanking going on in the area will one day lead to a metro-esque built environment. The block around Cornerstone Dr and Eliot Rose Ave shows the potential. Add to that the increasing number of apartment buildings in Browns Bay itself as a satellite of this too.
Cycle facilities around Albany Centre are gappy and some are outdated by current standards, being 20 years old. Nothing that can’t easily be brought up to scratch, same as the pedestrian connections. It’s just the economic climate for apartments that needs an upturn. And less upmarket rules for apartments might help- the precinct rules are quite ancient, too.
I like the butterfly visualization’s comparison of where the scores should be by location type (grey wedge) against the current scores (dark coloured wedge).
A very pretty way of saying, ‘Could do better.’
I think these diagrams are a useful, but sadly not very intuitive, way of displaying a lot of data.
What does a deficiency of MINUS 9 mean? For cars? All the other deficiencies are positive. So does this mean that cars are TOO GOOD for PT stations in Auckland? Considering our Cars First attitudes I wouldn’t be surprised, but seriously? Weird metric result…
It means we prioritize cars too highly, and could do with less car provision according to their ideal model.
Makes sense if you are looking at space efficient ways of accommodating and moving people.
A very good analysis of the weaknesses of our network.
It is not pleasant, for example to step outside Panmure Station into what seems to be an ocean of automobiles.
Cars have had priority for seventy plus years, it must be the people’s turn again?
Cities are generally defined by people, not machines.
Ironically, Panmure has actually solidly improved for walking and cycling and PT in the last 15 years (albeit much of it came via a “Have your cake and eat it too” approach of keeping all car capacity (or even adding more while rebuilding” and then expensively retrofitting the other modes into even more overall space.
I do wonder if it’s wise to condense the walking attributes down to just one sector of the pie when we know the Healthy Streets Framework is multifaceted. But I haven’t read this to see how they did it.
These sure show the cycling access deficiency which I’m sure is going to be the biggest improvement to come.
100%. Going for a bike ride in Glen Eden (and a many other stations) starts with a train ride to somewhere less bike hostile.
Oh well given this report, I am sure AT will be falling over themselves to build bike infrastructure./s
“That’s more than all of Auckland’s expected growth for the next 30 years.”
Just wondering how this dovetails with the TERP? It seems likely to be more important for reaching existing populations than just accommodating population growth, but perhaps I have that wrong. Can you comment?
As a frequent user of Parnell station I am surprised that it has a low priority for improvement as in my view it has the worst walking access of all stations. The network of streets between the station and the town centre have terrible pedestrian access, with narrow or non-existent footpaths. The footpaths that do exist are dangerously uneven and frequently blocked by parked cars, power poles, rubbish bins and road signs. Improvements to Akaroa St, Tilden St, Tika St, Falcon St and Cheshire St would be low-hanging fruit which would greatly improve access to this increasingly busy station.
Maybe now that Mike Lee is off the AT board this could happen?
It is a pity Orakei train station is classed as coastline given past proposals for development and how Central it is.
“One thing that is interesting about this network is the authors say that if station catchments were developed to the maximum of the new zoning rules, they could accommodate 1 million more people. That’s more than all of Auckland’s expected growth for the next 30 years.”
a) Remove the vehicle driver subsidies
b) remove the greenfields development subsidies
c) Add PnR where appropriate at RTN stations
and a significant amount of the growth could occur around the RTN stations.
“c) Add PnR where appropriate at RTN stations”
Why use the land closest to stations to build free car parks? That sounds like a massive subsidy for car drivers.
Yeah exactly, PnR should only be on urban fringe or rural areas. Otherwise residential/commercial/office intensification should be the main player, as well as great access space.
PnR should also have a fee, otherwise feeders get underutilized and miss out on frequency increases and special vehicle lane priority. Also means rural people who actually need it are likely to miss out, as they on average are going to take longer to get there than someone in urban areas. You also get more congestion, as urban people are driving to get PT instead of walking/cycling/PT to get PT – whilst rural folk starting later in the morning are likely to just drive on by if there are limited or no spaces left.
In the game cookie clicker, you may bake many tasty cookies.
Odd that Swanson is designated as a ‘coastline’ station while it is possibly the station furthest from any sea.
All other such coastline stations are actual harbours, surrounded by water and (almost) nobody living on that water.
In the case of Swanson, there are rural areas around it with thousands of people living in it that use or would like to use the station. Should be a type D station instead.
This is a critical question to ask in our ever-evolving urban landscapes. Efficient and well-performing rapid transit stations are crucial for reducing traffic congestion, improving air quality, and promoting sustainable urban development. I’m eager to delve into the findings of this study to understand how our transit stations are faring and how we can work together to enhance their performance for the benefit of our communities
It is unfortunate. Orakei train station is considered coastal due to its central location and previous construction projects.