Most Saturdays we dig into the archives. This post by Matt was originally published in October 2014.
The Herald on Sunday are celebrating their 10th birthday by looking at how things were 10 years ago so I thought I’d do the same by from a transport/urban slant.
Population
Just over 1.3 million people lived in Auckland compared to today which is pushing towards 1.6 million. The area with the strongest population growth over the last decade has been in the CBD with last year’s census showing that over 29,000 are now living in the area, up by approximately 14,000 people and which is ahead of earlier estimates.
Governance
We’ve seen huge changes in the governance is Auckland with the 8 former councils (7 territorial councils and the regional council) merged into a single body. This has also seen the creation of Auckland Transport to manage all transport across the region. On the whole I think both the council and AT have been relatively successful and will be more so now that they’re really starting to get through the issues of combining and prioritising the multitude of legacy plans and ideas.
Public Transport
A decade ago Britomart had only been opened for a year and there was no Northern Busway and even projects like double tracking the western line or electrification of the rail network were just pipe dreams. Bus frequencies even on the busiest routes left a lot to be desired, especially off peak. Overall Aucklanders made around 52 million trips on PT (approx 39 trips per person).
Today the usage PT has seen significant growth now up to 73 million trips (47 trips per person) and we are on the cusp of even greater growth thanks to a handful of projects that vastly improve services (electrification, new network, integrated fares etc.).


Private Transport
While there has been investment in PT over the last decade it pales in comparison to the investment in the roading network. On the state highway network alone we’ve had the following projects completed.
- Central Motorway Junction Upgrade
- SH18 Upper harbour Highway and duplicated upper harbour bridge
- SH20 Mt Roskill extension
- SH20 Manukau Harbour Crossing
- SH20 Manukau connection
- SH18 Hobsonville Deviation
- Significant progress on the Waterview Connection and the widening and upgrade of SH16 and its interchanges.
- Strengthening of the Harbour Bridge clip-ons
On top of that there has been numerous local road upgrades. All up more than $5 billion has been spent on new or upgraded roads in the region and that doesn’t maintenance or operations costs. Since 2004 the number of kilometres travelled (VKT) on Auckland’s roads has increased from close to 11.1 billion km to just over 12.7 billion km in 2013, an increase of about 15% however crucially that’s about the same as population growth and so on a per capita basis vehicle travel has remained virtually flat.

Data from the NZTA shows that the areas where vehicle volumes are growing strongly are typically the areas that have recently been upgraded, inducing additional trips. In many other areas traffic volumes have been flat or even declined. For example on average fewer vehicles cross the Harbour Bridge now than they did in 2004.

Wynyard Quarter
This and many of the other changes could fit into a didn’t exist 5 years ago category if I had one. North Wharf which represents the first stage in the redevelopment of the Wynyard Quarter was only opened 3 years ago just before the Rugby World Cup. The area has seen a colossal amount of change from an area dedicated to the storage of bulk liquids and servicing the marine industry into a successful people space that people want to visit. The redevelopment has been so successful it’s won numerous international awards including two just a few weeks ago.
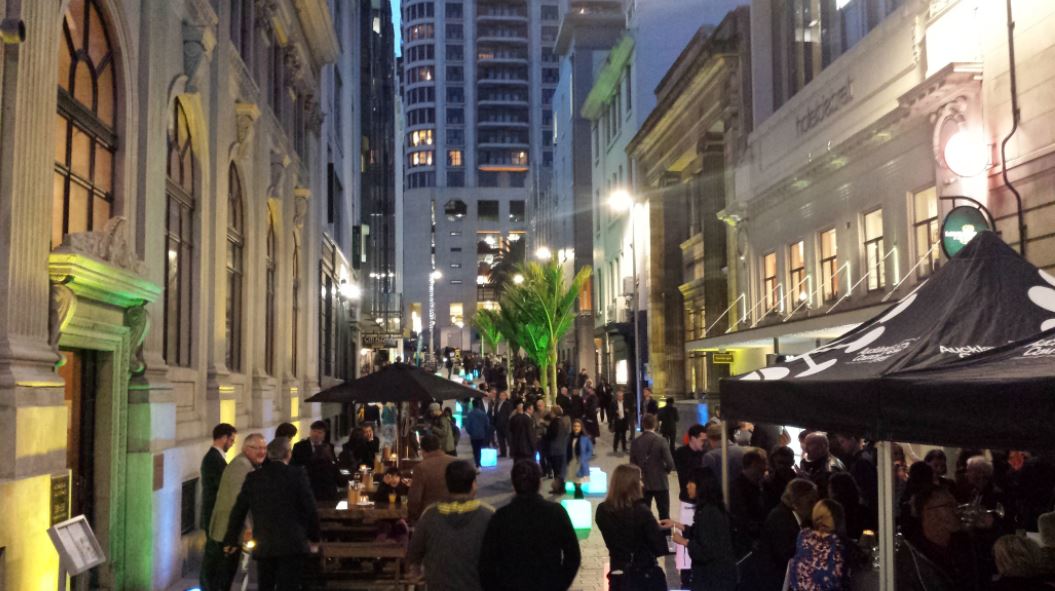
Shared Spaces
Like the Wynyard Quarter the shared spaces opened just before the RWC but they already feel like they’ve been part of Auckland’s fabric for much longer. We now have shared spaces on Elliot St, Federal St, Fort St (and surrounds), Lorne St outside the library and O’Connell St. Not only do these shared spaces look much better, they’ve also been incredibly successful in other ways. For example as of 2012, spending on hospitality in Fort St had increased by a staggering 400% compared with before the upgrade. Shared spaces have also started to be seen in other locations outside the CBD.

Improved Built Environment
The improvements to the city haven’t just been to the streets but we’re also starting to see improvements to the built environment. The internationally award winning renovation and extension to the Auckland Art Gallery is a fantastic example

This is of course far from an exhaustive list of the changes that have occurred in Auckland over the last decade but hopefully it serves to remind that the city has change substantially and for the better. This improvement has been despite constant opposition from many quarters. We are definitely on a path to becoming a much more people focused city and it’s been shown that when we put our mind to it we can achieve significant change.
Tomorrow I’m going to look at what the next 10 years may hold.

 Processing...
It’s interesting to compare what you hope will happen and what did happen.
The region’s population is now 1.7 million though it fell for the first time in the year to June 2021. Southland and West Coast were the only other regions to shrink. (The estimates for the June 2022 year aren’t available yet.)
Unfortunately public transport trips were down to 41 million in the June 2022 year, 11 million fewer than in 2004 when Auckland’s population was only 1.3 million.
Will half price fares end at the same time as fossil fuel subsidies? It’s difficult to be optimistic about public transport (and transport emissions) even with 50 per cent fares.
On a positive note, you can appreciate Auckland Art Gallery just by walking past it. You can’t do that in a car.
$5 billion to do all those road projects. Now it supposedly costs $7 billion just to put some rails down dominion road.
Interesting comparison, although costs doubled over that period and are still going up. To do those projects today would be much more. Also, previous projects were within isolated designated corridors.
Dominion Rd is a living community – like Albert St used to be.
How to do a rail shutdown
https://www.governing.com/community/what-boston-learned-about-transit-planning-from-a-subway-shutdown
The bike share figures were impressive.
Fort Lane looked spectacular when it was new. These days the red neon tube is only partly lit and the lane is often filled with parked cars. It needs some love…and a direct pedestrian crossing to the other side of Custom St.
This is of course far from an exhaustive list of the changes that have occurred in Auckland over the last decade but hopefully it serves to remind that the city has change substantially and for the better.
I’m just worried that the more money spent on the upgrade, the higher the ticket price will be and people have to spend more money.
I’m constantly searching on the internet for posts that will help me. Too much is clearly to learn about this. I believe you created good quality items in Functions also. Keep working, congrats!
This is by no means an exhaustive list of the changes that have occurred in Auckland over the past decade, but it should serve as a reminder that the city has undergone significant and positive transformation.
Positive ThesisRush.com reviews drew me in, and I’m glad they did. Their service lived up to expectations, providing quality and reliable assistance. Recommended for essays.
https://scamfighter.net/review/slidepress.com
good one
erer
sdsd