Waka Kotahi recently announced the construction partners for building Ō Mahurangi Penlink, a massive new $830 million, 7 km road through farmland and coastal environment to the Whangaparāoa Peninsula. This comes after the government gave their final approval to the project at the start of the month.

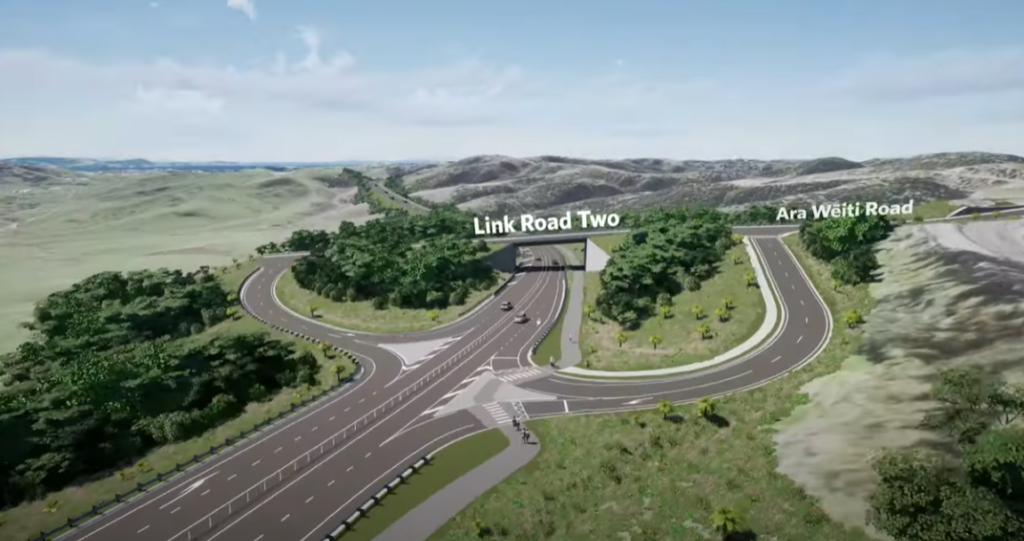
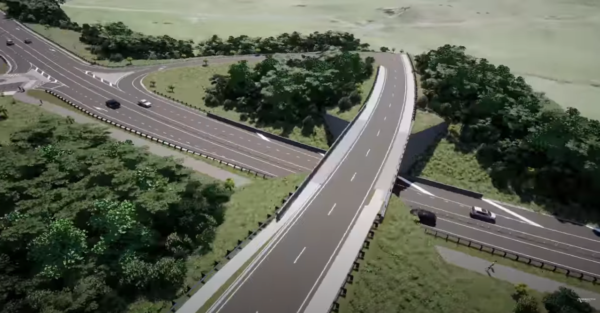
The biggest and most visible change from earlier designs is to the bridge spanning the Weiti River. The reason for the change in design is explained:
“The Penlink alliance will have a strong focus on reducing construction emissions, with a minimum reduction target of 10 percent and a stretch goal of more than 20 percent,” said Mr Kinvig.
“Waka Kotahi identified that the Wēiti River Crossing would be the largest single contributor to Penlink’s embodied emissions, so exploring innovative solutions and ways to reduce its carbon footprint was a strong focus for the alliance during the procurement process.”
During the tendering process the alliance refined the design which now delivers significant improvements from the original bridge, including reducing the number of piers in the Wēiti River, from three to two. This reduces the impact on the marine environment and allows clearer views and passage through the navigation channel.
Construction methodologies have been improved, including a reduction in temporary staging which help to minimise greenhouse gas emissions. A lowered entrance to the crossing will better fit with the landscape, enabling 235 metres to be trimmed off the overall crossing, reducing the amount of steel and concrete required.
A cable supported crossing reduces the amount of concrete required, significantly reducing construction emissions and the northern pier has also been moved away from the coastal cliff to avoid excavation into the cliff face.

For reference, this was the previous design.

They also released a video showing a “flythrough” of the Penlink design:
Safety
The road has been designed for a speed of 80km/h but that means it would not be unsurprising to have vehicles travelling at 90 or 100km/h.
A brand new road designed under Vision Zero would not mix active users with vehicles travelling faster than 30 km/hr. So these shared path crossings of the smoothly curved slip lanes is a design that does not qualify as Vision Zero:
Designing Fatalities into Penlink
A Vision Zero design would include full separation, using overbridges for people walking and cycling anywhere where drivers will be encouraged to drive at speed.
Furthermore, the project provides three interchanges along the route, one to an existing road (Duck Creek Rd) and two for new roads to service planned sprawl developments on both sides of the new highway. Notably, at least some of this development is being planned for by a company chaired by Sir Brian Roche, who is also chair of Waka Kotahi.
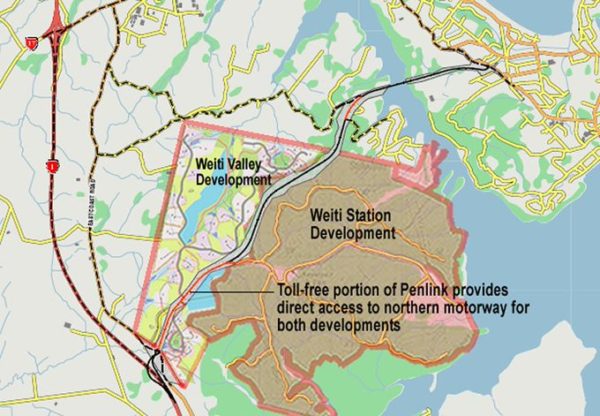
Weiti developments – Credit: David Hay, via Twitter.
Those three interchanges and the bridges that cross the highway should also provide a Vision Zero design for people walking and cycling to allow people to safely connect to/from the Penlink corridor or from one side of the corridor to other. Yet in the flythrough it looks like a miserably proportioned unseparated footpath-making-do-as-a-shared-path:
Bridge with what looks like last century footpaths. Neither protected from traffic nor wide enough for both bikes and people walking.
I guess doing it properly costs a bit more. Which raises the question: At this stage of the “Road to Zero” journey, why is money being spent on Penlink at all, if it can’t be done properly?
Climate
While Waka Kotahi appear to be trying to reduce construction emissions, the major emissions culprit will be the vehicles that use the road every day for decades to come.
In December the government released the Climate Impacts for Policy Assessment (CIPA) report for the Penlink project, and there are some serious shortcomings to it. The CIPA summary says,
Changes in enabled emissions arise from use of shorter route with reduced congestion on existing roads.
Yet evidence shows that a shorter route will induce more traffic. Over time, this traffic will grow to the extent that emissions will be higher than without the road.
Penlink is a good example of the “New Link” shown in dashed green lines, in the left scenario, below:

This diagram is from the 2020 California report, Calculating and Forecasting Induced Vehicle Miles of Travel Resulting from Highway Projects: Findings and Recommendations from an Expert Panel, and it says:
Figure 2 illustrates real cases in rural areas where changes in relative accessibility resulting from highway investments led to increased travel—in one case, despite the new route actually shortening the trip between locations.
Assuming the emissions will drop because the extra road capacity will reduce congestion, and because the route is shorter, ignores the shortcomings of the traffic modelling.
The CIPA assessment report shows that the sector’s standard methods for transport modelling were used for estimating emissions for the Penlink project. Below are some pertinent details:
Key assumptions for this analysis include SH1 widening between Albany and Silverdale in the 2048 models, along with a new rapid transit network through Dairy Flat and Silverdale West. Previous analysis on Penlink has shown that wider network effects are sensitive to assumptions on widening of SH1.
I’m sure the assumptions of widening State Highway 1 are very important to how well the model shows the network performs! This is because Penlink will induce traffic on State Highway 1. In the real world, this will lead the people of Dairy Flat and Silverdale West, stuck in extra congestion, to pressure for State Highway 1 to be widened further, which in turn will induce more traffic. It’s how the whole MOAR ROADS cycle of road expansion works.
The government’s Emissions Reductions Plan has now been released, and its requirement to reduce vehicle travel and transport emissions significantly means that widening State Highway 1 can not be considered a given. It’s very cheeky to calculate the emissions for Penlink on the assumption that a future project will “ease” the congestion that Penlink causes on State Highway 1. While there are flaws in all the assumptions involved, the emissions calculations for Penlink should have been done independently of any assumptions about whether State Highway 1 widening will happen.
The CIPA assessment also said:
Induced traffic was included, via the MSM multi-modal model responses. These include mode shift, trip re-distribution and trip re-timing
What this means is that the modelling hasn’t changed. It is still only “reassigning” how people would take their trips, ignoring all the new trips people will take (for a whole lot of reasons). In the framing that Todd Litman of the Victoria Transport Planning Institute gives here, the model used only considered the first and second effects:
Roadway expansion impacts tend to include:
- First order. Reduced congestion delay, increased traffic speeds.
- Second order. Changes in time, route, destination and mode.
- Third order. Land use changes. More dispersed, automobile-oriented development.
- Fourth order. Overall increase in automobile dependency. Degraded walking and cycling conditions (due to wider roads and increased traffic volumes), reduced public transit service (due to reduced demand and associated scale economies, sometimes called the Downs-Thomson paradox), and social stigma associated with alternative modes…
The third and fourth order effects were not included in the Penlink modelling. For example, the CIPA assessment says:
The same land use inputs were used with and without Penlink in place
Yet as the above Weiti development maps show, the land use inputs should have been very different for the scenario involving Penlink, compared to the Do Minimum scenario in which it wasn’t built. There will be much more traffic due to the sprawl the new road enables, all along its length, but the modelling simply doesn’t acknowledge this.
Altogether, these inaccuracies are large and trend in the same direction: the CIPA assessment has significantly underestimated the effect on emissions that Penlink will have.
Tolling
One thing that may help reduce the impact of induced traffic is if the route is tolled. Waka Kotahi consulted on it earlier this year and we don’t yet know the answer to it. Either way, the final decision on whether to toll the road will be up to the government and so far they’ve rejected tolling on the two roads proposed – Transmission Gully and Puhoi to Warkworth.
And there is already lots of pressure from locals for them not to toll it. Some of those appear to have supported the project being constructed as a toll road right up to the point that construction was confirmed.
The Way Forward
Whangaparāoa streets are themselves in need of a full update. Whether Penlink is built or not, safety improvements are needed throughout the peninsula. And for a fraction of the cost of Penlink, the whole of Whangaparāoa Peninsula could be turned into something children would find accessible, provided through low traffic neighbourhoods and safe paths on the main road. This would lead to enormous bike and bus ridership, providing value-for-money as well as improved wellbeing, modeshift and climate outcomes.
Essentially, there could be lots more of the things that children want:
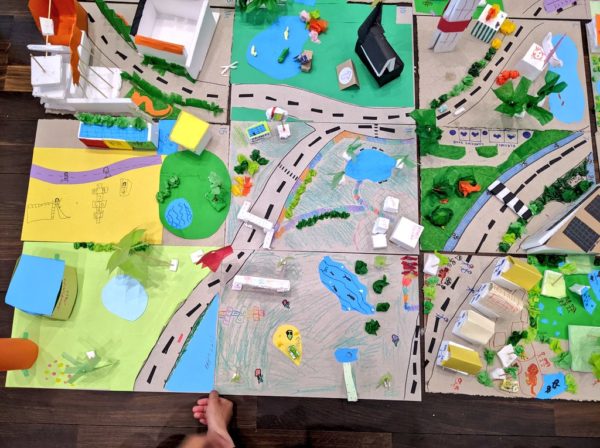
Children’s wishes include: “playgrounds, bicycle racks, public transport, solar panels, water access. Not mentioned: cars”. Credit: Sara Gregonese, via Twitter.
Like so many parts of Auckland, the unfortunate area has been hit by poor transport decisions multiple times. Penlink comes just a couple of years after the Whangaparāoa Dynamic Lane Project, a project that will induce more traffic along the peninsula. It worsened, rather than improved, safety for people on foot or bike or trying to get to the bus. Here’s the review of the design by Bike Auckland. Even worse, in an earlier business case AT came to the conclusion to build either Penlink or more lanes on Whangaparāoa Rd. It now appears we’re getting both.
So why didn’t Cabinet fund a project of low traffic neighbourhoods and safety upgrades for Whangaparāoa with our tax money, instead?
No one proposed it to them. What Council asked for, was Penlink.
The good news is that Council’s Transport Emissions Reductions Plan (TERP) should be released sometime soon, which will hopefully put Council on a pathway of making responsible requests. With luck, the TERP will clearly lay out why road expansion projects, including Penlink, undermine the transport emissions pathway that Auckland, and indeed New Zealand, needs to follow.
People throughout the city – including children, the elderly, people of different abilities, and those doing all sorts of different activities (not just commuting) – will be far better served if we weren’t wasting our taxes on highways and road expansion, but were concentrating on improving places, safety and accessibility. We can choose to provide healthier, lower-carbon, lower maintenance transport systems so our children face lower public health, carbon credit and maintenance costs. Given the economically and ecologically uncertain future they face, it seems like the least we could do for them.

 Processing...
The bridge is a much better looking design, I like that, but wow, every one of those intersections is horrible. Slip lanes at every opportunity despite them being removed from existing roads. I particularly like the last intersection (at 4.10 in the video) where the one-lane bridge traffic somehow splits into FOUR lanes at the intersection (including a lane which turns right into Cedar Reserve, despite there being no road to connect to there, wtf?)
Heidi you haven’t mentioned buses will they have to continue going around the long way.
I’m pretty sure the RPTP 2018 mentioned the Northern Express bus services terminating at “Whangaparoa Station”
So most likely for now it will go the long way and then later once infrastructure is there it will take the short route.
Thanks, I was just reading that, too. Showing bus stops in the flythrough would be a good communications idea. 🙂
The local board says No to the toll unless there are T2 or bus lanes. https://www.localmatters.co.nz/news/local-board-says-no-to-penlink-toll/
I think where they could put their efforts is in demanding what every new highway should include in its costs: making the existing road an appropriate safe, multi-modal, detuned, slower speed street.
Those slip lanes are absolutely terrifying. I don’t see how those ped crossings will pass the safety audit. I despise cycling on raised footpaths over bridges – nowhere near enough space, especially if you cycle with wobbly and distracted children. I’m shocked by this whole plan being so unaligned with the “road to zero”, financial, and carbon constraints this government claims to be working under.
Cool. A TERP. That will make it sound like we are doing something.
I wonder what the feasibility/value would be of tolling routes only for ICE vehicles. Not that electrifying cars is a full solution in itself (reduced vkt is much better), but if there are going to be cars then we should be pulling as many levers as possible to encourage them to be electric.
One of my mega concerns is this is going to absolutely demolish NX1 travel times, and provide no real corridor of value for bus services to whangaparoa directly.
My guess is that the assumed extra lanes on sh1 will be rolled into a PT project, any decent extension of bus services to whangaparoa will require a large additional spend for something that should have been designed in, and will have to pay for all the active modes inadequacies that are clearly displayed above.
And to think if various organisations including GA hadn’t been so anti this project, it could’ve been built several years ago for less than half the cost! The delays coupled with today’s massive cost increases make this an expensive project.
GA needs to keep this in mind for various other projects.
So the induced traffic could be swamping our streets already? No thanks.
Do you live on the Peninsular? I did as a kid, the traffic was one of the reasons why my family left, we had been waiting for Penlink for decades, it never came so my parents moved.
Heidi spent half the post explaining why there will be more traffic not less, did you skip that part?
At the very least, in 10 years the new developments that rely on this will be built out, the NZTA chair will have ensure that and made a timely exit. Penlink will be totally saturated with traffic. Only difference is now more people will have moved to / built in Whangaparaoa on the back of a few years of good traffic. There will be even more traffic than before. Especially local streets.
I don’t think her assumptions are credible, there is a finite number of people living on the Peninsular, where is the additional induced demand coming from? Its the same number of people travelling, it just splits, people heading towards Orewa will continue to use the existing road, people heading South will use the new link. Maybe a few of the people who use the ferry will transition to road, those numbers will be small.
The new subdivisions around Stillwater are going to be built anyway regardless of Penlink or no Penlink. For the people living on the Peninsular Penlink is what they have been wanting for a long as I can remember.
It’s pretty simple, there is currently congestion because there is more demand from people to drive at the same time than there is capacity for in the road space. That’s the definition of congestion. But nonetheless many people are willing to queue up and join the traffic and wait, while others leave extra early or defer a trip until later in the day, or forgo one completely if it’s not worth the hassle.
Adding a lane each way on a new road adds capacity off the peninsula, but that capacity will rapidly fill up because there is already more demand than capacity, I’ll get eaten up within a few months as people change when or where they drive to suit the new capacity available, people leave home half an hour later, or take a job in Albany or town instead of silverdale.
The peak traffic might start a bit later and thin out a bit earlier, but the peak will be exactly as bad as people are willing to put up with today.
but that’s got nothing to do with induced demand. induced demand, at least referred to by most objective sources, is negligible at best.
“credible” “objective”
The evidence is clear that vkt/capita changes in response to the infrastructure provided. GA have written plenty of posts about induced demand, quoting sources that are credible, objective and comprehensive.
Could you please provide these sources that support your claims otherwise?
There are not a finite number of people living on the peninsula. As soon as trip times improve then there will be far more building going on.
But that’s also not the whole picture. People will move or pick jobs based on the accessibility of those houses or jobs. As people move out or die then those homes are vastly more likely to be picked up by someone who commutes to the city and would otherwise have lived elsewhere. And when penlink opens, someone from the peninsula might broaden their job pool and switch jobs. Only to find in a few years those benefits are gone again and they are forced downgrade.
Even if there were the same number of people, the transport needs of that set of people can be vastly different depending on what options are available / chosen.
People have been waiting for penlink primarily because they’ve been mislead, the inevitability of the return of the old / worse traffic conditions is not made clear. And as a result no planning or money has gone into the only viable solution, higher capacity modes built in parallel to absorb the growth.
Report directly states: “The same land use inputs were used with and without Penlink in place”
When this is clearly not the case. You don’t have to be an expert to see assuming land use changes will stay the same regardless of a transport project going through is a falsehood.
Transport projects almost by definition change land uses and they will in this case, in a big way.
@Heidi… Please provide sources to back up your statements, to comply with user guidelines, and please use one username – not @someone else’s.
Lol weak argument.
Greater Auckland shouldn’t criticise bad projects because they’re going to happen anyway? Because the project could never be better?
On top of that cost price inflation is not inevitable. There needs to be a serious investigation from the govt into why construction costs have been inflating at much higher rates than general inflation. Building something today should cost the same as building it tomorrow, inflation adjusted. Not double the price for one of the worst active modes – interchange integrations I’ve ever seen.
Well, higher building standards are needed in New Zealand and contribute significantly to higher building costs. Road design (include proper cycleway, PT lane, ..) also improves slowly with the disadvantage of higher costs. And finally, probably most importantly, supply shortages. Wood is currently rare internationally, supply chains are still affected by Covid and the war in Ukraine etc. pp.
Lol, a 3m wide concrete path somehow turns projects into some of the most expensive roadways in the world (for their type). Nah, we’re getting screwed, the standard excuses don’t add up any more. There are systemic problems, we need a royal commission or something to that effect.
eg: https://twitter.com/ScootFoundation/status/1502460263911817220?s=20&t=Y_kfkWCQdqjblia81-usww
Do you really look at the north shore motorway in the morning and think, some more traffic completely dependent on this crawling speed road would be nice?
Greater Auckland advocacy delays terrible waste of money by ten years? Massive win
When is the forecasted completion date?
What’s the point of the CIPA’s if they’re not going to re-examine the assumptions and use models designed for emissions estimations?
This seems more than dubious. It seems captured.
That new development must have been in the making for a long time. The outline is an easily visible seam in the landscape.
The development company chaired by the same chairman as Waka Kotahi sounds pretty dodgy, as Pen Link only really makes sense if it is enabling sprawl development alongside. Why didn’t the govt buy all the station land for cheap and then develop itself when land values increase due to Pen Link, like they do in HK, Singapore etc.
There are 20,000 residents in the peninsula. There seem to be around 5,000 potential commuters on this route (another 2,000 or so travel toward Orewa/Silverdale). Who else is going to use it? Big box shopping centre → Silverdale. Town centre → Orewa. Beaches are right there on the peninsula.
The thing costs 830 million. I guess they will split the bill somehow? Whangaparaoa would have been an excellent place for a slice of actual quarter acre paradise. Given how expensive it is to transport people in and out.
Or wait, someone is getting a sweet deal out of developing the surrounding land? Maybe that was the point.
Also it is seems to be designed as a limited access road. So maybe it should actually be limited access. Since they are going to develop the surrounding land anyway: the best route for a cycling and walking path through this area will be more aligned with the town centres. And away from this road so you don’t have to deal with those interchanges.
Finally the motorway around Albany has been congested practically 24/7 for the last 10 years. What could possibly go wrong.
I believe that the most carbon-friendly solution (apart from not building it) is to have the road Bus Only from 7am to 7pm Monday to Friday, similar to Grafton Bridge. Then make East Coast Road the main bus route from Silverdale, connecting to the Busway at Oteha Valley Road.
If they want to develop new subdivisions around it with the access road tolled , the new residence would unlike to buy that subdivisions.
It is easier to fund that money using land sale from land sale or development contributions
The developments in that Hugh Green Group application linked are at the non-tolled end of the road, anyway. Convenient.
We can only hope the development contributions charged by the council are appropriate.
Interesting that the video shows it as a single lane both ways for most of the length but with a wire central median in an area wide enough for a third lane. To me this indicates a possibility of a future dynamic bus or T3 transit lane to match the tidal flow. I’m too busy (lazy) to read the reports on this one – does anyone more dedicated than me know if they are talking about these sorts of options?
Haven’t read the reports and I am but a member of the public, but looking at the screenshots:
That’s essentially what is “required” for new rope barrier highways. It’s fairly convenient because it makes the justification from 1 lane each way to 2 lanes each way, way easier. The marginal cost of adding another lane is low compared to the cost of the accompanying required shoulder shebang.
There are standards that roads have to be built to, so they can’t just turn the space around the wire median into a lane. The barrier is required to have a certain amount of clear space either side of it. So the only way they could turn it into a lane is to not have a barrier at all – something that would be impossible to justify on safety grounds.
Sweet. It’s about time they started on this.
It is good news. But what’s with the stupid 80k/h speed limit?
Lowest common denominator Rose.
We’re not trying to lift standards any more. Instead we drag everybody down to the lowest standard in the name of equality or some such.
Because it doesn’t meet new safety standards for this “level” of highway @ 100km/hr.
I assume it went something this:
Politician replying to report – “800 million!!!!, this is basically the most expensive highway lane km in the word ever, go away, make it cheaper”.
Engineers go away, shave out some of the superelevation required for 100 / 110 km/hr, got rid of the grade separation for pedestrians / bikes, and then upped the price to 830 million.
Wouldn’t worry about it too much, won’t be seeing 80km/hr for much of the day anyway.
Yeah it will. It’ll see the max limit for 70-80% of the time like most roads.
Penlink sounds like a prison shuttle service
This idea has ALWAYS failed to address the real issue, whish is the congestion caused by all the traffic lights and merging traffic at Arkles Bay/ Whangaparaoa Town center.
Needs vehicle layover spots, especially by the bridge and forest
$119M/km for a 2 lane 80km/h road through a rural area…
Feels like another East-West link.
How long before its surrounded by sprawl and gets widened?
I’d like to see a campaign for raised tables where the cycle lanes cross the access roads.
zebra crossing at highway on/off ramp? what?
Why is this a road not a rapid rail link?
+1
‘The good news is that Council’s Transport Emissions Reductions Plan (TERP) should be released sometime soon, which will hopefully put Council on a pathway of making responsible requests. With luck, the TERP will clearly lay out why road expansion projects, including Penlink, undermine the transport emissions pathway that Auckland, and indeed New Zealand, needs to follow.’
Are we sure that the TERP will be the document that highlights the positive correlation between road expansion and higher emissions? If so hopefully it will be on the front page bold, underlined and in huge font. It seems to me that those in high leadership positions in NZ all still believe these are negatively correlated. Continued use of statements from leaders and in recent other documents like ‘Changes in enabled emissions arise from use of shorter route with reduced congestion on existing roads’ doesn’t given me hope. Proof will be in the pudding I guess.
Great question, Brian! I guess time will tell.
There are a few teams within Council, AT, MoT, and WK that are clearly doing progressive work, and in whom I place great trust. From the presentations given by TERP so far, it seems that this is one of the teams that understands that correlation and what needs to be done to bring us the transport transformation we need.
As to whether the TERP document will highlight this, hmmm. I don’t know. I wonder what pressures the team is under to conform to stale ideology.
One thing that has been buoying my hopes is that Councillors from different parts of the political spectrum seem to be more boldly expressing their understanding about transport transformation and urban repair. Angela Dalton, Bill Cashmore, Paul Young, are all doing good work, as well as the obvious Pippa Coom, Richard Hills, Josephine Bartley, Chris Darby, Shane Henderson. I’ve probably forgotten some; sorry to those.
I’m hoping the TERG will demonstrate a unified Council that is cognisant of the public’s overwhelming desire for climate action, and that has become less fearful of, and more savvy about, the vocal minority naysayers.
This road cost needs to be fully covered by toll. Why should I in south Auckland pay for the rich to get a road to the beach?
You’d also be better off asking the same question about the wellington northern corridor. None of those projects have has a BCR over 1, meaning they are a net drain on the economy / country.
Funded from your fuel tax and GST, primarily for the benefit of wellington holidaymakers and commuters.
To whom are you referring Whida?
Affluence on the peninsula is lower than the North Shore and the former Auckland City.
The beaches on the peninsula aren’t generally the kind people go out of their way to visit (Long Bay and Orewa are nicer beaches).
Besides all that commuters from the HBC pay a heck of a lot of tax into the government coffers (both from fuel excise, but also higher GST due to the higher selling price retailers charge up that way) let alone income tax which as you mentioned is likely higher than South Auckland (but less than other parts of Auckland).
Have we learned nothing from the harbour bridge debacle? Build proper pedestrian and cycling now. It will never be cheaper than now
Such a waste of money & sad carving up of the countryside.
Regarding active modes on the bridge and being close to traffic.
A simple solution is to shift the protective barriers from the outside of the bridge to the space between footpath and the road lane. It goes against some principals of traffic safety but it is certainly cost efficient and provides protection for the pedestrians and cyclists. Shifting the barriers also reduces noise for pedestrians and allows for more open hand rails improving the aesthetic.
Yes, but that won’t resolve the situation. Take the still above with the caption “Designing Fatalities into Penlink”. Let’s trace the path of someone walking or cycling from the main shared path at the bottom of the picture, with the objective of reaching a (future) development currently shown as grass farmland in the top left of the picture.
They will first have to cross the two crossings over the high speed curves already discussed. Then, they will need to turn right and follow the footpath up to the bridge, continuing around to the left and over the bridge.
The problem is that that they will eventually need to cross over this two way ramp, which hasn’t been designed for speeds amenable to a crossing, and no crossing is shown. Barriers will prevent them from making that crossing along the straighter stretch where there is more visibility, and at whichever point along the route that happens to have a gap in the traffic from both directions and it is safest.
You are right. I don’t know where the origin of the image is from but I doubt it would be built in that format.
I believe it is a design and build so it would be upto Aurecon and the contractor to provide something compliant. (or the developer would build the interchange?).
The image is a screenshot I took from the Video NZTA provided.
When a project is a design and build, there is the scope for some problems to be ironed out by the contractor… but there’s one major problem regarding this project:
The paradigm shift that WK needs to do (and hasn’t yet done) for climate and safety, means that trying to improve a design like this for safety – or for climate – is like slapping lipstick on a pig.
If you assume that this link will be built, then the safety, placemaking, walking, cycling and public transport features should be designed first. Any driving function should be designed after and around those – and essentially be about reducing driving mode share and vkt. No amount of contractor input to improve the design can work on the project at this fundamental level. I mean, there would be very different outcomes – and it is not clear WK would support those. And the video wouldn’t look like that in the slightest. Even if it is a multi-modal link, including driving, there wouldn’t be any such sweeping curves. The distance between modes would be far greater, and there’d be Dutch-style radical slowing techniques before vehicles and other users mix in any way.
But that is a huge “if”… Proper planning would not have led to any project being developed along this alignment. We cannot meet our climate targets while we continue to use road expansion to support greenfields growth and to keep giving “speed over distance” priority to drivers. It’s fundamentally backwards.
I understand your frustration. The project started out as a roading one so there will always be a element of retrofitting but they should be able to do better. Pedestrian over or underpasses look like a simplest solution.
The graphic looks rough so I wouldn’t read into it too much. It doesn’t look like alot of time, effort or thought was put into it.
Disappointed that the present Labour govt, with its massive parliamentary majority, and with its claimed recognition of the need to stop encouraging more dependence on cars, didn’t just scrap this project. Likewise Otaki-NorthOfLevin. Despite Jacinda Ardern’s ardent words back in 2017, the govt is failing to seize its “nuclear free moment”. Stop entrapping us into yet more car-dependency. Stop building roads!
All this for only 25,000 people living on the Whangaparaoa peninsula – the sole beneficiaries of this? At $835 million that is $33,400 per person (assuming that the final cost doesn’t become $1.2+ billion as with Transmission Gully).
I am guessing there must be someone important living there. How about a rail tunnel to Wellington’s suburb of Wainuiomata (Pop. 19,500), or re-instate trams to Karori (Pop. 15,600).
If they included an underpass for the cycle-walk ways at the slip lane intersection, it would mitigate safety concerns around cars vs. pedestrians & completely solve the problem.
It would help, solving some problems at that location. It wouldn’t solve the problem I’ve discussed with Optimistic above, and many others.
The basic problem is that the protection people need to be given (under VZ) from motor vehicles travelling above 30km/hr is not just a kerb. VZ specifically says it is not just a few metres of separation either. This requires a fundamental reset to the design process. It doesn’t mean a more expensive design, if considered right at the start of the process. An entirely new road was WK’s chance to showcase how the new system works. But we’re not getting that. Instead, the change is being resisted.
This is madness. Waka Kotahi, spend our money on restoring and expanding NZ’s rail network.
Start tolling from where this waste of money joins the highway – call the freeloading developers’ bluff.
The bridge design is so adorable. This new development project will surely recolonized the transport system. If Govt approve this project.