This is a guest post by sustainable transport and accessibility advocate Tim Adriaansen
Following the Liberate the Lane rally on May 30th last year, Transport Minister Michael Wood wrote to Waka Kotahi Chair Brian Roche, requesting the transport agency investigate options to trial walking and cycling across the Auckland Harbour Bridge.
We continue to recognise the importance of better pedestrian and cycling access across the Waitematā. Given any trials going ahead are a decision for the Waka Kotahi Board, I’d like [the] Board to seriously consider if a temporary trial could occur over the quiet summer holiday months or a long weekend if it can be done safely.
Recently Waka Kotahi released a number of documents showing the work they’ve been doing on providing walking and cycling access over the Harbour. While subsequent media coverage focussed on the price tag of potential one-off events and an inadequate ferry proposal, the information also included Waka Kotahi’s conclusion that:
Undertaking a “trial” as the Minister has requested, could set unrealistic expectations around the likelihood of a dedicated lane becoming available in the short term. Previous analysis demonstrates that unless a significant reduction in traffic demand occurs, the network is unable to support dedicated walking and cycling access on the bridge.
This post takes a look at some of those documents to assess Waka Kotahi’s claim.
Averting Risks or Hunting Ghosts?
The Auckland Harbour Bridge Shared Path Options Assessment produced by Resolve Group in August 2021 – and referred to in this post as “the Resolve report” – contains a preliminary investigation of different options for providing active travel across the Harbour Bridge. These options included 11 potential configurations of the bridge, including single and double lane reallocation, as well as “twin paths” at the outer edges of each clipon and even central path options which would be accessed via the existing Sulphur Beach underpass and Fanshawe Street.

The Resolve report sets out to understand the risks of bridge space reallocation:
Understanding the residual risks associated with each option was paramount in the production of this report, and every option has effects on AHB users, motorway and local road networks and changes to existing loading patterns of the AHB. This report did not aim to mitigate these risks, but rather, understand them for future option consideration and development.
 The Resolve report needs to be interpreted with this in mind: its purpose was simply to identify the problems, not to investigate solutions. Further, the conclusions later clarify:
Due to the high level analysis performed by this assessment, all consequences and risks presented portray a “worst case scenario” for each option.

Most of the risks identified can be dismissed or easily mitigated. These include:
- the risk of litter being dropped off the bridge (clearly this risk exists in cities all around the world, and already exists in the context of the Auckland Harbour Bridge, as vehicle passengers could discard litter out of their windows too);
- lane sizes of differing widths on the bridge (which is already the case) and;
- privacy concerns around CCTV cameras (long since overcome at public transport stations and other public venues).
No risks or worst case scenarios are presented for Option 11 (no change to the existing set up), which ignores that the lack of active travel options over the bridge poses climate, health, environment, resilience and safety risks, as well as accessibility and equity issues.
The Resolve report concludes
All options carry some residual risks, however most of these risks can be mitigated to reduce likelihood and/or consequence to acceptable levels.
Despite these conclusions, an internal Waka Kotahi paper subsequently presented to the organisation’s Investment and Delivery Committee on November 23 (“the I&D Paper”), states that
the only viable option, that would not create operational or structural issues or cause significant traffic congestion (without a large mode shift) would be temporary access arrangements
that is to say, Sunday-only events.

It’s worth highlighting here that both Mode Shift and Transport Choice have been absolute top priorities for Waka Kotahi under the Government Policy Statement on Transport since 2018.

It’s unclear why the Resolve report concludes that all options are possible with risk mitigation, but the I&D Paper states that only weekend options are viable. As all of the risks could be mitigated, which were considered unacceptable? The I&D paper suggests three that are worthy of a closer look:
- Network impacts of traffic congestion, owing to a reduction in bridge motor vehicle capacity;
- “Operational issues”, including health and safety of motorway and shared path users;
- Load bearing capability of the clipons and the weight of suitable crash barriers.
For today’s post, we’ll look at the first of these, and explore the traffic demand modelling.
Lies, Damn Lies and Modelling
The Resolve report models traffic impacts for each possible lane configuration. A number of different models were applied, to assess the AM and PM peaks.

We need to know the inputs – the numbers assumed for each mode of travel – and how the modelling assumed people would change their behaviour if the configuration of the bridge changes. What mode shift and traffic evaporation assumptions were used?
The report suggests these numbers are included in the appendix, but this portion of the document is missing – the numbers are nowhere to be found.

Thankfully, the documents also include a June 2021 Traffic Impact Assessment (“the TIA”) conducted for NZTA by Auckland Systems Management Alliance (ASM), titled Auckland Harbour Bridge Active Mode Provision. It is in the TIA that we can review some of the numbers that fed into the modelling which underpins both reports.
Active Modes
The figures for mode shift to walking and cycling are derived from three reference points.

The first reference point comes from modelling performed by Flow Transportation Specialists (“the Flow report”) to investigate demand for walking and cycling across a potential future harbour crossing. The latest modelling suggests 5,000 pedestrians and cyclists would cross a newly constructed bridge set to open in 2028.

It is not clear, therefore, why the TIA and Resolve report modelling has used a significantly lower figure of only 1,600 daily pedestrian and cyclist trips. (The report refers to “commuter” trips but models them as happening throughout the day, not just at commuter peak hour).
The Flow report also models annual average daily trips, where (as we’ll see later on) the TIA compares weekday traffic.
When we look at existing cycling corridors like the Northwestern Path, we can see that weekday cycle counts are much higher than weekend cycle counts – by a factor of 2 or more. An annual average daily count for the bridge, then, will be much lower than a weekday average.

The TIA contains two other reference points.
An Auckland Forecasting Centre estimate of 2,000 cyclists and 500 pedestrians per day (2,500 active modes trips/day); and numbers of cyclists from the Burrard Bridge in Vancouver – 1,000 per day when it opened, and 3,300 per day by 2017.
But again, these numbers are average annual daily counts, and likely underestimate weekday usage. There’s a figure missing, too: Burrard Bridge has always had pedestrian access, which in 2018 moved approximately 2,000-3,000 people per day – giving us a reference range of 3,000-6,300 active modes trips per day from Burrard Bridge.
This means the lowest reference estimate for Auckland is 2,500; and the highest is 6,300.
It is unclear how the TIA model arrives at 1,000 to 3,000 walking and cycling trips per day as inputs for modelling.
Public Transport
For Public Transport modelling, it appears as though an estimate was calculated with the Macro Strategic Model, the output was regarded as “counterintuitive”, and the numbers subsequently used bear little relevance to the source material.

The MSM output for 7-lane options (presumably in response to differences in congestion) suggests that nearly six times as many people will catch public transport home in the evening as will have taken it into work that morning.
The discrepancy is noted, but no other modelling or working is presented, and four different mode shift figures are eventually utilised: 2,000; 4,000; 7,000 and 11,000 people shift from their car to public transport daily.
Changing Trips: New Routes, New Times of Day, and Traffic Evaporation
The Resolve report identifies that
some customers affected will choose to modify their trip behaviour to avoid congestion and delays. This could include choosing an alternative route… retiming their trip… cycling or walking… utilising public transport, undertaking a different trip… or cancelling their trip altogether.

These changes can have positive impacts on the wider network.
The TIA uses two different models – MSM and NCI SATURN – to estimate the number of vehicles which will take an alternative route, and arrives at a vehicles per hour range from fewer than 100 (based on a 7-lane configuration) through to 650 (based on a 6-lane configuration).

However, no estimates were given for how many trips across the harbour people shifted to other times of day, replaced with more local trips, or didn’t make altogether.
The Results of the Modelling
The Traffic Impact Assessment contains a table representing 4 different demand models:
- 7-lane option, low demand reduction (i.e. a low level of mode-shift)
- 7-lane option, high demand reduction (i.e. a high level of mode-shift)
- 6-lane option, low demand reduction
- 6-lane option, high demand reduction

Of particular note here are the peak hour numbers. The table shows that of 1,000 active modes trips, only 42 (or 1/24th) will be made at peak hour. This number suggests the model assumes roughly as many people will be cycling the bridge at each hour of the day – including in the middle of the night (this applies to all levels except level 2).
The vehicle re-routing is interesting, too, as the majority of vehicle re-routing takes place outside of peak hour. However, outside of peak times the bridge is unlikely to be at capacity and rerouting would be unnecessary.
A Preferred Option for Walking and Cycling
Of the 11 options modelled, one appears particularly realistic: Option 3 – a 7-lane configuration with the easternmost lane converted into a shared use path.
Option 3 produces low and high demand reduction models which look like this:
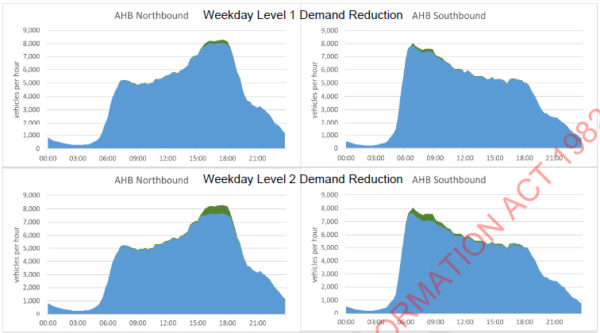
And when the report overlays weekday traffic demand to evaluate impacts (with the level 1 – low demand shift model), we get this:

All in all, the modelling suggests the difference between the available bridge capacity and remaining traffic volumes under Option 3 is fewer than 1,000 vehicles per hour.
Is this significant?
Well, if we consider that the model:
- Significantly underestimates active modes demand;
- Compares average annual daily walking and cycling trips with weekday traffic demand;
- Assumes active modes trips are equally distributed across 24 hours;
- Does not account for trips made at different times, more locally, or not taken at all;
Then it is entirely possible that a more realistic model might not only fit comfortably within the available bridge capacity, but that it may result in better traffic flow than occurs on the network presently, owing to an overall reduction in network traffic.
All models are wrong, but some are useless
There is, of course, a very robust way to get real-world data of what would happen if a single lane on the Auckland Harbour Bridge was made accessible for walking and cycling: Waka Kotahi could fulfill the Minister’s request and trial it – and with current low traffic volumes, now would be the ideal time.
With the release of the latest IPCC report into the ongoing and worsening effects of climate change, by far the greatest risk would be failing to take advantage of every opportunity to promote mode shift to sustainable, healthy transport.
Header image credit: Nabulen Photographer

 Processing...
So much time and effort wasted on the bridge when there’s no cycle infrastructure in most of our town centres and suburbs to support short daily local daily trips.
There is lots of time and effort wasted on designing and redesigning cycle infrastructure in our town centres and suburbs, too. In neither case has the level of time and effort any thing to do with the technical difficulties or the importance of the project in the network.
And locally we also waste lots of time and energy fighting officials and councils to get safe cycling and walking networks rolled out. We seem to live in parallel universes these days. One strand of news and reports talks about climate change, need for modeshift, Road to Zero, reducing obesity etc. Yet, the dominant universe makes it extremely difficult to make any changes.
The lack of a connection across the Harbour is the biggest gap in this city’s walking and cycling networks. It absolutely should be a focus.
Did you feel the same way about Christine Fletcher’s Britomart Train Station? Why do a flagship project when the rest of the rail service was so poor – or is it all part of a bigger picture?..
Conclusion: it’s not that they can’t do it or that it wouldn’t work; it’s that they don’t want to do it, as has been the case all along. They are using spurious modelling to obfuscate. And they don’t take their climate or mode-shift responsibilities seriously. Agree completely that with the current Omicron surge, motor vehicle volumes are likely to be lower and as such this is a great time to trial. Disappointing that WT is showing no vision or dexterity here.
AH! But you haven’t considered, “Because of a reduction in staff number because of their need to isolate, WK doesn’t have the capacity to undertake the experiment at this time”
In short there needs to be a Top down reassessment of of all staff within WK before they will change there blinker focus of non active transport modes.
The demand graphs with the tiny little frostings of affected traffic on the top! It’s not Waka Kotahi’s role to serve every last motorist but deny people the ability to walk and cycle. This is just mode biased. Also, incredibly ignorant, given that in other cities, pulling far more capacity from major roads hasn’t resulted in chaos.
You say it’s not their job to serve every last motorist, and I say the same.
But, Waka Kotahi believe that it is, with every fibre of their being.
Given in our city pulling up major roads / intersections hasn’t resulted in chaos (CRL).
A story as old as time “carmageddon” is hyped for months, and…. nothing happens. Why do people keep getting sucked in?
This is a great post, thanks for digging into the details. It definitely seems like some senior managers at Waka Kotahi just don’t want to touch a millimeter of roadspace, regardless of any analysis showing that it can be done with minimal impacts.
I hope the Minister realises that progress towards his big transport goals will be impossible until these people are moved on.
It is such a critical missing link in Auckland bike infrastructure. It’s so frustrating to see WK working backward for starting point of “no” with useless numbers like this.
The reason they don’t want a trial is even more clear now.
Ever heard the saying “you can lead a horse to water but you can’t make him drink”?
Adapt it to travel: You can lead a person to public transport/cycling/walking but you can’t make him use those options. Fortunately, for the moment anyway, we have the right to do what we want, not what lobbyists want us to do
Except in this case there is no water for said horse to drink.
This is more like “Sometimes the horse is really thirsty, but the farm owner will divert all the water to the cows, despite them having a river in their own paddock.”
But we don’t lead people to public transport/cycling/walking, we do almost everything in our power to lead them to driving.
This is utter nonsense Christopher. You literally can’t walk or cycle across the Harbour – that’s the whole point!
We literally don’t have the right to do what we want: we want to walk/cycle over the bridge! We are being forced to do what the car/oil/road construction lobbyists want which is be permanently stuck in cars.
Is that what Sir Mark Todd was doing in that video of him thrashing a horse?
I think it is pretty obvious that Transport in Auckland is not a priority for this government. Labour is perfectly happy to have things tick over as the don’t see any major spending to be a vote winner and are in no danger of being outflanked on the left by National.
It makes no difference if Wood is unable or unwilling to push WK. There is obviously to interest from the rest of the government in doing so. Cancelling a few motorways and the occasial announcement (but no serious spending) of big projects is enough for now in their mind.
Worse case they might lose a few thousand votes to the Greens from the readers of this site
This is incorrect. The govt just agreed to fund a $15b light rail line for Auckland. They are more than happy to spend a chunk of money here.
The issue is more that govt believes Waka Kotahi are acting in good faith to deliver their transport priorities, when it’s clear WK is not.
The Light rail announcement is an example. It comes 5 years late and kicks the can another few years down the road before any serious money is spent.
The funniest thing is that they concede that the reduction of lanes available for the general traffic would actually decrease the demand for travel by cars across the Harbour which is exactly the outcome we want. They say that people would also switch to public transport which again is the outcome we want.
And there is really not a better time to do it than now with lower traffic volumes. Once the drivers would get accustomed to the new reality, some would change their behaviour. Countless research from overseas has confirmed that this would most likely be the case.
It’s beyond me how they don’t want to see it. What is their goal? As much car traffic as possible?
I also acknowledge that this is a big project and cannot be done overnight contrary to a lot of smaller projects in the suburbs which really need good connections with the highway-cycleways and the town centres. Biking infrastructure, cheap and easy to implement, seems to be a problem our engineers/decision-makers cannot overcome.
So tell me, Tim, if you know: Is the problem here that the Board made a recommendation to the Minister, and based that recommendation on a biased summary of information prepared by staff? Or did the Board have enough information to see through it if they were so inclined?
Is the problem staff, or Board, or both?
Kia ora Derek,
I can’t answer that question directly, unfortunately.
The biggest leap I can see seems to be between the information presented to Waka Kotahi through reports such as the ones detailed in this post (mostly from contractors), and what is concluded in the Infrastructure and Delivery committee papers, overseen by Waka Kotahi’s General Manager of Transport Services. As described in the post, there is insufficient and/or unreliable information presented in the Resolve report for the GM of Transport Services to draw any robust conclusions. However, this does appear to have taken place.
Of course, there is a difference between a board which accepts being told that something isn’t possible, and a board which shows leadership by asking that something be made possible. Ultimately the board is responsible for ensuring the quality of advice presented to them, and seeking alternative sources of information if necessary.
We also need to be mindful of the conversations that we don’t see, and consider whether an ELT Sponsor may be set up or pressured to take the fall for a board or executive who do or do not desire a particular result.
As has been stated in other articles,this is like a turkey voting for Christmas. Any thing that reduces motorized vehicle capacity,goes against the very fibre of WK.They cannot allow a high profile piece of infrastructure to be reallocate,it would mean their life’s work to date has been meaningless,and there is no future for them,easy to see why they fight tooth and nail for status quo. A shame really, as a presumption,most would have future generations, guess work comes before family.
Lets see if WK can justify this after the result of the court case being taken by Lawyers for Climate Action right now.
So having a look through the Traffic Impact Assessment, I notice they say:
“The timeframe for carrying out this assessment was very limited, and a large number of options needed to be considered. With the AHB being such a significant strategic location, analysis is sensitive to small changes in input assumptions, in particular the assumptions around changes in traffic demand in response to increased congestion.”
They say their confidence in the delay caused by options that reallocate two lanes is low, whereas it’s higher for the one lane options. Put another way, this means there is more need for a trial of reallocating two lanes, in order to provide the sector with more local information about traffic evaporation.
Of course, analysis is not just sensitive to small changes in input assumptions, it’s sensitive to the method of analysis. And given the TIA puts a stake in the ground on the analogy that “traffic is like water in pipes” it’s pretty clear that their modelling is out of date. Worth reading, for anyone who thought the urbanists’ “traffic is not like water, it’s more like a gas” had made inroads.
It had made inroads in the 90s… The Los Angeles had an article in 97 which stated: “Formerly, the model for traffic was a “liquid,” where adding capacity relieved congestion. Now engineers are starting to see traffic as a “gas,” where traffic volume expands to fill the capacity.
Researchers at the University of California Institute for Transportation Studies recently published the results of their study on capacity expansion projects in many California cities. They found that within one year, 60% of the new capacity was consumed with new, or longer, trips. Within five years, 90% of the capacity was consumed.
Evidence from capacity reductions verifies this thinking–removing capacity reduces traffic. Collapse of the Nimitz Freeway in Oakland caused 45,000 trips a day to disappear. After the Northridge quake, and the closure of the Santa Monica and the Antelope Valley freeways, the air quality was great. And the closure of the Central and Embarcadero freeways in San Francisco resulted in less traffic.”
The quip that NZ is 30 years behind the rest of the world has a basis of truth.
It’s such a long passage about the bathtub analogy. It makes me wonder if a junior staff member wrote it in order to highlight the paradigm problem. Perhaps, forced to use out of date modelling, they ensured the description was clear enough that a politician, say, could easily identify it as the type of widely-criticised, out of date modelling that has caused our car dependent planning problems.
Maybe?
I am fascinated by the process involved in these reports.
Not having worked inside an organization like WK, it seems like posts like this that pull apart reports, the process used will always lead to ‘Yes Minister’ style outcomes.
The funding agencies requests a carefully scoped report from a consultancy that will back up their desired outcomes, then use that report like a drunk using a lamppost – not for illumination, but for support.
To find out any information about assumptions & reports or exactly what advice was given to politicians, interested parties have to dig around and fire information requests. Secrecy here seems to be entrenched, but why, given little to no commercial sensitivity?
To make change, I believe the minister and staff need to use the ‘Request for Comment’ (RFC) approach. Publish any papers like this for public review before being accepted as advice to minister.
Regardless of any pressure groups or bias, having assumptions like simply dividing the average daily number of users by hours is objectively wrong. If I had written a report like this in my job, I would have welcomed people correcting any mistakes before it was used to make decisions, even if made in order to simplify calculations
Actually the consultant is “selected” in that if they don’t give the right answers they won’t be employed. Not overt, but they know what side their bread is buttered
An examination of lane allocation/priority between Esmonde and Onewa might reveal where the real capacity limitation is. That, and the impacts of joining traffic at Curran Street, probably account for all the congestion and delay – not how many lanes are available on the bridge itself.
That’s been mentioned repeatedly. The congestion issue is rarely on the bridge itself. Its the approaching streets/on-ramps.
That’s probably why liberating a lane (or two) has an immaterial impact on the traffic flow across the bridge. And it need not make those approaches any worse either, if the exits for the active modes are designed right.
Of course, that all ignores the reduction in trips that would occur anyway.
It will be interesting to see while the lanes are restricted to 4 each way
WK inept, the Board and Roche in particular, negligent.
But the Minister…….he has to do something about this once and for all.
Another great piece of evidence to add to the pile of why Waka Kotahi is completely incompetent and totally out of touch with reality. Not to mention, actively working against the safety of road users while at the same time spending a lot of money on advertising Vision Zero 2050.
The entire organisation should be replaced from scratch.
There is an increasing need for a second harbour crossing. Road transport lobbiests are pushing for a road tunnel (which is supported by the National Party), which is a dangerous direction to go in. This is driven primarily by groups like the old Road Transport Forum, now renamed “Ia Aotearoa Transport New Zealand” to hide their truck lobby status. This would attract a furthe 20000 cars + into the city, so must be stopped at all costs. The problem for the truckers, is that the current harbour bridge was nor designed for the big trucks of today and, so they will be forced to go around Auckland via SH18, 16 & 20 and they don’t want to do that. We also have the problem of 11 tonne axle loading buses crossing this old bridge. If left to cars and light vehicles, howver, it will last for many decades to come. My suggestion is to restrict the next tunneled harbour crossing to a rail only tunnel. However, there could be a buses only new bridge (with a cycle way) built alongside the current bridge with just three lanes (two sothbound until midday, there after two lanes northbound). It is possible that trucks could use this bridge, but they must be tolled. Everyone is happy. I think the new bridge needs to be built soon, to save damage to the current one.
Something I first saw proposed by Ben Ross was a Wynyard-Onewa Rd busway and active mode bridge built by 2025-2030, with the bus lanes able to be converted to light rail or metro later.
The center lanes of the current bridge have no fatigue issues, it’s only the clip-ons. If they reorganised those center lanes so it was 3 lanes, with one way a T3 / truck lane, then that would the the truck issue solved forever. You can move a lot of heavy vehicles in a single lane.
I have been told by an engineer that the entire bridge has issues. It was never designed for the truck weights of today. The clip-ons were strengthened some time ago to handle trucks a bit better, but they are still causing ongoing damage. I think Waka Kotahi have hinted that the bridge will be closed to trucks in about 18 months and they will need to use the ring route. Hence all the politicking by the road transport advocates.
I will investigate further.
I think its really worth having these facts in the open, such a piece of infra could be an albatross around the neck for decades if it was a money sink that is not needed.
“they will need to use the ring route”
You mean the $4b motorway supposedly built as a bypass for trucks? Gasp.
Technically implementing cycle/walk/micro-mobility across the bridge is feasible:
a) add dynamic congestion tolls
b) add cycle/walk/micro-mobility facilities
If I’m reading it right, they are suggesting as one option to use 2x lanes from the centre part of the bridge? That’s just not going to fly for them. 1x lane yes and the centre part does have some benefits compared to the clipons. It would be relatively easy to secure a lane in the centre span (including the weight of barriers) and then a bridge a la the light path to get people on and off the bridge would ve fine. Would be preferable to also keep pedestrians separated from cyclists, a mezzanine level could even be built above the cycle lanes for pedestrians and would offer amazing views.
Good point that no risks were stated for the status quo option where doing nothing poses climate, health, environment, resilience and safety risks, as well as accessibility and equity issues.
Yes. And risk management in New Zealand hasn’t come up to speed on this. Our authorities still consider change to be more risky, by default, than not changing. When in fact we know that not changing poses existential risks.
“All models are wrong, but some are useless” – we have learnt that the hard way over the last 2 years!
It shouldn’t be resolved with AWHC, unless the proposal is a new PT/active mode bridge. If it is a rail tunnel, then it is not solved at all and if it is anything that involves a road crossing then it is insane
Real-world proof? https://twitter.com/pshemK/status/1498393958531022848
I rode across the bridge during the liberate the lane protest.
Best day in Auckland ever – and a fantastic opportunity to do the best ride in the City.
Its pretty crap that the opportunity to enjoy the ride or commute happens once every few years. Fantastic work Tim, but just one more for the pile of WK fighting mode-shift.
One day – Auckland will fix the huge hole in its network. Question is who’se decade.
This modelling should be reported to CPeng for engineering negligence and possibly breach of ethics because it seems so obviously wrong as to appear intentional.
https://www.newshub.co.nz/home/politics/2022/04/auckland-harbour-bridge-transport-agency-revisiting-idea-of-allocating-lanes-to-cyclists-in-future.html
It would seem like the politicians have kicked WK,s arse over their intransigence re lane reallocation.
Is there something in the water at the moment,as there seems to be a renewed energy,into “driving” change of status quo.