Anytime there’s a new government and/or minister, the associated agencies produce a Briefing to the Incoming Minister (BIM) to help them get up to speed. They also have the advantage of many policy documents in that they tend to represent advice unfiltered by political policies and promises.
The government have now released the BIMs they received following the election. I’ve had a skim look through some of the transport ones to see what stands out. I did a similar thing following the last election which is here.
For this post I’m just going to focus on the Ministry of Transport and may look to cover some of the other ones in a later post.
Like last time the Ministry of Transport have produced two BIMs, one focused on strategic decisions/considerations, which is the most interesting, and one on the wider transport system. I’ve focused mainly on the strategic one.
![]()
Compared to what I wrote in 2017, the ministry’s views and framing of the issues seems to have improved quite a bit and seem to be taking a much stronger view around issues such as the need for “more liveable cities”, climate change and safety. They also seem to have dropped the technology boosterism of things like autonomous vehicles that was so prevalent three years ago.
There are couple of key areas that stand out in the BIM that I’ll cover.
- Transport Funding
- More Liveable Cities
- Climate Change
Transport Funding
The Ministry are clearly concerned about the ability of traditional funding sources to cover the future costs of the transport system. That’s not to say that things like fuel taxes and road user charges are declining but that they’re not growing fast enough to cover all of the infrastructure we need in. In particular they note the need for rapid transit investment in many our cities. The Ministry say:
We are also working on advice on how to fund and finance the large scale urban transport projects.
These projects can be highly effective in encouraging people to use public transport, enabling them to get quickly and reliably between where they live, work and socialise, and in reducing congestion and emissions. However, these projects can also play a central role in shaping urban form and attracting development – and so their objectives go beyond the usual role for transport funding. Funding them requires innovative approaches, working across government, and sorting this out is pressing.
We are also beginning work on how you might change the way we collect revenue to fund the transport system New Zealand wants. The system works pretty well, but there are growing problems and we need to start now because deciding on a new system will take time and effort, needs extensive public engagement, and any solution needs to be implemented well.
One thing I do get concerned about is they focus discussion on needing to make sure future generations who will benefit the most from the investment, pay for it. While I am a little sympathetic to that argument, what does concern me is if it means we’re just passing on the cost to our kids to avoid having a proper conversation about taxes and other priorities.
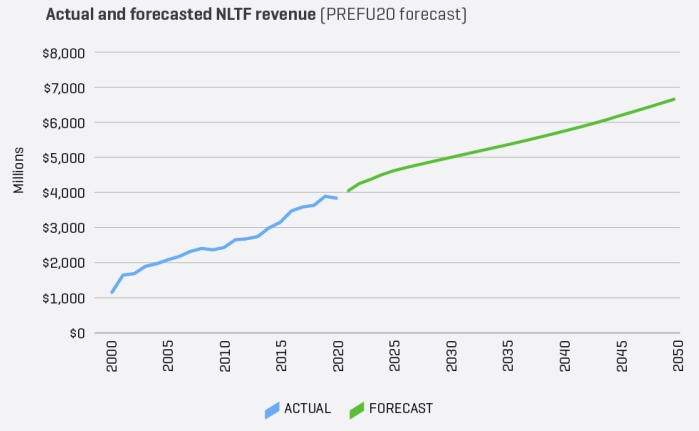
The forecast NLTF revenue, made up mostly of fuel taxes and road user charges increases but not by enough to cover what we’re expected to need
More Liveable Cities
It seems the Ministry understand / get this issue far better than they did a few years ago. While in the past talk of getting more people on to public transport or bikes had a tokenistic feel to it, it doesn’t this time. The first two key points to the topic are below
- New Zealand’s cities need more housing, to reduce carbon emissions, and improve access for people and freight while making places more liveable. The decisions you make can make a positive difference in all of these areas.
- Public transport, walking, and cycling improvements need to be prioritised to support higher-density developments and more housing. These transport modes can deliver significant health and economic benefits, ease congestion, and reduce emissions.
It even goes as far as highlighting the issues of sprawl and our planning processes which have encouraged/enabled it. For example:
To date, urban growth in New Zealand has primarily occurred through expansion. Planning constraints have made it easier to build on the edges of urban centres, where land is cheaper, instead of intensifying. Investments in urban state highways have also enabled this expansion. New greenfield developments have often failed to provide people with viable transport alternatives (other than using a car), which has resulted in people facing high transport costs to access jobs and other opportunities.
As noted earlier, the Ministry seem to get much better the role that rapid transit has to play in helping shape our cities and support growth within the existing urban area. It will be interesting to see what comes out of this strategic framework.
Planning and delivering rapid transit requires multiple agencies within central and local government to work closely together, including the Ministry of Transport, Waka Kotahi, KiwiRail, councils, and other local entities. To improve coordination between agencies, we are proposing to develop a National Rapid Transit Strategic Framework with Waka Kotahi and KiwiRail. You will receive a briefing on this by the end of the year.
The BIM dedicates a section to cycling and active travel, noting that a third of all trips are less than two kilometres. Yet on average we walk less than an hour a week and have the third highest, and still rising, adult obesity rate in the OECD due in part to a lack of physical activity. They also highlight how e-bike imports were estimated at 40,000 in 2019, up from 15,000 in 2017.
Cycling and micro-mobility modes have more potential
The transport system needs to support urban intensification by making cities easier and safer to walk and bike in. More active travel would also deliver health benefits, help to reduce carbon emissions, improve the resilience of urban transport systems (including to pandemics), and provide positive returns on investments.
Evidence consistently shows that there is significant latent demand for cycling in cities.
Many people are interested in travelling by bike, including for everyday trips like getting to school, work, or shops. Recent surges in new forms of micro-mobility, including e-bikes and e-scooters, have amplified this demand.
Successive governments have increased funding for walking and cycling over the last decade.
However, most cities are making slow progress in making streets safer and more attractive for cycling and scootering. Some flagship cycling projects and routes are making progress, but well connected cycle networks will encourage more people to bike.
The United Kingdom Government recognises the potential of cycling to transform cities by treating cycling as “a new form of mass transit”. There are a wide range of interventions that could unlock the potential of cycling and micro-mobility in cities.
The GPS is the primary way for you to influence the allocation of funding for cycling and other active modes. However, funding set aside for active modes in recent years has often not been taken up, which highlights a need for additional measures to deliver cycling infrastructure improvements.
Reducing Emissions
The comments around the need to reduce emissions is another area where The Ministry have improved a lot and are taking a much blunter tone on. They also appear to be far more open to PT and Active modes to play a larger role which is positive.
- Transport emissions are going up, while other sources of emissions have plateaued. Transport is a key sector to start making significant reductions in emissions if New Zealand is to meet climate change targets.
- New Zealand is reaching the point where harder measures will be needed for transport to start making a meaningful contribution to emissions reduction over the next three years.
- To date, policies to reduce transport emissions have focused on vehicle and freight emissions, which will be critical to achieving emissions reductions, but we also need to take a strategic and system-wide approach to reduce emissions. This would involve reducing the need to travel by vehicles and trip lengths, increasing the share of low carbon modes and fuels; and improving the efficiency of transport modes and fuels.
Later they go on about it more.
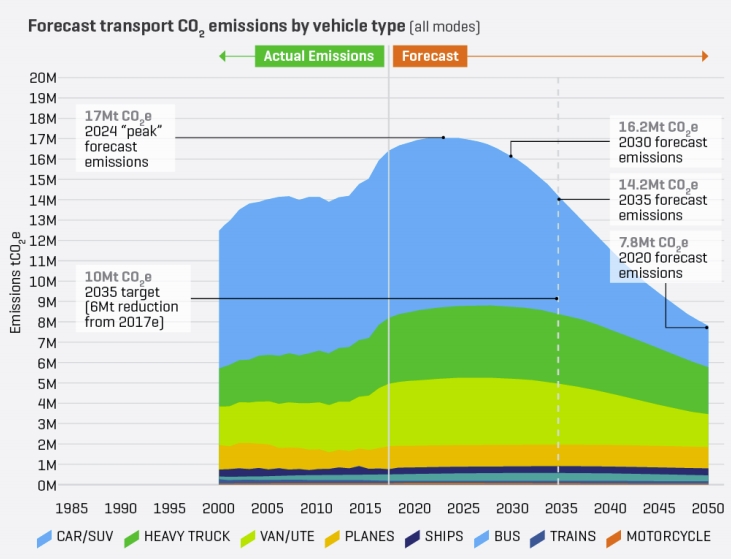
The Ministry’s base case projection forecasts road transport emissions to keep rising until around 2024, with an increase in vehicle kilometres travelled due to population and economic growth expected before COVID-19. Emissions would then plateau before slowly declining closer to 2030. The projected decline largely reflects an assumed increasing rate of EV uptake as EVs achieve price parity with conventional vehicles.
However, the Ministry say they are updating their projections as it is now considered too optimistic and that “projected emissions will not decline fast enough for transport to contribute meaningfully to New Zealand’s Paris Agreement obligations“. Their current overly optimistic forecast is shown below.
They also say “If New Zealand does not give priority to lowering transport emissions, there is a risk that investments in vehicles, infrastructure, alternative fuels, freight logistics and supply-chains will lock in higher emissions for the long term“.
While there are some positive signs there, notably, my quick skim through of the BIM from the Infrastructure Commission I noticed this graph highlighting Waka Kotahi’s capital commitments to roads and rail. In short, we’re about to spend more than ever on a pile of new roads – I was disappointed there wasn’t similar graphs for transport as a whole or for other parts of it, like PT and local roads.

There is of course a lot more in the documents from the MoT with both over 50 pages long.
As mentioned earlier, It does seem like they’re getting the issues better now, the question then becomes, what will they do about it.
Let me know if there’s anything that stands out to you that I’ve missed.

 Processing...
The forecast CO2 graph shows that for the next decade and a half it is only cars/suvs that are expected to decarbonise. Watching the car carriers coming down SH1 to Wellington that is hard to believe. And missing from the graph is international shipping and aviation. The graph shows local aviation does not decarbonise in the time shown and by the end of the period is a much bigger proportion of emissions. In terms of ideas for re-creating a low carbon public transport network that could shift those lines somewhat Heidi gave a great presentation at a recent zoom meeting. Here is a link to that recording https://www.wgtn.ac.nz/igps/webinars
There is no mention of how Waka Kotahi will stop all its multi-billion blowouts on roading.
The very idea of strategy when the track record of Waka Kotahi remaining dominated by massive road construction is just absurd.
If I see another graph about how private vehicles will rapidly decrease their emissions I will just puke. We are so deeply car addicted in Auckland-Hamilton-Tauranga that there’s in reality no changing it in any horizon.
Vehicle emissions: decreasing.
Land transport revenue: increasing steadily
Something doesn’t add up
Bingo!
Yes – that graph of NLTF does not make any sense – I don’t think they should be extrapolating it in a straight line like that. Reverse extrapolation indicates that it came from Zero about 1990 – but their forward extrapolation of $6 billion annually by 2050 is a nonsense, especially if (as Tom Jackson says above) they are planning for less diesel vehicles on the road. The graph of forecast CO2 emissions shows the number of heavy trucks growing slightly and then staying level – and if they are all (as yet to be invented) Electric-engined trucks, then it will be them that is paying an increased amount of Land Transport tax.
The future intention is to fund the NLTF directly on the basis of kilometres traveled rather than volume of petrol consumed as increases in the carbon price push up the ETS component of petrol prices and as the light vehicle fleet electrifies.
Basically the strategy is there to ignore when it suits. We’re good at things like this, just like NZ’s tourism gimmick of ‘clean and green’.
Surely people behind the scene’s need to be working on non-road projects, and pushing for the future funding commitments to not be 80-90% roading projects.
Unless of course the spend represented in that ‘road commitments graph’ also represents bus and cycling spend that is ‘on road’.
But I think I’ve got my rose-tinted googles on with that thought.
The supposed strategy seems to change when a new government is elected too. What is the point in a ministry giving advice to government if that advice is dependent on who is elected? The same thing happened with treasury advising tax cuts when National were in and now advising tax rises when Labour are in.
The answer to the climate question has been the same, everywhere, for more than a decade now.
“We’ll start doing stuff, 5 (or 10) years from now.”
How about including a section on making use of existing rail tracks. Once the Papakura to Pukekohe line is electrified, start providing similar connection services south of Pukekohe ( Pokeno, Tuakau … Hamilton), out to Waiuku & Glenbrook, and west and north past swanson.
Investigate the use of hybrid battery/electric/gas powered units that could traverse the entire network.
Even modern DMUs (CAF Civity for example) would be much better than the status quo of nothing or Te Huia which is a train with a 40 year old loco at the front. And they could be cascaded to other areas if electrification ever happens.
Once Puke is electrified, what distance will the gap be between there and the wires in Hamilton be? Surely Kiwirail could buy 2/3 battery electric locos to pull that service all the way into Britomart?
Similar services south would no longer be the realm of AT, because you know, it’s not auckland. But I agree somewhat. It might however be cheaper just to do the same route with busses for a pretty similar travel time. That’s what they’re doing out west at the moment.
My thoughts exactly,some of this is “lap dog” stuff,what would the minister like to hear,ah thats right,he likes public transport,and bike lanes,lets give him that
Thanks for the BIM for NZTA.
I searched it for “Vision zero” – no matches.
we do have a ‘Road to Zero’ (guessing that excludes eScooters on the footpath) that has an “outcomes framework” – 750 less deaths to 2030. Truly a do-nothing goal as Covid just eclipsed it!
Vision zero’s outcomes are described in its title.
Viva la revolución
That graph of emissions forecast sure shows the car/SUV large contribution is large compared to everything else.
“fares in Auckland and Wellington are high compared to international cities” – is that the first time MoT has mentioned that?