We’re almost two months since we returned to Level 1 on the government’s COVID alert system and domestic restrictions were lifted. Over the last two weeks universities have also finally returned to the physical world bringing with it many more people travelling. So I thought it was about time to take a look at how some of the key transport metrics are tracking.
Public Transport
Public Transport use in Auckland reached a post-covid high last week with an average just over 294,000 boardings a day and Wednesday peaking at 306,000. Since lockdown ended PT usage has been sitting at around 70% of the same time last year – including during school holidays. Last week that rose to about 79%.
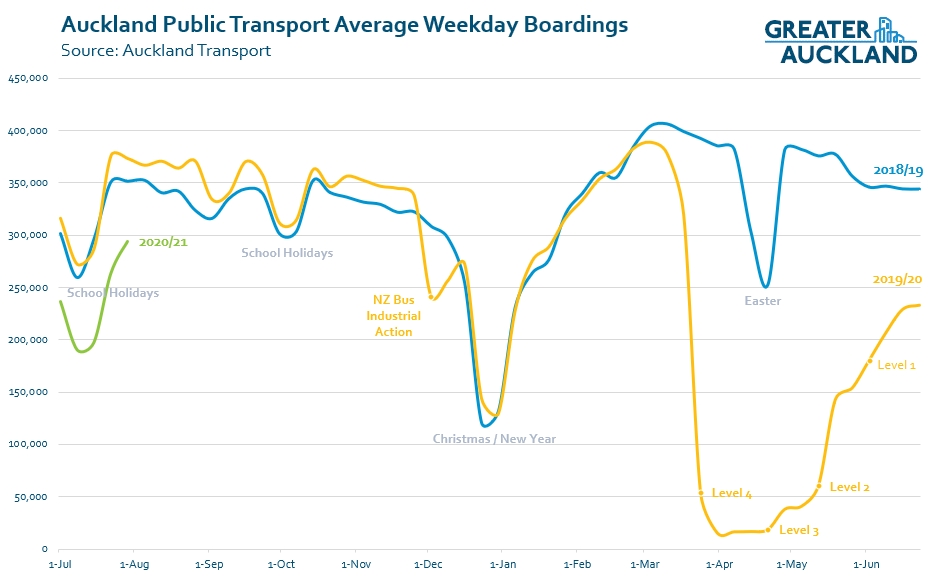
A 21% drop is and improvement on what we had seen but still represents quite a significant change. However, given the huge growth in PT we had seen in recent years, it only really represents a few years of growth. For example last week:
- Trains averaged about 63k boardings per day which is about what they were doing in late 2016 /early 2017
- Buses averaged about 223k boardings per day which equates to about early 2018.
As a result of COVID, PT use over the last 12-months has so far fallen from about 103 million to 80 million trips. My gut feel is that usage will continue to rise to maybe around 80-85% with the main difference being those working from home. If this plays out, we can likely expect the 12-month figure to bottom out at just over 70 million trips before recovering to about 90 million by this time next year.
What this also highlights to me is how for many years now AT have focused most of their public transport attention on serving city centre trips. That was been somewhat understandable as the city centre is home to the largest concentration of jobs in the region and where PT is best able to compete with driving, both on travel time and on cost (of parking). There has been somewhat of a virtuous circle occurring where PT improvements on city centre routes encourage more usage, which in turn justifies or demands further PT improvements.
But this has also meant mean other potential PT journey types have been somewhat ignored. Trips such as those to other employment centres as well as those during the inter-peak, late night and on weekends. While the new bus network certainly helped in spreading some of the love to other parts of the region, Auckland’s Climate Plan goals of trebling PT modeshare by 2030 mean we need do a lot better in making it easier to use for these types of trips.
One of the potential tools for doing that is by making it cheaper to travel off-peak, like AT did during June. Their most recent board report included this snippet on it.
30% off off-peak fares was run in June to help spread PT demand to assist with physical distancing requirements during Alert Level 3. There was a 49% increase in the number of customers travelling off-peak in the morning and a 64% increase in the evenings (compared with the week prior to campaign start).
Although I suspect some of that is related to the general COVID recovery. In this piece by Todd Niall he quotes AT as saying it achieved a 10 per cent shift from peak to off-peak travel.
Walking
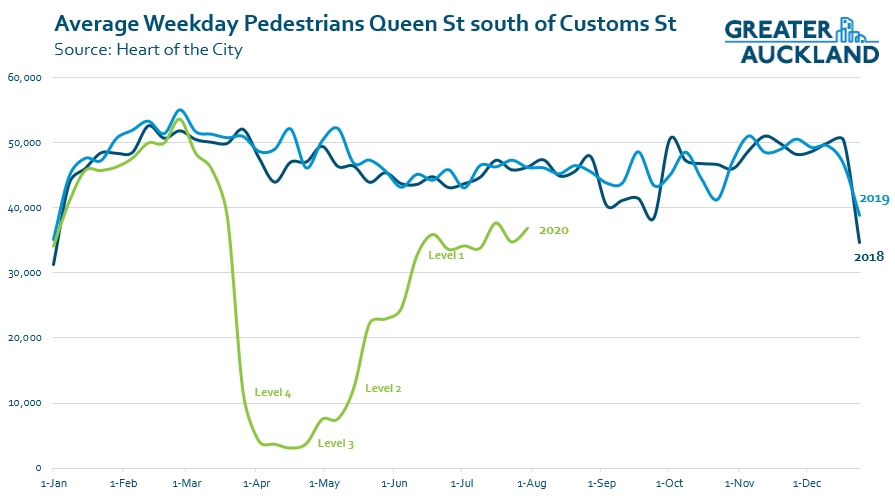
We’re seeing a similar trend when it comes to walking on Queen St. In the middle of the city, outside 210 Queen St (the Farmers building on the corner of Queen St and Victoria St), weekday pedestrian volumes are at about 77% of this time last year.

One interesting trend you can see with the graph is during school holidays the numbers go up, opposite to what happens on public transport.
Further North, just south of Customs St, across both sides of the street, numbers are back to 80% of pre-covid levels.
The recent improvements to the temporary solutions, with concrete dividers, paint, including the hot-pink bus stops, and now planters going in, Queen St is looking a lot better and feeling a lot less like a highway – though AT really do need to get the cars out. Heart of the City should be running a huge marketing campaign to celebrate this and encourage people to come and check the city out.
It’s too early yet for the July cycleway data so I haven’t included it here.
Motorways
Finally we’ve got some light and heavy traffic numbers from the NZTA and is based on traffic on SH20 between Queenstown Rd and Hillsborough Rd.
As of last week Light vehicle numbers are sitting at 93% which is down slightly from during the school holiday period.

Heavy Vehicles are bucking the trend though and are actually above where they were this time last year, up about 5%. That potentially bodes well for the economy, especially as the graph shows it’s not just a recent blip.


 Processing...
Pigs cough & sneeze into their elbow!
People with class have a handkerchief.
Pigs KEEP your clothing away from me!
One website I went to that promoted coughing into their elbow, I replied saying I always use a handkerchief, they put my reply on their website then adding saying “no handkerchief would catch all the cough, their would be some spillage” I replied saying “Well coughing into the elbow would give far more spillage than any of my standard size handkerchiefs” they never allowed my reply to their website. So my guess some people want the world to be filled with ignorant and dirty pigs, that can not handle man sized handkerchiefs.
So you came here to have a man sized whinge instead?!
Get a life John D and grow up, and learn some hygiene principals I saw one Lady on public transport just before NZ level 4 lock down
she coughed into the isle of the bus, that is because she had naked arms I get bloody sick of children all the time who parade themselves as adults
Good chat.
Isle? Waiheke perhaps?
Or maybe it was aisle.
I agree with you there a piece of cloth either 200mm or 250mm square is a lot better than those silly tissues that people leave every where or sneezing into your elbow then spreading the sloops all over the produce at that the Supermarket . At least with a hanky it can also be used as a mask and at the end of the day it can be washed and reused again .
I’d really like to see some data on where and when the 80% is. My thesis is that it’s the peak of the peak to the city that’s dropped with employment changes, while the rest of the day is back solid.
Any info on that Matt?
There will also be the impact of changes to student behaviours….
There will be fewer international students about (both at Unis and PTEs), and domestic Uni students may be taking more parts of their courses remotely/online.
That would be great; Auckland’s over-peaky service pattern is another curve we should work to flatten. To focus instead on a better all day one; for increase in quality and clarity of offer for users and the city alike. As well as to improve cost-effectiveness. In other words to increase both effectiveness and efficiency.
Very supportive of AT’s off peak discount fare trial, it would be great to see that permanent as it appears to have been very successful (did it out-performed the model?).
There sure is plenty of trucks but I wonder how full they are. Maybe they are still doing their same regular run with less freight on them. There still seems to be plenty of trains both from Auckland Port to Wuri and from Tauranga to Southdown. But I have noticed a few empty slots appearing on them. Also we don’t know how many of the containers are empty.
As construction accelerates with all the money being pumped into it I expect to see trucking increase. House building is on the increase in Papatoetoe and Mangere. Older houses are being trucked away or flattened and new townhouses are being put in their place. My observation is that build times are accelerating as each build learns from previous builds and adjacent builds. Typically the top soil is trucked away and gravel is put in its place. A constant stream of trucks are bringing in the various stages and fittings. Then truck out the fill and replace it with top soil and concrete. One site I have noticed poured the concrete driveway first. Quite smart I expect everyone will be doing it soon. Anyway plenty of trucks it will be interesting to see how it all pans out.
Personally, I think they should be preparing infrastructure for social distancing right now. The reality is that the pandemic is still growing, and growing at an ever increasing rate. Infections have doubled over the last six weeks!
At some point we will have a second wave, and be back at level 4. It would be nice to have everything ready before hand, but we need to get out of our denial that a second wave is likely.
There’s little point in trying to guess where PT figures will be a year from now. By then the world will be shut down and the global economy in a place we’ve never seen it before. That’s just realism, not pessimisim.
I agree, Geoff, in the need to be prepared. At least in being able to respond quickly if need be.
Big call. I don’t think anyone has any idea what the world will be like in a year. The virus could die down, or not. We may find a vaccine, or not.
I really hope for the best, but who knows.
Quite optimistic on Increases in PT usage I think. I think some form of WFH is here to stay for many. Also I think there will be a fair bit more unemployment before we are finished, especially in retail and hospo. Which will have a dampening effect on PT usage.