Here’s our weekly roundup
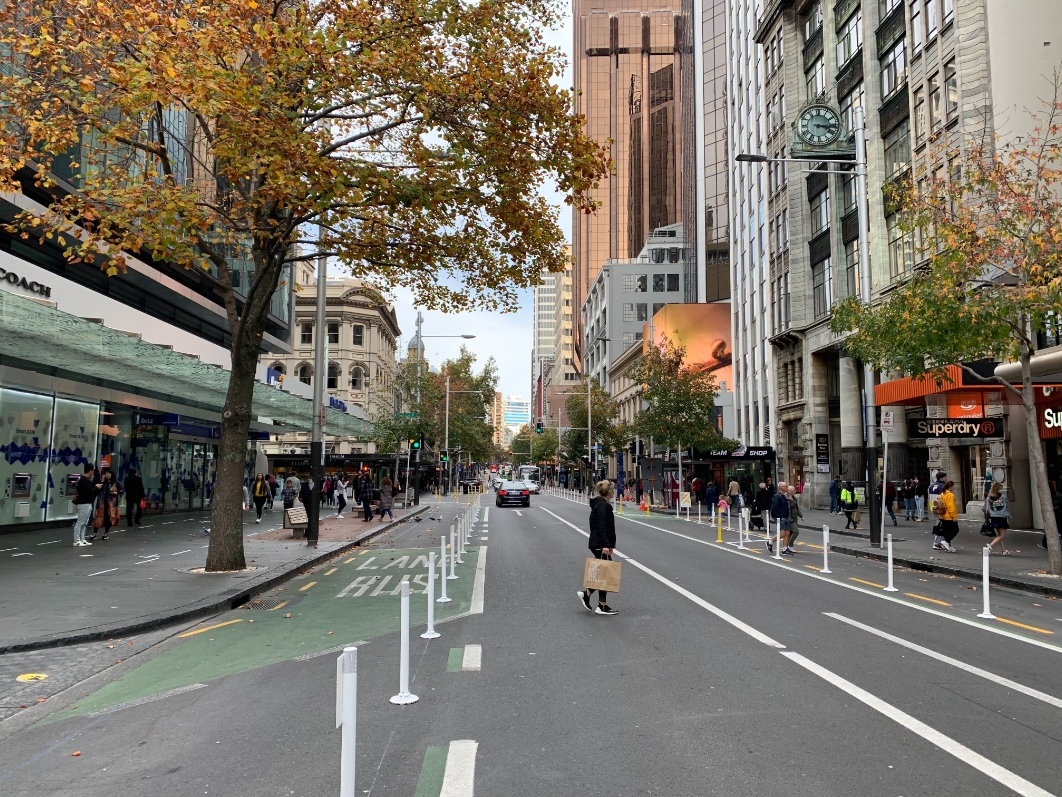
Queen St Sense
Sanity has prevailed and yesterday the Council announced that next month they’ll start piloting ‘Access for Everyone’ – the plan in the City Centre Masterplan (CCMP) to make the city more friendly for pedestrians.
The highly anticipated ‘Access for Everyone’ pilot for the Waihorotiu/Queen Street Valley will begin next month, signalling the start of pedestrian priority for the heart of Auckland.
Auckland Transport and Auckland Council will use a co-design process with Queen Street users and stakeholders to test low-cost ways to lay out the street that can be quickly adjusted, adapted, improved or removed through the process. This approach has successfully been used in High Street, where it won an award from Living Streets Aotearoa.
Access for Everyone will work towards the removal of non-essential car traffic from Queen Street. This prioritises pedestrians and frees up road space for public transport, deliveries, emergency services and for people with limited mobility.
The plan had been to start it later this year and it’s quite possible some of the initial elements in it are similar to what has already happened in response to COVID-19. The Council and Auckland Transport would have been ridiculed had they pulled the COVID works out, like some wanted, only to install it all again in a few months time.
Access for Everyone had around 82% support in the recent CCMP consultation and the Councillors have supported it too.
Bring on the car-free Queen St with the only vehicles being electric buses and bikes/scooters.
Airport Link E-Buses
On of Auckland Transport’s most important projects right now is the upgraded Puhinui interchange which will form a key part of the planned Airport to Manukau (and eventually Botany) busway. Last week Auckland Transport announced the route will be called the Airport Link and will operate with a fleet of electric buses built by Yutong. The Airport Link will run from 4am to 1am.
Mark Lambert, AT’s Executive General Manager of Integrated Networks, says the trials that AT have conducted in partnership with bus operator Go Bus and other operators over the past two years means are enabling more electric bus routes to be rolled out across the wider Auckland region. “We’re committed to doing our part in reducing carbon emissions and tackling climate change. Our trials have proven that these buses can operate for a full shift on a single charge, while providing an improved customer experience”.
The Airport Link route will travel from Manukau Bus Station to the new upgraded Puhinui train to bus Station Interchange, and then on to Auckland Airport. The frequency of 10 minute services will ensure seamless transition between bus and train modes at Puhinui and Manukau Stations and travel time between Puhinui Station and the airport will only be 10-12 minutes when new priority bus lanes are installed as part of the Southwest Gateway programme.
The Airport Link will replace the southern section of the 380 Airporter bus route, which services the airport. At the same time, a new frequent bus route, the 38 will launch on the northern section of the previous 380 route between Onehunga and the airport district.
AT say the buses have a proven range of 380-400km on a single charge and that they will be supported by plug in fast charging at Manukau Bus Station.

PT Recovery
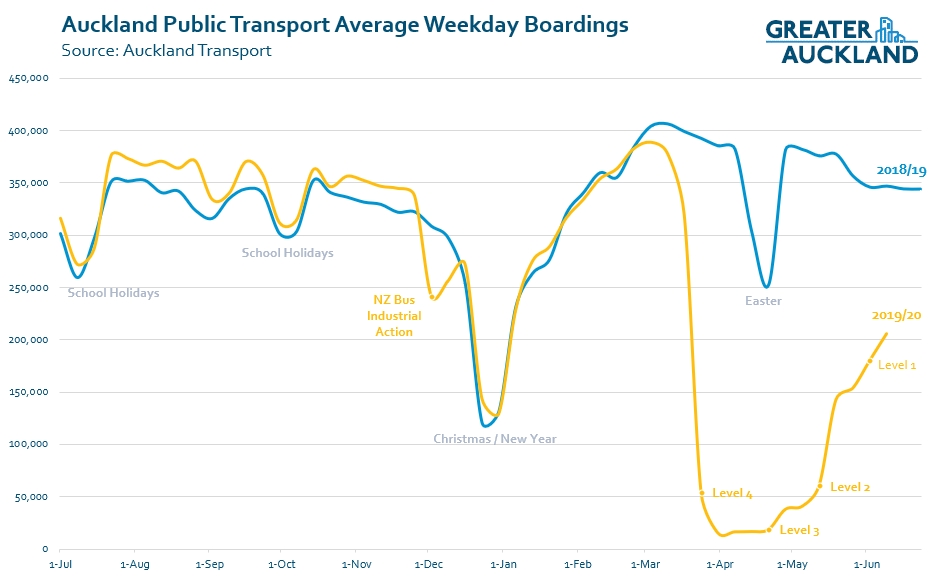
As we’ve been saying for a while now, PT use appears to be recovering faster than expected which is obviously a good thing.
Public transport was expected to be one of the hardest-hit areas in the Covid-19 recovery, but already Kiwis are returning to buses and trains at far higher rates than projected – in fact, new data shows New Zealand is leading the western world in its return to public transport
Greater Wellington Regional Council was projecting public transport revenue over the second half of 2020 to be down as much as 40 per cent on last year, forcing the council to take on as much as $20 million in debt.
But figures from just three days after Level 1 began already show bus use in Wellington above 75 per cent of 2019 rates and climbing.
In Auckland, figures show an immediate rise in users on the first day of Level 1.
Monday, June 8, the last day of Level 2, saw 178,000 passengers. The next day, that jumped to 200,000, and by the Friday there were 228,000 users.
That put Auckland Transport above 70 per cent of pre-lockdown users within just four days of Level 1.
A spokesperson said AT was expecting another boost in July with the return of university students, who make up 14 per cent of users.
From the data AT have publishes, it appears that the average weekday last week was more like 60% of normal but interestingly the weekends are returning stronger than weekdays with them up 74%.

Stats NZ Visualisation Competition
Stats NZ have launched a competition with a $5,000 prize
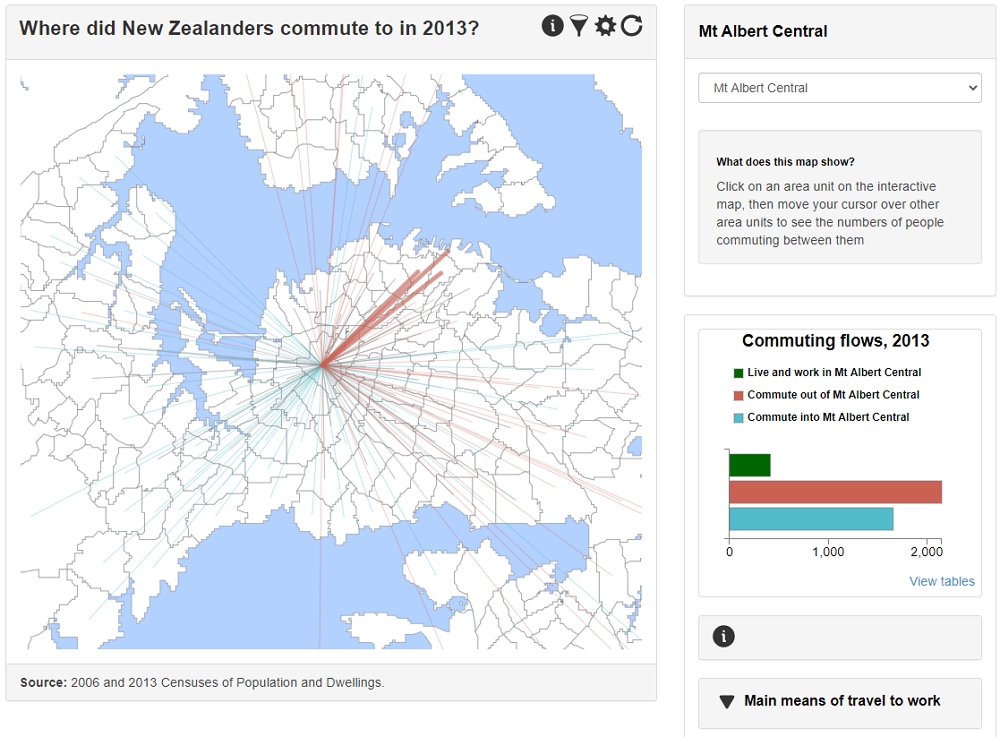
The competition encourages people to create a cool, interactive visualisation of 2018 Census data about the way people commute to work and education – this data was released today. A prize of $5,000 is on offer for the winner, and Stats NZ will promote and share the winning entry.
“This is an opportunity for data and geospatial enthusiasts to showcase their innovation and skills using 2018 Census data,” general manager social and population insights Jason Attewell said. “We’ve left this as open to the imagination as possible and we’re really excited to see what people come up with.”
The competition will run from 17 June until 15 July and is open to any New Zealand resident who isn’t an employee of Stats NZ. The winning visualisation will be announced on 29 July, and the winner will receive $5,000, and a link to their product will be placed on Stats NZ’s website and promoted through Stats NZ channels.
This visualisation is to update/replace the CommuterView tool they built with the 2013 data and they say they had planned to do it inhouse but don’t have the time to do it. Personally I feel this is a bit like asking an artist to create a free work because it will give them publicity and it’s wrong for a government agency to do that. They should pay someone to do it properly not try to crowdsource it with a cheap prize.
With that being said, if anyone wants to enter below are a few ideas I’d like to see from it – if they’re possible.
- The existing CommuterView is useful but it would be great to be able to select multiple origins and/or destinations. For example with the image above, it would be useful to be able to see how many people were going to the city centre as a whole rather than each individual area unit. This is more important now as the new Statistical Area Units have a much finer grain, especially in the city centre.
- It would be useful to be able to toggle different modes i.e. could see where bus users were travelling.
- It would be great if instead of just straight lines between areas, the most logical route from/to the centre of each area for each mode could be worked out and plotted on the map to enable users to see more realistic ‘commuter flows’.
As well as publishing the competition, they’ve also produced a series of maps for ‘the main metropolitan centre’ in each region showing where people live and where they work
The more dots there are in an area, the more people there are, and the closer together the dots are, the greater the population density. Blue dots show us where people live, while orange dots show us where people work. Due to the large variation in population counts across the main regional centres, the dot to person ratio changes for each map.
Dots representing proportions of the usually resident and employed populations are placed randomly within the SA1. As a result, dot location does not correspond to an actual location (for example, a building).
Heres Auckland’s one.

Ireland’s New Transport Budget
The leader of Ireland’s Green Party is a former bike shop owner and as part of a coalition deal he’s secured some big changes to the country’s transport budget.
Investment in cycling and walking is set to soar in the Republic of Ireland, with the Green Party securing funding of €360 million a year under the draft coalition agreement announced today with Fine Fáil and Fine Gael, equivalent to 20 per cent of the country’s transport budget.
The total budget seems similar in scale to ours and this would be like us spending about $700 million on walking and cycling annually. In addition they have committed to spending $2 on public transport infrastructure for every $1 that is spent on roads.
That’s the kind of transport leadership we need here. Instead:
Here's the picture at the beginning of the draft Government Policy Statement on land transport vs the actual allocation of funding in the document: pic.twitter.com/gAfk45FLQx
— Jonathan Coppard (@Deutschkiwi) June 17, 2020
Calgary Light Rail expansion
Calgary has a hugely successful light rail network. The two existing lines (red and blue) run through the city carry about 93 million trips annually – going to show that light rail is able to deliver significant capacity and convenience if done right. Also worth noting is that Calgary is a city smaller than Auckland in population and is lower density too.
This week the Calgary Council voted 14 to 1 to build a new line – the green line. The first stage will run from just north of the city at 16 Ave North though to Shepard in the Southeast – about 20km in total with 15 stations and in a tunnel through the city centre. It expected to cost about NZ $6.3 billion. They expect it on opening to carry about 65,000 passengers per day and in future, with the rest of the line built it is expected to carry about 240,000 people a day meaning that one line could end up carrying more people than our entire rail network does even with the CRL.

They’re also doing something we need to do better, build incrementally. The line will stop just north of the city centre where it meets the Orange MAX line (high-quality/frequency buses) on the map below. One of the reasons they state for getting the line through the city in stage one is so they can then incrementally extend the network over time.

Finally, it’s the final day to be able to submit on the Council’s emergency budget. Jump in there and support the 3.5% option.

 Processing...
Excellent report, good to see the Airport Link, and electric too.
Interesting to note that Calgary plan also appears to have a future BRT link from its LRT system for airport access…
The 9 airport electric buses are probably all that is left of plans to electrify the bus fleet. Cuts to the programme were flagged a couple of weeks ago but at least 9 is better than 3.
https://www.greaterauckland.org.nz/2020/06/02/councils-massive-budget-cut/
https://www.stuff.co.nz/auckland/121665246/auckland-council-budget-cuts-to-jobs-transport-climate-action-and-events
We’ll see how this airport busway pans out.
As for Auckland public transport ridership; people will have forgotten about COVID-19 eventually.
I have been using CommuterView since they released it I think in 2008 or maybe earlier. The original version wasn’t web based but was provided on a free CD that would spin up as you selected zones. It did allow you to select pairs of zones but you could never get actual numbers out of it. Stats NZ have this paranoia that someone will use the data to identify an individual so they do this weird rounding to multiples of 3 and just withhold very small numbers and put a letter c in the field. That is fine for tables about income etc but for transport origin-destination pairs it limits the usefulness of the data as the majority of zone pairs contain small numbers add added together these make up a significant proportion. I have learnt when requesting data runs from Stats NZ to ask for what you would like, then also ask for a more aggregated version in case the withhold too much of what you really want.
hmmm interesting thanks miffy.
Two things I’ve noticed this week:
1. In addition to the A4E announcements it is good to see that AT has also started consultation on the Lower Queen Street Pedestrian Mall to confirm what this space will be when the hole for the tunnels is filled in. https://at.govt.nz/projects-roadworks/lower-queen-street-pedestrian-mall.
2. But the thing that that makes me more sad than surprised is all the negative comments on facebook posts about the new lower speed limits. Seems we were OK with doing everything we need to do to save other peoples lives from a virus but heaps of people hate the idea of driving a little bit slower to save live other peoples lives from road crashes.
Bit late for AT to be consulting on the Lower Queen St plaza area now. It’s already been designed and the contractor has been constructing it for months. Piles have been installed to support the street lights and concrete poured for the drainage. At this stage they could only really change the superficial stuff like seating, tables, bins etc.
Better late than never – because if they don’t officially make this legal road a pedestrain mall it will instead be a shared zone and vehicles will be allowed to drive through bits of it whenever they want (and anyone with a bus could drive on all of it). The pedestrian mall seems like a better idea.
My bad I didn’t read the project page properly. I have submitted my support for the proposal and against any exemptions (because delivery and taxi drivers have a remuneration structure that incentivises dangerous driving/parking) and would encourage others to do the same.
Wonder why they’ve not made this legal change yet, given how long Council have been asking for it?
It will only be a pedestrian mall for about 20 years then it will be reopened to traffic. The history of this street is tidal for thousands of years, street for nearly a hundred, pedestrian mall for 20, street for 20 and now back to pedestrian mall. Clearly it will be pedestrian for 20, then street again until the sea level rises and it reverts to tidal.
Sadly you are only partly right. It will actually be a ped mall for the 20 years it takes them to get the light rail agreed on and installed – then it will be a transit mall for 20 years before the tide reclaims it. sigh
Yes but if we could all work together and slow global warming the urban designers might get another two 40-year cycles of street/transit mall vs pedestrianisation completed before it reverts to sea.
Lol. Thank god we’re not putting an underground in on Queen St.
Perhaps we could make it a multi-swappy-zone area where every week we get one style on a rotating basis.
On 2. I don’t understand why Auckland Transport didn’t bring in the changes recommended by the Road Safety Business Improvement Review immediately, and consulted on them a year later. And if there are any problems to doing this, why AT didn’t put that in their submission on the Setting of Speed Limits legislation.
If we’re going to have public input on something as important as safety, this is the only democratic way. It gives people a year to experience what it would be actually like before being asked which reality they prefer.
The way Auckland Transport has done it has simply allowed wave after wave of nonsensical concerns to dominate the conversation.
Given it is well-established best practice to demonstrate before consulting, Auckland Transport and Auckland Council have brought all the backlash upon themselves.
And again, it’s the vulnerable road users who end up having to bear the brunt of compromises, and it’s the unpaid advocates who have to work harder to bring sanity to the situation.
Go Calgary and Ireland! If only we could learn!
So many city centre car free street happy stories it’ll be great for us to finally have one.
So completely different to the transport developments in Auckland since the 1950s. Also very expensive parking.
“Historically, Calgary residents, particularly its influential inner city community associations, voted against proposals to build major freeways into its city centre, forcing new commuters to use transit as their numbers increased while downtown street and freeway capacity remained the same. City planners limited the number of parking spaces in the downtown core since the narrow downtown streets could not allow more traffic to park.”
Also..
” Although the light rail system was not chosen until 1976, the city planners had proactively reserved transit corridors for some form of high capacity transport during the 1960s, and the right-of-ways for the system were reserved when Calgary’s population was less than 500,000, whereas today it is well over twice that number. ”
Apart from the Avondale-Southdown designation, nothing comparable in Auckland of course.
Didn’t we dump the Eastern Highway land designations in the last five years or so, instead of using it to build a better network to connect the East?
The original Auckland tram network was built “incrementally”. Even if the first section doesn’t have huge ridership potential and only goes a few kms, at least something is happening. Something like Kumeu-Westgate just to get things moving.
+1
Building networks incrementally is the cheapest and lowest risk option. It also has a lot of other benefits like: Smaller work packages means a wider range of companies can bid on the work. Consultation for later stages is simpler because people can experience for themselves the sort of infrastructure that is planned. Learning from the first stages can be fed into the design of later stages etc.
Building things incrementally can certainly be done. NZTA has managed it with the Waikato Expressway, which is being delivered in several (7?) different sections.
I am looking forward to the electric bus link from Manukau to the Airport and I will be interested to see how the charging equipment is retrofitted into the bus station. I wonder if the buses will be charged while they are standing in the bays or will they be charged elsewhere on the site or maybe both given that there will be nine buses. Maybe there will be some more digging required to install cables. So say there is 8 100 kilowatt charges so 800 kilowatt of power. I wonder if the designers of the bus station had the foresight to install a big enough feeder into the station in the original design.
Yes that sure is a long running time for that bus route, 4am to 1am.
or support the 2.5% (or less) option!
Although will be adding support to charge for P&R regardless of rates change.
“Access For Everyone” seems an odd name for a project that seeks to replace pre-existing access for everyone and full modal choice availability, with access for slightly fewer people and removal of one mode.
It’s a mode-choice reduction project, so I’m guessing to make it seem acceptable they chose a name to make it look like it’s about increasing choice rather than reducing choice?
Can’t believe this is still a thing but…Ok Boomer
Didn’t realise cars were being banned from accessing Queen St under A4E.
Oh yeah. They’re not.
“full modal choice availability”
What full modal choice availability would that be?
You’re not here to see the clusterfuck that the cars create which make it unsafe for anyone on a bike, slow for a pedestrian, and which hold up the buses incredibly.
As a long term resident until recently of the CBD, +1 on that Heidi. I still shake my head about the retailers on High St.
As a new resident of the Panmure area, also a big problem for peds, right at the city end entrance way of the Train station where you play chicken with the cars to get to the other side of the road. I cannot believe AT didn’t see fit to put a zebra crossing there. They also didn’t see fit to make sure the street lighting on that leading from the city end entrance works, making one feel not the safest walking home after dark. Just basic stuff AT cannot get right.
I am going to talking to the local board on the above and see if it can be fixed. It should be the kind of easy thing to get done but….
All good news and interesting items this week.
Good to see the electric buses on the Airport Link & the PT recovery kicking in big time so far anyway.
It’s so ironic that we now have this Access for All in the city centre yet next to 146 Fanshawe Street ,Mansons are building 2 Degrees’ new office building and installing a new pathway up the hill to where the Spark offices are that will mean less access than there was previously because it will be all steps so those with bikes and prams etc will not be able to use this previously popular connection up/down the hill.
Yes it will be prettier than the old pathway but it won’t be better, and I thought new projects around this access for all were supposed to result in improved outcomes. Can’t believe neither AC or AT (offices right across the street!) have not made sure that making the new pathway part of the project have access for all, was a project condition.
That’s very disappointing to hear.
The ‘where we live/where we work’ maps were done with creative flair and at a very high level of detail (1 dot per person I believe) in the We Are Here atlas which was released last year.
Regarding the CommuteView tool, I plugged the 2013 data into this web-app which has some cool functionality, particularly around your first point of filtering which locations you want to view, and also allowing you to adjust parameters to change the visual style: https://flowmap.blue/18RxRi1aKytbiBL7O_lXbTx4n69JWqiGJquPGJmv7wos
I need to do the same with the 2018 SA1 data..
I don’t think it’s possible to accurately filter commuter flows by mode, because I don’t imagine you have any way of knowing if the 50 bus-riders from area X are taking the bus to the CBD, to Penrose or to Takanini. You’d have to distribute them proportionally, which may still give a helpful indication of city-wide flows, but far from ideal.
OK having just looked at the data I’ve realised I’m dead wrong on my last point – the data is richer than I thought and they do have the full range of modes for each origin-destination. . . Sweet!
Starting to see some good submissions on the budget. Hopefully Councillors will reflect on how poor was the quality of advice from the conventional economists in Council.
This one’s good: https://twitter.com/damianlight/status/1273857796795019265
In Ireland ….”The total budget seems similar in scale to ours and this would be like us spending about $700 million on walking and cycling annually. In addition they have committed to spending $2 on public transport infrastructure for every $1 that is spent on roads.”
In Auckland for last year, p19 of the AT Annual Report (https://at.govt.nz/media/1980960/at-annual-report-2019.pdf), 70% of capital expenditure was on roads and (obviously) 30% on the rest.
It always amazed me every year how the Chairman spoke of the goal to change mode share. Did that 30% include some money for the tooth fairy, because that was AT’s only chance of effecting change. Ireland has it right – it all starts with the money.
Maybe we could afford that too if we became a corrupt nation that facilitated tax evasion by some of the worlds most profitable companies. But to do that you have to have no ethics as it means a lot of poorer countries will miss out on the tax they are entitled to.
Miffy
don’t we have our own series of schemes like the tax that overseas tech companies (don’t) pay; carbon credits and overseas trusts?
I am not sure what reversing the road vs active budget percentages (currently 70/30, respectively) has to do with Ireland’s tax laws
My point is that Ireland is hardly a comparator country for New Zealand. They went through a major road building programme funded by taxes paid by other EU nations, then they transformed their country into a tax sham so the world’s most profitable corporations can trade without paying the correct level of tax to nations that desperately need it.
But aside from their total lack of ethics, if Ireland, with an area of only 70,000 sqkm, wants to spend twice as much on PT as they do on roads then good luck to them. But it has little relevance to a nation like ours with an area of 268,000 sqkm.
My question is if you are stealing the worlds taxes and only have a little country to fund then why the hell aren’t they a lot better off than they area now?
Great to see the Puhinui project going ahead, and with electric buses too. I rode one by chance last year, and was impressed with how smooth and quiet it was. The existing Papatoetoe service is not bad, and the Airport Link on the dedicated bus lanes will be fantastic.
BTW does anyone know if the Puhinui station design includes extra platform/s for regional trains from Hamilton, or at least leaves space for them…?
It’s not building the platforms for it but I understand there is space in the design for more tracks and platforms.