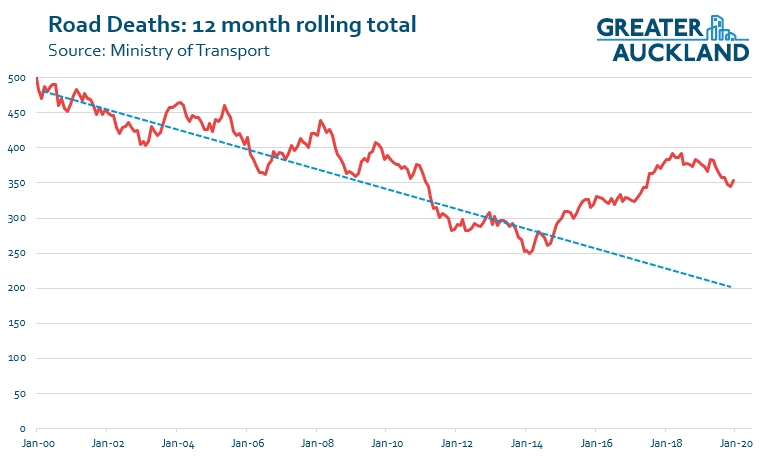
For the first time in six years, we ended the calendar year with fewer road deaths than the year before. It’s an improvement but only a small victory when you consider that 353 people, just under 1 person a day, died on our roads in 2019 and that’s still 100 more than did so in 2013.

We had been tracking even lower but December was the deadliest we’ve had in over a decade.
Here are a few graphs based on the Ministry of Transport’s reporting that break down the numbers in 2019 compared to the last few years.
Car drivers are unsurprisingly at the top of the list followed by passengers and as you can see below, two categories increased compared to 2018, motorcycle riders (53) and cyclists (13).

When we split the data by age group we can see that those between 40 and 59 were the highest age group for 2019 and a big jump from previous years. We can also see that sadly those under 15 were also growing. Note: the age bands are not consistent.

There is quite a disproportionate split when it comes to gender with significantly more males dying than women.

Road deaths occur fairly evenly between local roads and state highways, matching other measures such as vehicle kilometres travelled. But added together, almost three quarters of deaths occur on open roads as opposed to urban roads. I hope we start to see significant reductions in that state highway number over the coming years as the NZTA rolls out it’s various safety programme, such as wire rope barriers.

Finally for this breakdown, by region. As you can see below, Auckland was one of the most improved in 2019 with 40 deaths, down from 54 in 2018 and 64 in 2017, although that is still far too many. The Waikato continues to be the worst performer.

Looking at the first graph, the results do seem to be coming back down again but it’s going to take a lot of time just to get back to where we were. That got me thinking about what if we had of stayed on the trajectory we were on with reducing road deaths, what would the numbers start to look like. My guess is we would probably be sitting at about 200 deaths in 2019 and had that happened, it would have equated to about 700 fewer deaths on our roads since 2013.
Getting close to that figure is the target that has been set in the government’s new 10-year road safety strategy that was officially announced just before Christmas and is based on Vision Zero
The Government will boost investment in road safety upgrades and road policing tools as part of its new Road to Zero strategy and initial action plan launched today by Associate Minister of Transport Julie Anne Genter.
“Most fatal and serious crashes are preventable. Road to Zero follows international best practice and outlines a comprehensive list of actions that will make our roads, vehicles, speed limits and drivers safer over the next decade, said Julie Anne Genter.
“Road to Zero includes a new commitment to boost road safety investment by 25 percent to around $1 billion per year over the next decade. This additional investment will support:
- new enforcement technologies for Police, including drug testing equipment;
- 1,000 kilometres of additional median crash barriers;
- More than 1,700 kilometres of other safety treatments like roadside crash barriers and rumble strips;
- 1,500 intersection upgrades like roundabouts and raised pedestrian crossings.”
“To drive real action Road to Zero sets a target to reduce annual deaths and serious injuries by 40 percent by 2030 (compared to the 377 people killed last year).
“Meeting this target would save 750 lives and prevent 5,600 serious injuries on New Zealand roads over the next decade
“Already this Government is investing a record $1.4 billion over three years in targeted upgrades to over 3,300km of our most dangerous roads. This plan proposes greater investment in proven safety upgrades like median barriers, roundabouts and safe cycling infrastructure.
“During consultation New Zealanders sent a very clear message that they were not prepared to accept the trauma on our roads, and they want change.
“The Road to Zero action plan outlines 15 priority road safety actions for the next three years. This includes an additional action to address concerns around driving training and licensing following consultation.
“The Government has also announced today one of the priority actions – to strengthen drug driving enforcement by introducing oral fluid testing of drivers, said Julie Anne Genter.
Speaking of Vision Zero, a couple of days ago we saw this result from Oslo.
This makes me happy:
Road deaths in Oslo (pop. 673.000) in 2019:
Pedestrians: 0
Cyclists: 0
Children: 0The graph shows the reduction of road deaths since 1975.
Article in Norwegian: https://t.co/9Dv2bLZlFT
#VisionZero pic.twitter.com/MCRFK1wPJ3
— Anders Hartmann (@andershartmann) January 1, 2020
Norway adopted Vision Zero in 1999 and has seen significant reduction in the number of road deaths with just one in Oslo last year and across the entire country, no children died at all on roads, the first time that’s happened since at least WW2.

 Processing...
Norway’s population is 5.3 million. 110 people died on Norway’s roads in 2019, less than a third of the total in New Zealand. Other measures are similarly stark:
deaths per 100,000 inhabitants – 2.0 for Norway, 7.7 for NZ
deaths per billion vehicle kilometers – 2.3 for Norway, 7.8 for NZ
deaths per 10,000 vehicles – 0.3 for Norway, 0.9 for NZ
(these numbers are from https://www.itf-oecd.org/road-safety-annual-report-2019)
I have lived in both New Zealand and Norway. The really obvious differences are that the speed limits are in general 20 km/h lower than in NZ (motorways are 80/100/110 km/h, open road is 80 km/h, arterial routes are 50/60 km/h; suburbia is 30 km/h); in cities the car is not king; cars are more modern with improved safety features.
Comment removed for violating our guidelines
Are you really blaming our higher road toll on ethnic diversity? Really?
Don’t get all woke Trev, country comparisons should be apples with apples.
It happens all too frequently where outcomes in a Nordic country should be translated to NZ be it driving or education or health stats or anything. We are simply too different to suggest because it happens in Norway it should happen in NZ. You set yourself up for instant failure.
I’m not sure he was blaming, just making a point. I agree with his first sentence as I see people comparing us to Nordic countries all the time without considering the fact that a lot of our health / crime / poverty / etc stats are bad for minorities and a lot of the Nordic countries don’t have many minorities. Its not blaming the minorities, just pointing out that the data sets are different.
The claim that some ‘cultural’ (or other euphemism) factor explains our appalling road death and injury stats compared to say Norway would be much more persuasive if we enacted the same proven systems they have. Then any difference could be shown to be elsewhere. Until we actual get real with better road design, safer speeds, proper enforcement, and alternative mode investment, these differences are way more plausible as causal factors than some random’s racial theories.
Especially because otherwise Norway is a very good fit; population, topography, 1st world etc.
“We are simply too different to suggest because it happens in Norway it should happen in NZ.”
We are simply killing too many people to suggest that we shouldn’t be looking at Norway to help find a way forward.
There is no evidence that I’ve ever seen that people’s inherent ‘difference’, whatever that means, is the cause of different road outcomes over difference in environment (design), rules, and enforcement…
@Urbanista…. have you been to China or India?
It is absolute chaos on the roads there. Licenses are off a box of cornflakes, road deaths there are staggering.
But for some crazy reason they can just switch their license over to a NZ one with no test, no training etc
From NZTA’s own website, these are the only overseas licences that can be directly transferred to a local licence.
https://www.nzta.govt.nz/driver-licences/new-residents-and-visitors/converting-to-nz-driver-licence/
Australia
France
Japan
South Korea
Austria
Germany
Luxembourg
Spain
Belgium
Greece
Netherlands
Sweden
Canada
Hong Kong
Norway
Switzerland
Denmark
Ireland
Portugal
United Kingdom
Finland
Italy
South Africa
United States of America
That’s it. Everyone else needs to take a theory and practical driving test within a year of moving here. Yes AKLDUDE, even Indian and mainland Chinese drivers.
My error Roddlers, since they can drive here on holiday without any if that I thought it was the same.
So then the question becomes: Are our driving tests to such poor standards that these drivers pass? Or is it a lack of enforcement and ongoing (possibly targeted) education? Because the majority of bad driving (be it dangerous/inconsiderate/incompetent) that I have witnessed has been from drivers that clearly are more recent arrivals. One of the best examples I’ve see on a daily basis is taxis and Uber drivers jumping straight into the fast lane heading away from the airport and staying in that lane (doing 80) all the way to and through the tunnel and on to the NW motorway towards the city – a) no need for it – the middle lane also goes to the city, b) shouldn’t be in that lane – keep left unless passing. C) WTF does anyone in a car drive at 80 on the motorway in light traffic?? If you can’t do 100 there then you sure as hell can’t get close to 100 or even 80 on the open road and as such shouldn’t have a license.
@AKLdude your discrimination against immigrants shines through once again on this blog!
Any actual evidence that ‘recent arrivals’ are responsible for more accidents per capita than good old Kiwi battlers?
“To drive without a licence or even a proper one is just a way of life in NZ.”
This is the same arguments Americans use over their gun death problem. We use it for our vehicle death problem. It’s not a very compelling argument, that we should be happy to willfully ignore the rule of law when it comes to cars.
NZ definitely has more of an individual freedom culture, but I don’t think that can be explained by our ethnic diversity, it’s been around a lot longer than we have been diverse.
We have proven we can be tough and change our attitudes though. There has been a dramatic improvement in attitudes to drink driving compared with 40 years ago and to see what real enforcement is like try catching more fish than you are allowed!
Great to see Auckland numbers reducing. I have a friend who often moans about the new raised pedestrian crossings making him slow down. Good to be able to show him they’re working as intended! I also look forward to seeing the Auckland numbers continue to decline with safer speeds coming this year.
I really don’t think too much can be read into yearly road tolls. Nothing I can think of has changed in the last year that caused a drop or a rise. Certainly not policing where the thin blue line is verging on transparent. In fact, the police can probably no more be blamed than praised for road tolls rise or fall as there are too few to make a real difference.
If anything it probably comes down to increasingly safer cars (for sure), versus pure luck and or excellent medical intervention in a timely way.
Auckland seemed to get harder to get around given the heavy traffic so that probably lends itself to a less than lethal mix.
But one area both this and previous governments have failed miserably on is drivers who fail to stop for police. A number of those deaths and many serious injuries are absolutely because of that but the problem has been left solely for police to manage and it’s not working. Ministers sit impotently by and do nothing. Collins was the last to amend the Land Transport Act for this but even then it was a damp squib when thinking out of the box may save many more lives.
There appears to be a strong correlation between the death rate and number of police officers, potentially with a bit of a lag between the two due to people needing to respond to increased/decreased police presence by changing behaviour:
There’s a graph here indicating that:
– from 2002 to 2009 police numbers grew 200-400 per year, in line with declining death rate
– between 2009 and 2016 police numbers were flatlining, in line with flat lining then increasing death rate
https://www.stuff.co.nz/national/politics/89010868/live-what-vision-for-new-zealand-does-prime-minister-bill-english-hold
and in 2018 the government announced funding for an additional 1,800 officers (not sure how many are in place though) with a potential impact being seen via reduced toll in 2019.
A ton of other factors come into play as well though, bigger vehicles (utes, SUVs etc) have become more popular post-GFC and km travelled and vehicle ownership have both trended up strongly. 2019 might be the point we’re these risk factors have started to plateau somewhat and then been driven down by more police enforcement.
Yes, that makes sense.
Yes, it’s an interesting thought. Looking at the policing graph makes me rethink my post yesterday a bit.
The ongoing decline in the road toll from 2009 to 2013, while police numbers were static, might be explained by the fact that during that time there was a big increase in mobile camera enforcement. From 2009 to 2014 it almost tripled. The decline in the road toll during the 2009 to 2013 period almost looks a bit steeper than up to 2009 or so.
The increase in the road toll from 2014 onwards might be explained by the fact there was both a slight drop in police enforcement numbers and a big drop in mobile camera enforcement, with it now back down below 2010 levels.
It looks like the road policing numbers have been restored from about 2018, which may have helped in stabilising the toll.
The Road to Zero action plan talks about boosting both the mobiles camera by 25%, sign-posting the existing static cameras and installing 100 more well sign-posted ones. If that doesn’t work it may be worthwhile trialling at least one of more road policing numbers and more mobile camera enforcement, and then giving the other one a go if the first try doesn’t make much difference.
Here are the links again:
https://www.rnz.co.nz/news/national/348578/without-a-doubt-road-toll-linked-to-cuts
https://www.rnz.co.nz/news/national/406255/automobile-association-worried-drivers-feel-there-are-less-police-on-the-roads
https://www.police.govt.nz/about-us/publication/road-policing-driver-offence-data-january-2009-september-2019
Yes. And AT’s Road Safety Business Improvement Review has some good information about how increased enforcement – and a lowering of the tolerance from 10 km/hr to 6 km/hr – had an immediate effect on reducing fatalities in Victoria.
I get the feeling that most of the decreases in deaths prior to 2014 were due to cars being safer; particularly the introduction of air bags and ABS. Because road deaths were decreasing there was no political will to spend more money, slow people down, or issue more fines. This is coming back to bite now.
I really can’t think of another industry where unnecessary deaths are tolerated to such a degree. Imagine if we had 350 people dying per year from collapsing buildings – I’m sure the building code would be heavily tightened. It didn’t take long to change our gun laws recently, even though the number of gun deaths is almost insignificant compared to road deaths.
They really need to take the politics out of this issue. Give the NZTA or similar the freedom to set speed limits based on international best practices and make the NZTA responsible for every death that is occurring.
I don’t think any one factor can explain it. The introduction of rescue helicopters has no doubt helped and we have been incrementally improving our worst stretches of roads along with reducing speed limits over the years.
There has also been a significant change in our drink driving culture over the years.
Yes, internationally many countries had reducing road death numbers prior to 2014 which was in big part due to safer cars for car occupants. Since then the difference between those that have continued to reduce their deaths, like Norway, and those that have flatlined or increased slightly, like most countries, seems to have depended on whether the authorities have taken responsibility and enabled change, with the innovation and feedback of information that requires.
Not many countries have taken the same trajectory as New Zealand has. We’ll only solve this, and save people from unnecessary death, if we’re willing to actually accept that some decisions made were negligent, some were callous, some were ideological, some were miserly. But they were wrong, and they need to be changed.
Gee I wonder who was transport Minister between 2014 and 2017 and oversaw such a massive increase in the number of deaths? 700 more deaths than if the downward trend had continued is horrific.
A bit unfair I think. I can’t think of anything that Minister did that would cause the road toll to increase. Didn’t they tighten the drink drive limits in that time for example, which was supposedly going to decrease the road toll by 40.
Of course that Minister could have done other things to make the road toll decrease – but we would probably only be seeing the effects of those now.
A quick google will bring up results like:
https://www.transport.govt.nz/news/land/we-are-driving-further-and-more-than-ever-before/
showing that we are driving more and more (more vehicles, more distance travelled).
I’d say the previous transport policies (such as RONS) actively encouraged more car/truck travel instead of active modes or rail.
Completely agree. But those decisions were made well before Bridges was transport minister and before the road toll increased. In fact you could ague the blame lies with the previous Labour government as it takes a long time for PT projects to get built.
Did they make any cuts in road maintenance with the RoNS?
All stats need to be presented as a percentage of population and kilometres travelled. NZ has had significant population growth which unfortunately usually means more deaths, so difficult to compare apples with apples.
A couple of years ago when this discussion was happening there had been a 60 % increase in deaths and a 14 % increase in vkt between 2013 and 2017. Not sure where it is at now.
Previous government is absolutely responsible for at least some of the bad reversal in outcomes. They reduced enforcement, took the side of the ‘it’s just revenue gathering’ motorist lobby regarding speed and red light cameras. Without enforcement regulation is useless, the same as their Pike river attitude. One example:
https://www.rnz.co.nz/news/national/348578/without-a-doubt-road-toll-linked-to-cuts
The amount of policing seems an obvious candidate as a cause, but the drop doesn’t seem big enough on its own to explain the rise in the toll.
The police numbers are back up now:
https://www.rnz.co.nz/news/national/406255/automobile-association-worried-drivers-feel-there-are-less-police-on-the-roads
The one big change that has happened since 2014 is the drop in mobile speed camera enforcement. But it was also low in 2009 (as far back as the data goes in this source) when the toll was dropping. It’s still low:
https://www.police.govt.nz/about-us/publication/road-policing-driver-offence-data-january-2009-september-2019
I agree that sometimes using Nordic countries can have issues with ‘apples for apples’ and even if they’re comparable, it doesn’t have the same resonance as a ‘similar’ country.
Using another example, look at the experience of Ireland. Very similar country in terms of population and similar in distribution (i.e. almost identical population centered around one main city albeit in a smaller area). Its somewhat of an outlier in Europe in terms of its car dependence and focus on investment in private transport so is a more relevant example to compare to NZ.
It’d be interesting to put the two countries on a graph but numbers peaked in the 70’s at over 600 per year and level off to about 400 in 2000, similar to NZ today.
https://www.rsa.ie/en/Utility/News/2018/2017-sees-Record-Low-of-Road-Fatalities/
You would think that with rising population and rapid economic growth it would have kept rising but instead fell to 148 last year (the previous year was 142, the lowest on record!). Imagine if NZ was on a similar path?
This article tries to explain it but I don’t see how legislative changes in 2017 have much effect. My theory is the transfer of driving from rural roads to the new motorway network combined with newer cars are the reason but would be interested if anyone can find an academic article covering rather than the transport minister tacking credit
https://www.forbes.com/sites/davekeating/2019/06/24/ireland-has-reduced-road-deaths-by-31-heres-how/#2091d7e6e974
“We looked at the four main causes: speed, intoxicated driving, mobile phone use, and non-wearing of seatbelts.”
It sounds like they adopted moist of the policies that we have had for a number of years now. I’m not sure about Ireland but I was surprised how common drink driving and excessive speeding was in the UK when I was there. I think in the 70’s and 80’s our road toll was much higher than theirs, I think we have already had those gains.
I still don’t think that enforcement alone would have such a dramatic increase and he’s just talking up the actions of his government and ignoring the previous ones which (rightly or wrongly) focused on building a motorway network.
The stats in NZ in the 70’s and 80’s were similar i.e. ~600-800 per year. Even f we’ve already had those gains from seat belts etc. why is their toll so much lower with the same population?
https://www.transport.govt.nz/mot-resources/road-safety-resources/road-deaths/annual-number-of-road-deaths-historical-information/
It could be anything really. For example to significantly reduce crashes here by building motorways they would need to build an awful lot of them because we have a big country and a lot of roads. Even a full motorway between Auckland and Wellington would only make up a small percentage of trips. Maybe that is different in Ireland.
Excuse my ignorance but what happened in 2014 that made road deaths climb steep up again? E
Smartphones. Driver distraction.
And SUVs, really lethal for people outside them
+1
https://www.usatoday.com/story/money/cars/2019/02/28/pedestrian-safety-crisis-deaths-ghsa/2993321002/
Which ignores that in NA (USA/Canada), Australia and NZ, utes (pickups) outsell SUV’s by a significant margin. SUV’s also come in a large array of sizes. The diminutive Suzuki Ignis is marketed as an SUV. The increase in overall size of vehicles, along with increasing power outputs, is a better comparitive guide.
So he could have said, SUV’s and utes, really lethal for people outside them.
Good question, and the answers people have given here are a part of the picture. Cars have become more powerful. Most countries had an inflection point around then. It’s when the safety improvements in cars stopped being huge steps forward, but travel continued to increase. But our significant increases buck the trends, in an internationally-evident safety crisis that indicates much more than just these international changes. Political ideology impacted design, regulation, operations and enforcement.
When the driving environment changes, driving practice can change immediately or take a while, depending on what the change was.
There are many examples. We’ve had a change in use of speed and red light cameras. Design has encouraged a driving culture in which slowing down for a turn or for someone else is considered an imposition. Median strips have been added to get those pesky drivers wanting to turn right out of the way, so people don’t have to slow. Turning radii at corners have been increased so people don’t have to slow to make the turn. Slip lanes have been built where previously drivers had to stop for traffic lights. The “pedestrians must give way to traffic” signs have been training drivers to ignore pedestrians waiting at a location that is similar to a pedestrian crossing. The driver license test guide has required applicants to drive close to the speed limit instead of at slower speeds to match their confidence. Impatient drivers have tooted at others to speed them, so that now, drivers don’t follow the road code when passing parked cars – they drive at 45 or 55 right next to the parked cars instead of at a speed where they can react in time if a pedestrian steps out from behind the car, etc. The police have developed a culture in which keeping traffic flowing is prioritised – at events, for example, where pedestrians outnumber traffic hundreds of times to one, the traffic is still prioritised in the space.
All this has worked at a psychological level to change driving culture. But I think we can undo the harm reasonably quickly. Over the last two years, there’s been a lot of groundwork laid by the government to change things in multiple ways. I’m feeling positive we can turn things around. We certainly know which way to look for advice!
Total deaths is a metric for tabloid newspapers. Use deaths per vehicle-km-driven.
If you use total deaths, the number goes up when fuel prices go down (more driving per vehicle) or population goes up (more drivers). These factors are significantly larger year-on-year than incremental roading or policy changes.
No. The better metric is per capita, as it highlights places that provide alternatives are always safer for the population. Making it per kms driven conceals that more driving = more death and injury.
+1 again. Good point, but perhaps combing or comparing with per vehicle-km-driven is important too.
One area that we are struggling with in terms and are going backwards in, in road safety is driver distraction.
Cell phones are illegal if handheld but this is routinely ignored because you know the chances of getting caught are non-existent. You see taxis/Ubers driving around with the big phone on the windscreen to right of driver/left of the right A-pillar lit up, a Navman or similar below the mirror. Tell me concentrating on those don’t take the drivers eyes off the road.
I drove a 2019 vehicle the other day. Airbags everywhere, crumple zones, lane maintaining device, rear-end collision warning and control device, an enormously safe car to crash in, but……………., it had 23 buttons on the steering wheel, some multi-function, that control the 3 layers of information screen between the speedo and tacho telling me everything from the next service time to bar graphs of the average economy, in fact, everything you never wanted to know about economy, outside air temperature, heater settings, stereo settings, time, date, etc etc etc. But wait there is more…
The 7-inch centre display has 5 layers, stereo and Bluetooth connected apps such as Spotify, navigation, cell phone connectivity, home screen and climate control screen and that screen in itself was a study in complexity. Each function requires a precise push to activate. All screens both on the main instruments and the centre or accessible whilst the car is mobile. And the reason all this exists is so car manufacturers sell more cars but ironically talk up safety.
Align this with LED headlights that blind oncoming drivers or blind the driver you are following via their mirror and we have a perfect storm of distraction.
Tell me that is safe. You may survive the crash you caused doing anything but looking where you are going but did the other guy?
Agree. I had a crash that could have been really bad while trying to change a CD at 100 km/hr. These new distractions can’t be good.
The slap on the wrist for mobile phone use is ridiculous. It really is as serious as drinking and driving and should be treated as such. But because we all do it there is no political will to change.
Agree, and the AAA agrees too.
Fatter pillars in SUV cars to improve car roll safety has meant less visibility both of other vehicles and especially pedestrians & active mode users would be another factor.
The pillars in sedans have got a lot wider as well with side curtain airbags.
For another non-Nordic example, look at Portugal. Population of about 10 million, one large city and fairly spread out population. It reduced its road toll by 36% between 2010 and 17 https://ec.europa.eu/transport/road_safety/sites/roadsafety/files/pdf/scoreboard_2017_en.pdf
but has started to regress since then for some reason.
This article on safety in cities has some views on the national trends, I’ve never been there so don’t have a view:
“National road safety guidelines set out general but explicit goals that guide local authorities towards achieving higher safety performance on a local level. These may have contributed to a rapid drop in casualties in Portugal: 593 road fatalities were recorded in 2015, down 71% since 2000. With 5.7 fatalities per 100 000 population, the Portuguese fatality rate is now close to the EU average of 5.1
(ETSC, 2017). Naturally, other factors have contributed to this rapid decline, such as renewal of the vehicle fleet, with the benefit of new vehicle safety standards, as well as the development of a dense motorway network, a type of infrastructure that is known to be safer than other road types.”
https://www.itf-oecd.org/sites/default/files/docs/road-safety-european-cities-performance-indicators.pdf
There’s a draft national rail plan out for comment: https://transport.cwp.govt.nz/rail/the-draft-new-zealand-rail-plan
For passenger rail, Auckland and Wellington commuter rail, and Auckland-Hamilton and Wellington-Palmerston North get a mention, but not Auckland-Wellington or other possible passenger services.
Auckland > Taupo: The thing we won’t know we need until we build it.
In all seriousness I would use the hell out of a Auckland > Taupo > Ohakune/National Park service, provided it wasn’t hundreds of dollars like most of our scenic rail. Likewise a Bay of Islands service.
How many times a year would you use the hell out of that service?
I think that is the issue with any regional rail in NZ. We can’t run decent passenger rail between the 3 “big” cities and the rest are just too small. Yes the likes of Hamilton would have decent rail in Europe, but that would be part of a full network around the country, not just a one off where you must use your car for everywhere else.
I do however hope I’m proven wrong.
I hope you’re proven wrong too, Jimbo. When they finally include everything they should in the business case, like social health and carbon emissions, road pollutions in waterways and regional development.
Until then, I’d prefer to trial things than guess. 🙂
Jimbo – agree, and we have the potential to do that as well. However, I’d put Taupo well down the list given it would require the construction of an entirely new line.
A pity we can’t go back to 1860 and build our rail network with 150 years worth of hindsight. Still it would be possible to extend the Kinlieth branch to Taupo. I wonder how much it would cost and what it could carry beside Butwizard and logs. But if it carried on to Napier now that’s an idea.
@Royce either that or extend Rotorua to Taupo. Covers both tourist spots on one line.
The Roturua branch was pretty steep but alright for passengers and light freight. And it wouldn’t be easy to get it through Roturua now as its all built out. Still nothing is impossible.
Jimbo, one line of:
Auckland – North Waikato – Hamilton – Inland BoP – Tauranga
…would have just under half the national population living on it. Not the big three, but three of the biggest five.
A network covering half the population of NZ looks like a good backbone to start from.
Would be good to see the breakdowns pre-2015 to see where the increases were. Do you have this data? In terms of what has changed, two observations are policing has became less visible and cellular data became basically free.
Comparing to Ireland stats, I note that the pedestrian and cyclist deaths are about the same as here, but the driver/passenger and motorcyclist deaths are less than half ours. This may reflect our relative size and that the vast majority of our non-urban travel is on very unforgiving roads.
Hopefully the increased spending on safety improvements for existing roads will make a big difference. But also shows that while costly spending on new roads is a must.
There is a wealth of data on the MOT website (although most data isn’t quite up to date) – https://www.transport.govt.nz/mot-resources/transport-dashboard/2-road-transport/.
Skimming through this, deaths per km traveled increased from 2013 – 2017 (as far as the data goes), however there doesn’t seem to be a clear reason.
Driving speeds have decreased, more people are using seat-belts, more children are in restraints, alcohol related incidents have decreased and more people are using public transport.
Pedestrian deaths have increased but this isn’t material relative to the total. Neither is the increase in deaths related to foreign drivers. Truck and motorcycle deaths per km have been flat.
Kiwis are some of the worst drivers in the world. Getting a licence is far too easy in NZ and very hard in the Nordics.
Lowering the speed limit won’t help if people continue to overtake recklessly. A head on at 80kph is still going to kill you as much as one at 130kph.
If everyone adhered to the rules there would be no accidents, but while I watch bus drivers, cyclists, trucks, cars etc all run red lights, we are doomed.
If the speed limit has no bearing on safety, why not increase it to 200 km/hr? Or is 100 km/hr some kind of magical perfect level?
I don’t how easy it is to get a license in NZ Vs Nordic countries but I do know that having a crash at 80KPH is far more survivable than at 130.
Look at figure 1 in this link, at 80KPH you still have ~60% chance of survival all things being equal but 0% above 100……….
https://acrs.org.au/files/papers/arsc/2015/JurewiczC%20256%20Proposed%20vehicle%20impact%20speed%20-%20severe%20injury%20probability%20relationships%20for%20selected%20crash%20types.pdf
Is the collision speed the speed of both vehicles combined?
Regardless I assume in most cases that at least one vehicle is going to apply the brakes before the collision, and they will decelerate much more rapidly from 80 than from 100 and they will also have much more time to react.
Lowering the speed also increases the chances of actually not having a crash when someone makes an error.
“Lowering the speed limit won’t help if people continue to overtake recklessly.” Nonsense. If people continue to overtake recklessly, there’s huge advantage if they only have to overtake a car travelling at 80 km/hr rather than 100 km/hr. The overtaking car’s speed is lower. The ability of all the other drivers in the vicinity to react to stupidity is far higher when they are all driving more slowly. And the head-on isn’t the only crash that is likely; other vehicles are likely to become involved. The slower any vehicle involved in any one of these secondary crashes, the better the chances of survival.
Daniel, what you’re expressing in, “Kiwis are some of the worst drivers in the world… If everyone adhered to the rules there would be no accidents” is exactly what we need to overcome.
I agree our licensing needs improving, but it is only one of many, many changes that need to be made. The new road safety strategy nails the problem when it says:
“we know from overseas experience that a focus on improving driving skills and addressing risk-taking behaviours will not solve the road safety problem by itself. No one expects to crash, but people make mistakes – including those of us who are usually careful and responsible drivers. We need to build a safe road system that is designed for people. This means doing our best to reduce crashes, but acknowledging that crashes will continue to happen. When crashes occur, we can prevent serious harm through safe vehicles, safe speeds and forgiving road design. This approach has dramatically improved road safety in other countries, so we know it works. It was introduced in the previous road safety strategy Safer Journeys2010-2020. In the instances where we have fully applied this approach, it has been proven to save lives on our roads. But we haven’t done enough.”
Blaming everything on driver training and licensing being inadequate is where we went wrong. It doesn’t work, and the attitude prevents work and funding for all the other things that need addressing.
We don’t need to continue in this ignorant state when we have so many countries that are addressing their road safety problems to emulate.
The two best things we could do to drastically reduce the road toll are: 1. Build a fast rail service between Auckland, Hamilton, Tauranga triangle and 2. Build a fully separated 2 lane in each direction motorway/highway between whangerei and Taupo.
The rail will take a lot of traffic off the road and the separated highway will stop head on collisions on the busiest roads.
Do those things and it will be perfectly safe to have a Max speed limit of 130.
While you are right that separating the busiest stretches of roads will reduce collisions, Whangarei to Taupo is not the busiest stretch of road in the country.
Parts of it are but they are mostly already separated or being separated. If you wanted to reduce the road toll you would separate SH1 from Whangarei to Marsden Point and Cambridge to Tirau, along with SH3 from Hamilton to Te Awamutu and Waitara to New Plymouth, and SH2 to Tauranga to Katikati. Those roads all carry more traffic than SH1 south of Tirau.
None of this separation needs to be four lanes either, a 2+1 road or 1+1 with frequent passing lanes would improve safety.
Surely the best thing we can do is address the areas where the death tolls are highest?
As much as I would love fast rail between Auckland and Hamilton, I don’t think the SH1 between the 2 (which is already 2 lane all the way – nearly) is the worst stretch of road in NZ.
You’re talking as if the goal here is to raise the speed limit.
Instead, our government is focused on sustainable, safe transport that provides multimodal access for all users at the best value for money. They’ve laid out these priorities in their GPS.
If they build a new road that has a good safety record at 130 km/hr speeds, it’ll be an over-investment, given the context of the rest of our roads. Instead of paying far too much money into one stretch of road the money should be spent on the many deficient parts of our transport network.
The government has laid out the priorities. You just seem to be out of step with them.
Heidi, there is no reason why sections of road in NZ couldn’t be 130 already (especially the roads that are currently 110). Head-ons are virtually impossible, leaving the road is too. Roads are relatively straight. Many other countries would have them as 130km/h roads (some even higher).
If it’s for environmental reasons then yes that is a valid point in terms of emissions. Safety? You’re having a laugh!
What speed do you think the majority of the population want?
Being out of step with the current Government doesn’t mean much. The Government changes every three years but roads last much longer.
The reason why the UK government set a max speed limit of 113 mph on their motorways is that equated to the safe stopping distance of the vehicles at the time. I think we can all agree that car breaking has improved significantly since 1967.
130 Kph is perfectly safe on straight stretches of separated road, when conditions allow.
“130 Kph (sic) is perfectly safe on straight stretches of separated road, when conditions allow.”
Since you pick out the UK as an example, take a look at bthis:
https://www.autoexpress.co.uk/car-news/consumer-news/108014/number-of-fatal-motorway-accidents-increases-by-a-fifth
“The number of fatal accidents on Britain’s motorways rose by 19.4 per cent last year”.
Perfectly safe? I think not. It’s clear that numerous drivers are unable to adjust their speed according to “conditions”.
See the bit where is states that “24 vehicles a week are collided with when parked (on) hard shoulders”? Perfectly safe? I think your definition of perfect is defective.
“I think we can all agree that car breaking has improved significantly since 1967.” It’s braking, Daniel, not breaking…and an essential part of braking is the judgement reaction time and actions of the human at the controls. Has that improved since 1967? I think not.
Apart from our recently built expressways and motorways our roads compared to Australia and Europe including the EU are generally much more lacking edge protection and median barriers, this coupled with the generally higher speed limits on comparable standards of roads means more death and destruction here. There is a lot of scope for life saving improvement over many many kilometres of roading, but understandably our road building contractors and their staff would much sooner be building a few kilometres flagship roads then erecting many kilometres of armco barriers.
Good post, looking forward to the toll coming down with improved safety measures kicking in over time. We need to keep working on all the factors we know of including driver education, and I think enforcement is particularly weak in NZ. Often driven all the way to a holiday destination and seen zero or say 1 police car the whole trip.
Why NZ always compare with those major cities? NZ just a small old village, don’t think we shall compare with Norway, but we shall compare with Egypt, Africa alike. NZ road generally outdated, lack of safety measure, as least lack of rest place, lack of separation. Unless Mindset of NZer can change to agree that they are old, nothing can change. A mere few number less road toll 2019 won’t last long!!
Last time I checked Norway wasn’t a city, let alone a major city.
Good thought regarding rest areas. Often few and far between and hard to stop at (with inadequate signage) unless you know where they are probably because the open speed limit is so fast.
NZ has a population only slightly lower than Norway (4.8m vs 5.3m) while Norway is quite a lot bigger (270,000 km2 vs 385,000 km2). Both are developed countries.
It seems like an excellent comparison. Why would you compare NZ to an entire continent or to Egypt which has almost nothing in common with NZ demographically, developmentally or culturally?
Here’s a good example from the top of the South Island about how hard it is to change attitudes to speed… Stuff reports how 17,000 people have signed a petition against reducing a 100 km speed limit on part of highway 6 between Blenheim and Nelson.
The proposed limit would be 80 km.
The piece they refer to is the flat bit between Havelock and Renwick near Blenheim.
The petition numbers are equivalent to HALF the population of Blenheim or more than a quarter of Nelson and Richmond combined.
It’s highly likely some of the people signing would have known or knew someone killed on that section of road.
Our death rate is very bad whichever way or with whichever country the comparisons are made. Apples with apples would mean comparing the number of deaths in Norway and NZ related to the number of miles driven. It’s still bad for NZ. Stay safe everyone.
We could also improve the driver training with compulsory lessons from official instructors. Who trains the instructors? I would hope the AA would step in here. Good and bad habits are passed on. Let’s instil good habits, patience and courtesy. The latter are rare on the roads now.
The open road is certainly where much work needs to be done in reducing NZ’s road toll.
A few observations about open roads in NZ and some engineering solutions (some which have already been addressed).
1. Road marking. Many open roads are marked with white, broken (pass if safe) centre lines even on blind bends or sections with a high number of intersections and driveways. Roads should be marked clearly according to the conditions rather than leaving it to driver discretion.
Some busier sections of highway have had road marking improvements made but the majority of roads are still poorly marked.
In a nutshell, more yellow no passing lines on open roads and the possible introduction of new markings such as a broken double yellow line for roads where passing is prohibited with the exception of slow tractors or cyclists (such is the case on some open roads in Europe for instance). Also a ban on right turns on no passing stretches unless marked with a break in the line.
Also, get rid of the flush right turn lanes. It’s a lane so mark it as such. It causes much confusion to foreign drivers (as a flush means “don’t enter” in all other countries except NZ) with the resulting last second swerv into the turning lane.
2. Eliminating driveways on busier state highways as much as possible. NZ highways have a lot of driveways intersecting. Where possible parallel service roads should be built for local, rural traffic seperate from the main carriageway (such is the case on main dutch provincial roads). This eliminates much slow local (farm) traffic, right turning traffic and provides a safe cycle route.
Of course this kind of implimentation would be difficult on many open roads due to topography and skinny right of ways but could still be implimented on quite a few routes.
3. Barriers, as has been suggested many times already. I would add that I am not a big fan of steel rope barriers, mainly due to the risks posed to motorcyclists. Rope barriers have been banned in several EU countries for this reason.
4. Better intersection design. More use of roundabouts, traffic lights and grade seperated intersections. The Taupo bypass is a good example of what should be the case on more NZ highways.
5. Speed limits. Already addressed but just to reiterate, speed limits on many NZ open roads are way too high.
Obviously a lot of reengineering of the highway network is required.
Interestingly, research indicates it’s the upright posts that pose the greatest risk to motorcyclists rather than the wire itself.
These seem like good suggestions, although we’ll have to find a way to ensure the “side roads” don’t just mean the SH gets even wider and makes more of a scar across the landscape.
By the way, I’ve read on here before that our rules don’t prevent people overtaking cyclists when there are no passing orange lines, because you can still go over the orange line to pass anything that’s not a vehicle, like a rider on a horse or bicycle. (Tractors are, of course, vehicles. Not sure how to deal with that one.)
If one subset of road users wants to travel at 100kmh with literally no crash protection, then that’s sort of on them. We can’t defer a ‘pretty good’ solution for a huge number of other road users because it introduces extra safety risk to a user group who knowingly expose themselves to massive inherent risk in the first place.
How about talking about the actual problem of road accidents and the huge differences between males and females?
As far as I am aware, women use the same roads, cars, bikes, drive the kids to school, do chores – why have 2018 51x female drivers died and 134 men?
Wouldn’t research into the whys be really important towards resolving some male driven issues.
And please don’t do this boys need to be boys because no boy wants to be a dead boy – and the over 35s have just as significant differences.
Another staggering fact is that way more women over 40 die as a passenger – wonder who drove that car, she didn’t!
So instead of blaming infrastructure, vehicles etc why not looking in the right direction, acknowledge and do something that will matter?
Not sure what you mean by “looking in the right direction” but part of it might have to do with the fact that more males drive long distances on open roads than women do. Many women leave longer distance, open road driving over to the man while they (the woman) may prefer local/ urban driving.
The smoking problem was tackled by working on all levers:
– more information
– smokefree workplaces, pubs, etc
– heavy restrictions on advertising.
The gambling problem is not being properly tackled because the big gambling players are controlling the research, and making sure it’s focused on “those deviant individuals who have a particular weakness for gambling”.
The road safety situation needs to use all levers, too. Yes there needs to be a huge push to change the arrogant culture. But relying on that solely is denying the rest of us the proven changes in infrastructure that work. Also, the culture is far more likely to change if we work on all fronts at once. Healthy streets in cities, and more consistent, safer design in rural areas make sense and are appealing. Arrogant attitudes will melt under general satisfaction of a safe system, as the benefits become clear.
@Ellen… and here comes the anti-men brigade…
Men must enjoy that “male privilege” of dying at 3x the rate of females on the road…
Simple fact is that men are far more likely to drive both for work (most truck drivers, couriers, taxis, etc etc are male), are more likely to drive the family (dads tend to drive while mum sleeps in the front seat), and do a lot more driving in general for various reasons.
Time to look at yourself rather than man hating.
@AKLDude – ‘Mums tend to sleep in the front’..any evidence of this? Also are Mum and Dads the only drivers in NZ? I don’t have children but I drive.
I do a little thing when I’m a use the bus for a morning commute and count the split of men vs women, usually comes out around 65% female. Whilst waiting at the stop I often see the female being dropped at the bus stop whilst the male goes off in a usually flash car to work. Of course this stems from the inequality in the workplace, the male (i’m male and in a well paid role FYI) usually has the better paid, more ‘professional’ role, hence taking the car he probably paid ‘more’ for to work.
So yes, Men are more likely to drive and as such, along with safety measures which are by far the most important, we need take a look at our driving culture and see if we can change that a bit too to help safety rather than the ‘don’t attack me i’m male’ attitude.
You can observe this for yourself during any holiday period. The vast VAST majority of family drivers are male.
If there had been a well balanced and non sexist post by Ellen then there wouldn’t be a need for that comment, however there wasn’t so there it is.
You’re right about the urban men driving the COMPANY car… tends to go with the type of job they are more likely to do. If that job pays more than another job that is different what’s the problem? Even in the same job, years of experience and/or sales success etc also play a role in remuneration.
Then as I previously mentioned men also tend to do other jobs with more driving – drivers, taxis etc. you can add tradies to that list too.
There are lots of reasons men end up driving more than women. I agree. But I do take issue with this:
“You’re right about the urban men driving the COMPANY car… tends to go with the type of job they are more likely to do. If that job pays more than another job that is different what’s the problem? Even in the same job, years of experience and/or sales success etc also play a role in remuneration.”
I think it’s a problem that women are not getting the jobs with the perks (such as company cars). We know they work at least as hard in life as men do.
I think it’s a problem that bosses rarely reward parents and caregivers of elderly relatives (more often women still) who have taken time off with promotion recognising the breadth of understanding this experience brings to an organisation’s success. And that they usually have blinkers to the benefits of this breadth of experience.
I think it’s a problem in this day and age that many urban workers – far more than those who you’d expect to need a car for work – are getting company cars as perks.
I think it’s a problem that this is happening because many bosses – probably both women and men by now – think, “that’s the way it’s always been,” and worse, because, “this suits me.”
I think it’s a problem that the result of this is that there is a transport power imbalance within many relationships.
“ I think it’s a problem that women are not getting the jobs with the perks (such as company cars). We know they work at least as hard in life as men do.” So you made a poor career choice/didn’t get qualifications/didn’t put in the hard yards/didn’t get the sales or business etc… maybe the receptionist should get a company car while the salesperson who is driving to various meetings all day should just use their own car? The boss should give up their company car because part-time Sally wants one? :/
“I think it’s a problem that bosses rarely reward parents and caregivers of elderly relatives (more often women still) who have taken time off with promotion recognising the breadth of understanding this experience brings to an organisation’s success. And that they usually have blinkers to the benefits of this breadth of experience.” Admirable for people to do this… not really a companies problem though is it? Also pretty rare for that sort of experience to translate to a companies bottom line (as much as it would be nice if it did). Still don’t see many female tradies… works too tough/dangerous/dirty (take your pick).
Sexist AND racist, really outdoing yourself this week AKLdude! Are you seriously suggesting the average pay gap of $8 per hour, which is still rising by the way is because women don’t work as hard as men, or make good career choices.
Wow, just wow.
Keep it to evidence based on here mate, you have failed to do that in any of your recent ramblings.
“Dude”, you’re ignoring a whole lot of systemic issues that need addressing, including society basically not valuing the type of work women do. And you’ve expresssed what’s called “maternal wall bias”.
Tradies sometimes work hard. Caregivers in resthomes do too. It’s physically demanding work, and most don’t even get the living wage. And then they take three buses home because their boyfriend crashed the car.
How about reading: https://www.employment.govt.nz/hours-and-wages/pay/pay-equity/gender-pay-gap/
“Men and women cannot make the choices they want about how they share paid and unpaid work while gender affects employment. Pay and employment equity cannot be achieved for women or men unless the ways gender is affecting employment are identified and addressed.”
And maybe start question why so many parasitic sectors get paid so well while the core jobs of society don’t.
“ tackled by working on all levers:”
I am not saying that there aren’t dangerous roads that need to be made safer.
But so far this discussion is just a technical one so all of the above are just as narrow.
And yes, seems like long distance driving is unfortunately left to more males hence more women passengers die above their 40s.
I interpret the lower number of women passengers in lower ages that there is a lot more self-driving there.
The right direction? Male culture change – like road safety on many levels, this would reduce not only road fatalities but also domestic violence.
Coming from Germany plus having many German/world visitors the one thing all immediately feel here:
New Zealanders are still some of the nicest welcoming caring people but when they sit behind the wheel it all changes -Dr Jekyll/Mr Hyde – it’s a real problem and it’s still not enough talked about -not surprised as many participants here are men and I appreciate it’s not easy to start looking around your own habits.
Yup. I do feel the conversations are starting to change, though.
The beauty of technical solutions, such as wire rope median barriers is the protect people, whether they are the macho male driver, the female passenger or the completely innocent driver of the other car.
I’ve pondered a lot about the jekyll/hyde syndrome as i’ve noticed that myself.
If I were to take a random guess, I would think that part of it is because of the huge variation in congested travel times vs uncongested travel times. TomTom highlights this when it says Auckland is one of the most congested cities in the world.
When it’s free flow, I can get across Auckland in 30min. When its congested it might take 1.5hrs or longer. This is a direct result of having so many cars and extensive motorway networks.
So drivers are often used to such a great “best case scenario”. When they encounter the worst case scenario with lots of congestion and delays, they get mad because they know things could be better and believe it should be so much better. Because of that huge variance in best/worst travel times, it leads to frustration and agressive driving that we see.
If Auckland were 100% congested all the time, it would be “normal” and and I’d aruge that drivers would be more considerate because they are used to it.