New data from the NZTA shows that Aucklanders are driving less and that’s before we see the impacts the regional fuel tax has had.
Every year the NZTA publish information on how many kilometres vehicles travel (VKT) and break that down by a number of ways including where that travel happened, such as which region and whether on local roads or state highways. This data has traditionally been updated in about September and I had been eagerly awaiting the 2017/18 result. But after months of waiting, I decided to OIA the numbers.
A few of the reasons I was so keen to see the results included:
- After years of flat or slightly declining VKT in Auckland, the 2016/17 year saw a noticeable jump. Was this increase in VKT an anomaly or part of a new upward trend?
- The Waterview tunnels also opened at the start of the period (Jul-17) and what impact might that have had on the numbers?
- The Ministry of Transports Quarterly VKT numbers, which are based on odometer readings but are only at a nationwide level, are showing a significant increase in VKT over the last few years with VKT having increased from 40.3 billion kms annually in 2013 to 49.1 billion kms in 2018. How much is Auckland contributing to this increase?
The NZTA numbers are slightly different to above as are derived from vehicle counts but have the same overall trend. Overall, just under half of all kilometres travelled happen on local roads compared to state highways – this percentage has been reducing and is likely related to the significant investments in state highways over the last decade or so.
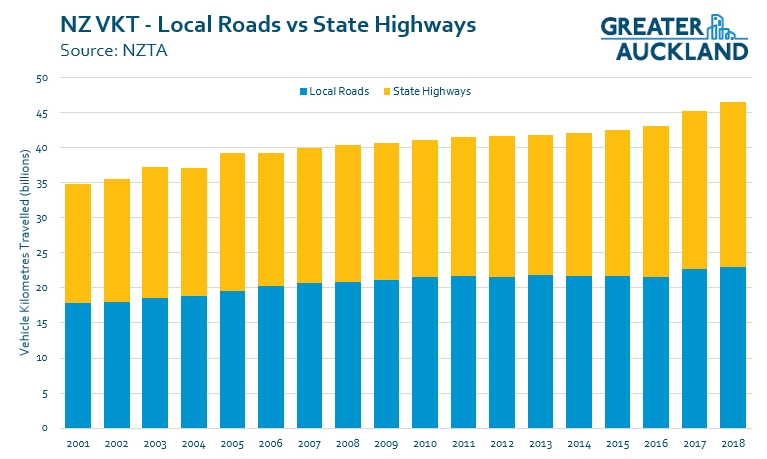
This increase is a concern, especially given that vehicle emissions are a large contributor to climate change.
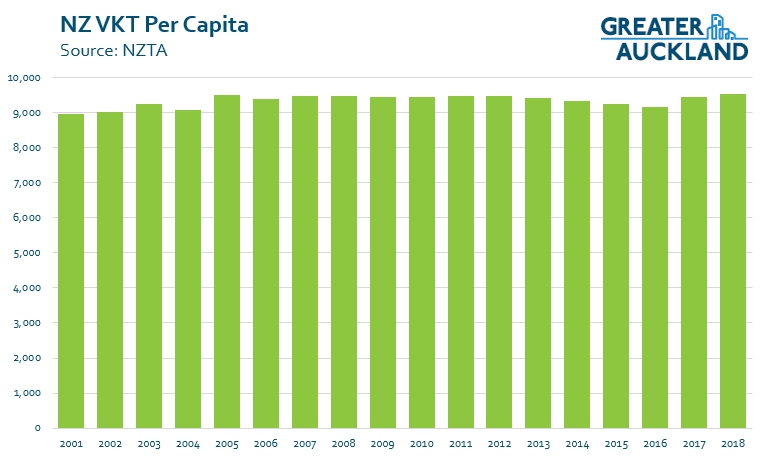
The recent increase has meant that on a per capita basis we’ve just hit a new record of 9,530 km per person. The previous high was set in 2005 and had declined slightly for more than a decade.
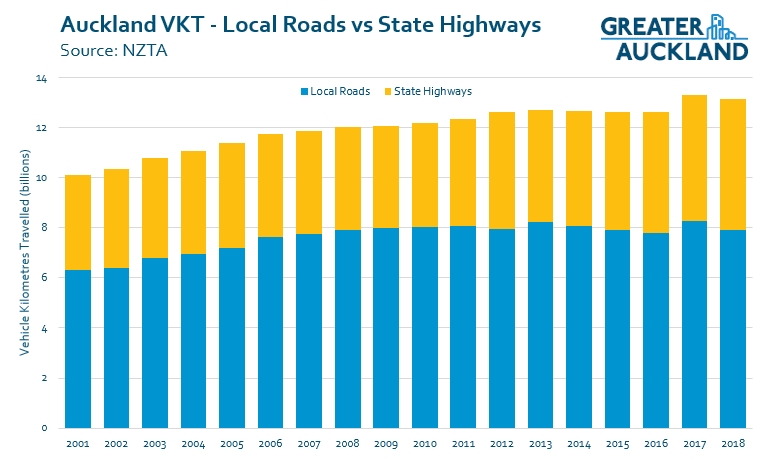
Looking more closely at Auckland, overall, Aucklanders are driving slightly fewer kilometres than they did in 2016/17, dropping from 13.3 billion to 13.1 billion. What is also changing is the ratio between local roads and state highways. Auckland has a much higher percentage of travel occurring on local roads than the rest of the country although like the rest of the country, this split has been coming down. This is due to increased numbers on state highways but decreases on local roads.
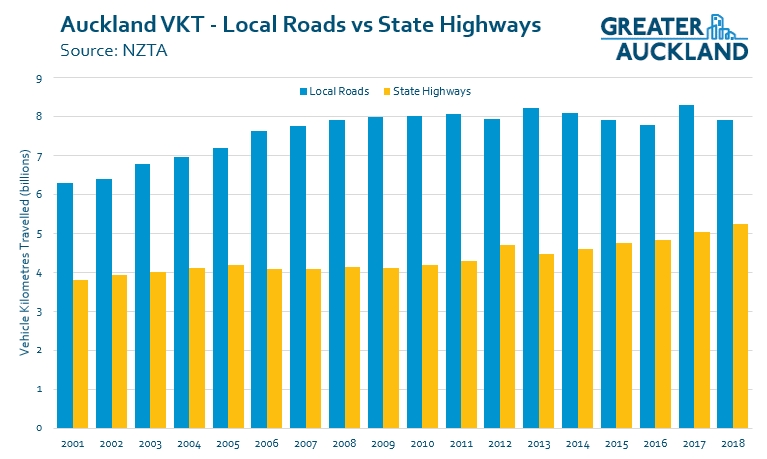
This version helps show the difference between local roads and state highways better.
The overall decrease in VKT becomes more important when combined with Auckland’s rapid population growth and means Auckland has reached a low of 7,764 km per person. That’s about 800km less than the peak in 2008. The reduction in Auckland’s per capita VKT has seen us move closer to Wellington, the lowest region in NZ with just over 7k km per person. The graph below compares VKT per person in NZ’s five biggest regions (by population). What really stands out is just how much more driving those in the Waikato are doing.
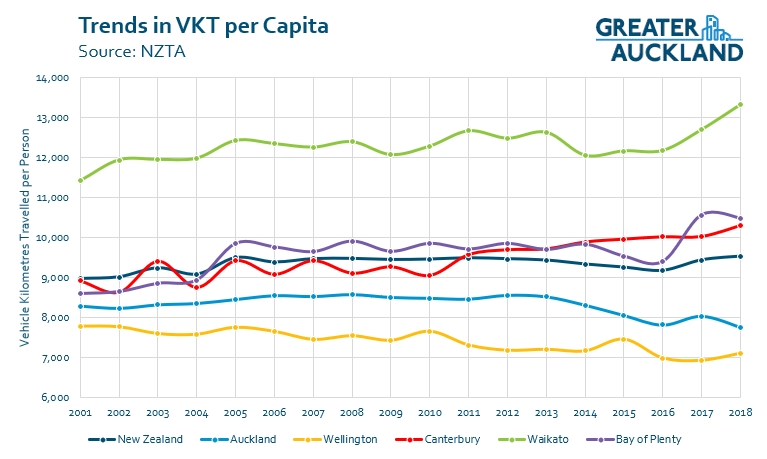
If you think congestion in Auckland is bad now, just think about how much worse it would be if we were all driving even more, say at the rate of those in Canterbury. At the same time, the VKT numbers are still high and there seems to be a lot of opportunity to bringing that down further.
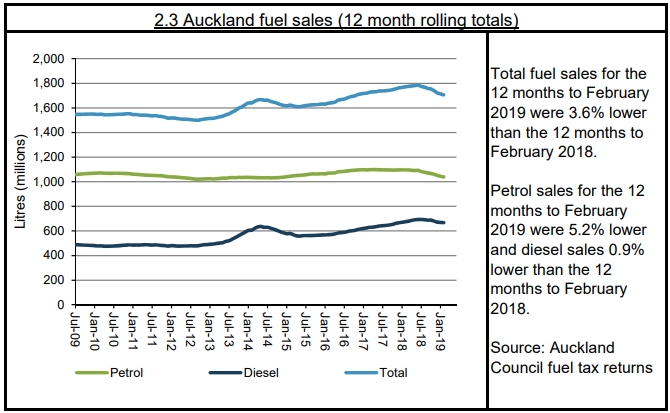
These results were up until July last year but one thing I’m looking forward to seeing the impact of next year is the Regional Fuel Tax. Early indications are that it is likely to have a significant impact on VKT results. The graph below comes from Auckland Transport’s quarterly indicators report and shows fuel sales in Auckland with a noticeable drop after the RFT was introduced.
As part of the OIA to get the VKT information, I also asked why the NZTA hadn’t updated the data on their website, this was their response:
we have been in the process of replacing the existing online solution, but because of technical issues, we have been unable to update the data. Unfortunately, we are unable to provide a timeframe for when a new solution will be available. However, we are looking at alternative options for making the data public in the meantime.
I can understand that their flash based dashboard is no longer the right solution but along with that they also just uploaded the data behind it in a spreadsheet. It seems strange they couldn’t at least update that on the site.

 Processing...
I now mostly cycle for my commute. Which completely removes my commute driving and also doesn’t create PT capacity issues for others. But how are we rewarded? With either inappropriate infrastructure or rubbish infrastructure which isn’t suited for purpose. Also spending money on bike infrastructure seems to be such a difficult prospect, a million dollars to put a cycleway down a road. :OOO $$$. But then tens, hundreds of millions or even billions on PT (which I now rarely use) or road infrastructure and nobody bats an eye…
More people would cycle if we had more protected infrastructure, its like one of the number one barriers… I ask people at work with transport woes, why not cycle in? The general response is no thanks I don’t want to die.
It seems the majority of big ticket cycle infrastructure is targeted at the city, which seems bizarre to me, the city is the only place I feel comfortable riding on the road, as people expect cyclists and generally know how to behave around cyclists. Whereas out in the suburbs a cyclist is a unusual site and I almost get taken off the road at least once a trip or so… Not saying don’t spend any money on infrastructure in the city, but have a more regional focus and target higher risk areas and also improve connections to existing infrastructure like the NW cycleway to make even better use of these assets…
I am also extremely surprised with the change of government having almost no interest in boosting cycling in Auckland… not saying that AT shouldn’t improve their input funding-wise either though.
Children living in the most deprived areas of Auckland have a 3 times higher injury rate than those living in the least deprived areas.
The central city certainly needs work because of the concentration of people walking and cycling there. But the focus should also be on improving safety in the hardest hit areas first, and on measures that will work across the whole region, such as lower speed limits.
What is most frustrating to me is the lack of attention to providing quality walking and cycling infrastructure to the existing train stations, even where the existing schools would benefit from the infrastructure as well. Instead, the approach is to use park and rides, which induce even more traffic locally, making it even more dangerous for the kids and people trying to cycle to the train.
If our bus based PT is the best alternative AT can do then forget big spend ups on anything else. Public transport, if anything, badly needs improvement for the masses.
Perhaps if both central and local government put climate change legislation as a bottom line for any transport spending decisions then I think decent alternatives will begin to be implemented. But we are still in the “head in the sand” phase of leadership in this country on that subject.
If planning better for climate change is being held up by layers of institutional inertia, as it seems to be, I suspect we need to declare a climate emergency.
Yes!
Totally agree. Timid politicians spending way to much time putting toes in the water and seeing if the polls are negatively affected. Or worse those who think its the 1950’s and BAU.
Meanwhile………………………..
If we declare a climate emergency can we set a goal of keeping the climate how it is now? Our climate is much nicer now than it was back in 1990. Summers were shit back then.
I was just saying to someone Aucklands weather is so much better than it was, but I don’t think that’s helping out Earth at this time.
The problem is precisely keeping as it is or thereabouts… all the evidence says change is continuing and accelerating which is means it’s likely to get to a very uncomfortable condition soonish.
In order to keep it same-is we’re going to have to change a great deal.
If the whole globe had a relatively benign climate like NZ things would be fine. NZ because of its particular situation is insulated from some of the more serious effects of global-warming, as felt by other countries. Let’s not fall into the trap of thinking that because things seem OK for us, then no one else has a problem.
A one par boiled frog said to the other ….
A climate emergency is a nice idea, but probably pretty meaningless. Look at the UK – they have just declared an emergency yet ministers refused to answer questions on whether this will mean the cancellation of the new runway at Heathrow.
I suspect it would be the same here – we would have an emergency in name but would all oil exploration permits be immediately cancelled, would all new roading cease, would petrol and diesel cars be banned from cities? Of course not.
A climate emergency should mean the sort of drastic action we would take in wartime, but instead it would just be meaningless PR and then BAU.
The new runway at LHR will reduce emissions! Currently you have aircraft burning thousands of tons of fuel slowly taxiing to/from the runway due to congestion, or burning even more in holding patterns, or slowed down in inefficient flight paths again because of congestion at LHR. The runway isn’t the problem, it is the amount of flights, the aircraft types, and as mentioned the congestion that is increasing emissions there.
Aircraft overall are getting more efficient and creating less emissions per passenger. If LHR wanted to stabilise emissions or reduce them then the way to do that would be to cap the number of flights (which they effectively already do) while making them more efficient with the new runway.
AKLDUDE the fundamental point is that more runways enables more flights. Why doesn’t Heathrow simply cap the number of flights at a lower level than currently, to enable efficient operations on the existing runways? Rhetorical question – I know the answer is $$$$
akldude, you might be onto something here, should we build an SH16.2 beside SH16 to get traffic moving and reduce the tonnes of CO2,NOX etc created from congested sh16.
Airports are different from roads. The sky effectively has almost unlimited space to use and are limited almost entirely by the airports. Roads on the other hand are limited everywhere. Furthermore aviation emissions are significantly higher by most measures, planes can’t exactly switch their engines off.
LHR is already operating over capacity by most measurements so a new runway will certainly help reduce congestion there. An airport can absolutely restrict the amount of usage, doing so on a road is a much harder proposition.
We absolutely need to declare a climate emergency. Will it cause things to change immediately? No it won’t. It will send a strong message to politicians that fiddling at the edges is not ok. It will send a message that being ranked at 44 in our response to climate change is not ok.
Considering the government campaigned on a cycle to school initiative I’m not seeing much change either.
Establishing protected routes around every school would do a lot to improve the network as a whole.
I’ve commuted for about 20 years by bicycle although not for the past couple of months due to being hit by a car from behind. This highlights another point, it is no good building substandard infrastructure, if it is indirect, full of bends, hilly or has bumpy, smashed or broken pavement, cyclists will continue to ride on the road and be at risk of getting hit by cars.
“I am also extremely surprised with the change of government having almost no interest in boosting cycling in Auckland…” – last year the Govt announced $390 million of walking/cycling funding over the next three years, of which Akld was getting $149m (not to mention the cycleway funding that is built into other major roading projects). I think you might want to look a little closer to home for the reasons why little has actually happened on the ground yet…
Any reason you can think of that NZ should be allocating only a tenth of the percentage of the transport budget that the UN recommends? We’ve got a big catchup to do.
And yes, personnel changes could make a bit of difference closer to home very soon. Telling that they can’t fill the poisoned chalice position. The reason should be pretty clear to management; hope they’ll act to fix it soon.
The main reason would be that it’s bloody hard to quickly ramp up to the necessary technical resources to deliver more than this. We had the same problem when the Urban Cycleways Programme came onstream back in 2015, essentially boosting annual cycleway spending by a factor of 5. A new horde of sufficiently skilled cycleway planners/designers don’t just appear overnight. It’s the same reason I’ve had full houses while delivering cycle planning/design training courses over the past few months…
Catch 22, I suppose. More resources could be helping ramp up the number of planners and designers.
I suspect the inaction on reducing the funding for the other modes might be part of the problem too.
Yes well where is it going? We have seen next to nothing.
It also still seems really small compared to their contribution to other modes. Considering the size of Auckland and lack of infrastructure at present compared to other modes, it should be significantly more…
AT can’t even widen the unsafe shared path through Kingsland, which in some sections would just take a bit of tar/concrete on the side in the grass area. Instead they are running a silly signage campaign telling people to slow down, slow down to what exactly? Theres no suggested speed provided. They have speed counters down probably so they can just blame cyclists for the issues instead of fixing them…
Heads need to roll for the lack of… anything… pretty much…
Yes they should do better, but in the meantime the other option is to just slow down when you need to. Not that hard to do I’ve found.
I rode past some little kiddies the other day and the thought of knocking one over scared the bejeesus out of me even though I’d slowed right down.
Probably cost me all of about 6.4 seconds, but it did seem worth it…
Yes absolutely, I slow down too as required, but at 6am in the morning when nobody is around I just go per normal. The issue is its too narrow at peak times, and generally unsafe passing is one of the key issues I always see. I always slow down around kids though, as they are unpredictable – thats just common sense you would think…
Time for NZ to follow suit
https://www.planetizen.com/news/2019/04/103778-new-bike-infrastructure-standard-set-cambridge
“I can understand that their flash based dashboard is no longer the right solution but along with that they also just uploaded the data behind it in a spreadsheet. It seems strange they couldn’t at least update that on the site.”
Yeah, this is holding me up on the regional work I’m trying to do.
I also think it’s kind of crazy that the MoT and NZTA come up with different vkt numbers… there’s a lot of careful statistical work that goes into trying to make them as accurate as possible, it seems. Yet the original base of the numbers is fairly blunt.
Does anyone know what the benefit of MoT and NZTA keeping different systems is?
Last week Z Energy announced a lower profit and their analysis, in summary, was the spike in crude oil prices that led to record pump prices, in turn, led to people buying less fuel and probably not travelling like they were. And you could add to that the 11 cents per litre added in July last year that exacerbated the speed of fuel price hikes.
I would imagine those two things more than any other meant fewer journey’s.
Having said that in early 2019 peak periods are truly awful and there seem more cars than ever.
If Z energy has a lower profit now then they should do a deal with KR to supply the fuel for the H2A service as the profit could be lower with the cars that could be coming off the road next March/April
Hmmm Aucklanders are driving a lot less per capita now than in 2001.
So much for induced demand.
You mean demand? And I’d suggest the decline in AKL hints at the elasticity of demand wrt price.
Yes Stu. I’d guess that congestion also contributes.
But clearly induced demand isn’t a thing so every time someone like Heidi complains about it we can say ‘ah no, it’s not happening ‘.
That’s not how it works.
Induced demand says that if you develop roads then people will drive because of this.
If you find evidence of a general decrease in road usage then you haven’t demonstrated anything about what’s happening on the built roads and haven’t established what would have happened without the new roads either. Furthermore, induced demand also applies with public transport measures, which we’d expect to have the opposite effect.
Induced demand is simply the logical consequence of supply and demand models. To disprove induced demand would amount to a complete refutation of the supply and demand model.
Maybe start with Wikipedia and then move on from there: https://en.wikipedia.org/wiki/Induced_demand
Certainly it’s better than pointing at evidence unable to substantiate the case you want to make.
Correction, I meant induced demand isn’t a thing in Auckland.
We’ve built new roads and yet people are driving less per capita. Induced demand is not occurring.
Whether its real or not is irrelevant to the comment.
But you’re happy to see it’s a mechanism in NZ as a whole? And of course, in Europe and the US and everywhere the metastudies have been done? Just isn’t a thing in Auckland?
In fact, every place has a number of competing forces operating:
NZ’s rising vkt shows the effect of road building in NZ.
Auckland’s rising vkt on the state highways shows the effect of state highway building.
Pt Chev’s rising vkt shows the effect of state highway building nearby.
Auckland’s lower vkt on the local roads last year shows the competing effects of road building and improvement of other transport choices, in the context of a congested city; it’s one obvious way cities can have a lower carbon footprint.
Cities that invest in the sustainable modes see good modeshift. Now’s our opportunity, but we don’t need to make it hard for ourselves by investing in roads and creating that opposing influence.
Tony that’s really not the case. Induced driving can be seen whenever a road is added or widened, on that road (eg Waterview). In fact nzta would be devastated if no one turned up to drive on their new roads! The region wide stats tell a more complicated story, as they also show changes in mode use and locational shifts; especially towards denser closer in areas. Inducement is absolutely present in Auckland, across every mode; PT cycling walking scooting all booming.
But also The AKL road system is both mature, ie is everywhere, and at key times, saturated. So there is a declining return on these investments; even as the encourage more driving. In a somewhat contradictory seeming outcome.
But in total they’re driving more. The reduction in per capita vkt is more than outweighed by the high population growth, increase in the vehicle fleet numbers.
Induced demand also works for Public Transport. In Auckland since 2001 there has been a very considerable upgrade to PT options which is reflected in patronage. The Waikato has had a massive increase in Road Capacity and virtually nil increase in PT provision. This misplaced expenditure has come at the costs of increased emissions and fatalities in this region. Not good outcomes for the amount spent.
2018 had the second highest overall VKT ever recorded, demand is definitely there, some of it driven by population.
If we hadn’t built as many motorways in the interim, I’d hazard a guess our overall VKT would be a lot closer to the 2001 figure, especially if that money had been used on PT.
Plenty of evidence of induced mode-shift; build it and they come.
Whatever we feed grows, so we need to be smart about what we feed, right?
Traffic congestion is simply too many vehicles, so inducing mode shift is a much smarter idea than trying to induce more driving. Especially as the driving networks are mature and at times saturated. Invest in the alternatives to driving and everything improves, including driving.
This is a bit misleading as absolute VKT, rather than per capita VKT has increased markedly since 2013 as has the road toll. I think it is important to show absolute numbers too, as just looking at per capita figures it looks like there should be not many more cars on the road at any one time. Absolute VKT tells quite a different story – after being flat for years, despite significant population growth, VKT has increased markedly since 2013.
Does any of this data factor in the effect of pure electric and all types of hybrid electric vehicles?
Wouldn’t that skew data?
EVs are a drop in the bucket and would not even make a ripple in the overall numbers, Auckland light fleet is ~1 million vehicles and there are ~6K EVs in Auckland… so its .6%…
Hybrids are also skewing data. I regularly get 800 km out of a tank of 91 at a cost of close to $70 if I purchase with a Fuel Tax cancelling discount in West Auckland. That normally lasts me a month as I travel on PT whenever possible.
But but but this blog supports and encourages more immigration despite its effects on emissions, infrastructure (especially increased road use by cars as well as trucks to service the larger population)…
Indeed. Until they wrap their heads around the problems if never ending growth, population or other, they’ll never come to grips with climate change.
Imagine the size of the carbon spend needed to build the CRL. Billions of dollars in concrete, steel and heavy machinery hours.
All to enable more growth. Cars won’t kill us, growth will.
How does immigration affect climate change?
extra-terrestrials moving in; stealing jobs, living on welfare, ruining our planet…
Precisely Tony. But some folk have been so brainwashed by a life within capitalism they have come to equate growth with success. They genuinely believe that if growth stalls it means failure has occured.
The insatiable desire for never ending growth and continuous construction of new buildings and new infrastructure is akin to a junkie believing he can’t go without drugs.
It’s this growth mantra that is causing the climate problems and bringing on the sixth mass extinction.
Yes. Luckily plenty of people are prepared to call out the myth. And an overlapping, but not identical, group, understand the role fossil fuels have played by putting growth on steroids.
Economic growth and Population growth are two different things. I agree that there will be an infrastructure surplus if populations fall, however it doesn’t mean the end of economic growth.
Are you suggesting we leave this growth to other countries so it is off our books, even if the impact on the climate is still there?
That’s exactly the problem jezza. Other countries are growing and are intent on growing. Until we all understand that, climate change is here to stay. And I would suggest that bringing people from low emitting countries to high emitting countries like ours is a backward step?
If you are talking about population growth then it is entirely driven by something that was explained to us by our parents when we were young.
It is entirely controlled by individuals not countries, there is very little anyone can do about it (ethically).
I don’t buy the idea that people’s emissions will increase by emigrating to NZ. The developing countries are exactly that, developing and generally fast.
There are many reasons for and against immigration but emissions is not one of them.
Growth will stop eventually Tony, in fact it will do so within most current lifetimes. This is because the education of women has slowed birth rates in western nations and is beginning to do the same in developing and undeveloped nations, as more women access education.
The latest estimate is that population growth will reverse globally about 30 years from now, and will thereafter be in permanent decline due to the average birth rate of women being less than the 2.1 babies needed to sustain population levels.
It is likely that by the end of the century population will be the same as it is now.
What this means is that we will end up with an infrastructure surplus and are most certainly looking at a new way of living in which growth no longer occurs and traditional economics no longer work.
I say bring it on.
The difference is if people don’t emigrate from developing countries to developed countries then the governments of those developing countries will be forced to take measures to slow their rate of population growth. This in turn means less population in total around the world and less emissions. This is even greater because people living in developing countries overall tend to produce lower emissions due to their lower level of development and standard of living. If those people move to developed countries they then end up also living higher standard lives and producing more emissions in the process. They also add to infrastructure deficits in these countries (requiring more emission creating infrastructure) as well as increasing emissions for existing citizens of that country (more congestion etc). But this blog is more interested in unchecked immigration than about the environment or existing Aucklanders lives.
I think you’re more interested in racism than realism
@felix, there’s always one who plays the race card instead of looking at the actual picture.
Realist – the majority of the worlds developing countries make no attempt to control their populations. The only exception is China, and even then there are so many loopholes in their one child policy it’s impact on population growth has been relatively small.
NZ takes a tiny fraction of India’s population for example, and even if we cut of this immigration it wouldn’t make the slightest difference to India’s population strategy.
jezza, countries don’t need to control their populations. Population decline is inevitable.
The great defining event of the 21st century — one of the great defining events in human history — will occur in three decades, give or take, when the global population starts to decline. Once that decline begins, it will never end.
Have a read…
https://medium.com/s/story/by-the-end-of-this-century-the-global-population-will-start-to-shrink-2f606c1ef088?fbclid=IwAR214NOBnYf_FiVfOJXOPZPJjrYnWTSJwABWqN1W-hzReK7niOznocrgqfw
Geoff – thanks, interesting article. I agree this will likely happen at some stage. It will probably be beneficial in the long run but will come with some initial pain. An ageing and shrinking population will make it harder to afford pensions and other benefits, these people will likely be the ones that suffer initially.
Hello Matt
Hamilton vpd counts between 2014-16 show state highways have increased by about 10%, but east/west bridge traffic only increased by 2.5%. looking at local roads like Auckland there has been a long-term trend of declining vpd. If we look to the north east count #234 on my map we see step change in counts, this is trade vehicles building new housing area and one of the access points to Hamilton bypass project – I have mapped and graph shoulding change here -> http://hamiltonurbanblog.co.nz/2018/06/hamilton%e2%80%99s-traffic-change-last-3-years/
That Auckland fuel sales graph shows max sales early last year. Wasn’t that when fuel price was at its lowest for several years, petrol at $1.6/litre. since then the growth to over $2.3/litre the settling back to about $2.1/litre and including the11.5c Auckland tax.
So isn’t fuel price fluctuation just reflected in this graph rather than any significant move to other modes?
Bogle, I am with you, I don’t think that the decrease in vkt is necessarily a reflection in mode shift. Last years ATAP report suggested as much stating that while it is improving in the city it is seemingly static over the region. That makes sense; if largely you do nothing, nothing will change.
I think that the country needs to go back to first principles and ask, what transport plan do we need when our first concern is climate change? Scrap RoNS, ATAP etc and the less known overarching plan, SHIT, and put together something fit for purpose.
Let’s look at the countries and cities that are doing it well and it’s not Canada or AUstralia. I am amazed travelling in Italy how sparsely occupied some of the motorways are. With tolls of about 7 euros per 100km could that be the reason? Could high speed rail be another reason?
Currently as a country and city we seem either bereft of ideas or the ability to implement them.
“What really stands out is just how much more driving those in the Waikato are doing” – ah, I don’t think you can associate all driving in a region with the residents living in that region. E.g. a bit of basic geography would remind you that 1.6 million people from another certain region live right next door and no doubt quite often like to travel south for holidays and other trips – that’s going to skew the figures somewhat. It also explains in part why Waikato also has fairly high crash/injury/fatal rates – lots of people drive through there, much of it on the high-speed highways…
May have been answered already but what month do these yearly figures end on?
How does our (NZ’s) VKT per capita compare to other OECD countries?
Also would be interesting to know how our road toll, which is clearly unacceptable, relates to VKT per capita. I suspect our VKT per capita is high compared to other OECD countries, which might go someway in explaining why our road deaths per capita may also be high?
Would you think the most useful measure is lives lost per distance travelled? Or do you think it should be lives lost per trip taken? Because of course it’s only bad planning that means trips have to be long. I gave a chart of lives lost per distance travelled for vulnerable modes in the post: https://www.greaterauckland.org.nz/2019/03/07/aa-lobbying-part-two-the-survey/