If the cycleways have been feeling a bit busier than usual of late, you’re not imagining things. The latest numbers are out and confirm Auckland’s bike lanes are booming, with many counters in February recording their busiest month ever, despite there only being 28 days.
Overall, Auckland Transport’s network of 43 automated cycleway counters recorded an increase of over 23% for the month compared to February 2018. On a 12-month rolling basis the numbers are up an impressive 8.4%, making cycling probably the fastest growing mode in Auckland right now – although it is coming off a very low base.
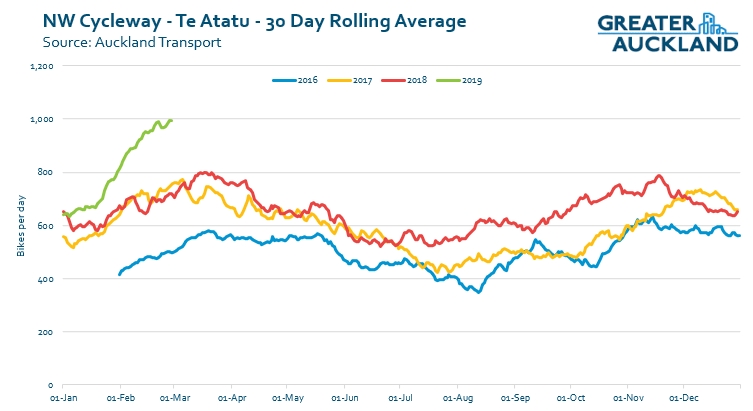
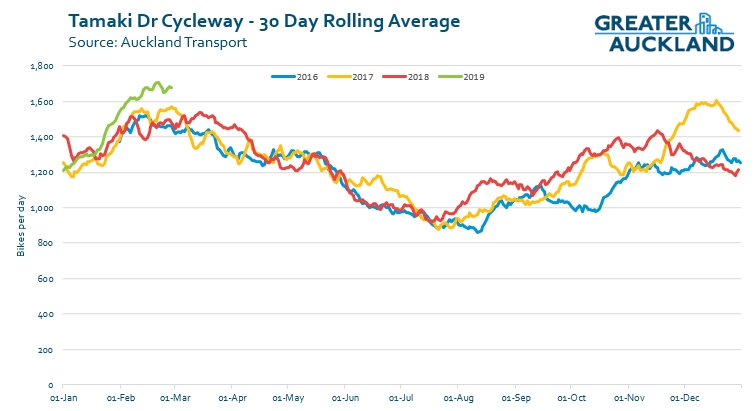
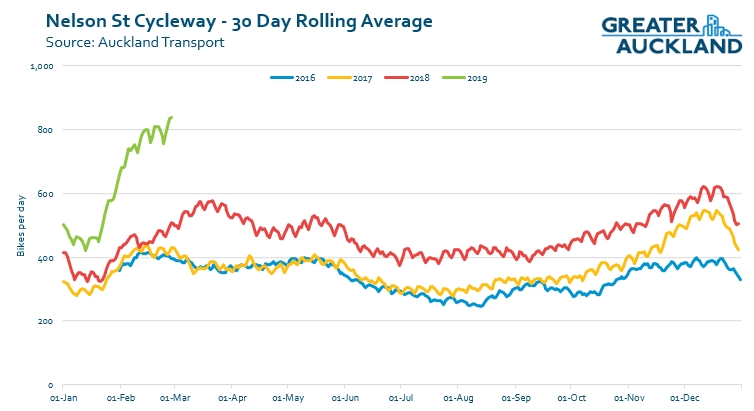
While the overall picture is great, some individual counters are even more impressive and seeing substantially higher increases in usage. Below is a one month rolling average of each of the last few years for some of the most prominent cycleways.
- The Kingsland counter is the highest it’s ever been, averaging over 1,130 trips per day but with some individual days near the end of the month approaching 2,000 trips.

- Further up the path at Te Atatu, the growth looks even more stark.
- Tamaki Dr is our busiest cycleway/path and one that hasn’t seen a lot of growth in recent years in the first part of the year. But 2019 is looking a bit different.
The following two are notable as these are the two where AT say they have adjusted the counters “to detect scooters and other similar devices such as skateboards“. While this may lose a little fidelity on bike numbers, I think it shows well that our bike lanes are now being used by a lot of small mobility devices and that they’re something we need to be including for going forward in project assessments. The government should really get on with changing legislation to officially allow these other small mobility devices to use bike lanes.
- Nelson St is seeing the biggest increase so far with usage nearly doubling from this time last year.
- Less pronounced nut just as important is Quay St where the significant disruption is perhaps also having an impact.

These great results would certainly have been helped by February being so warm and dry. NIWA’s monthly summary says the first half of the month was part of the 9th longest recorded dry spells in Auckland’s history and in total there was only 22mm of rain for the month, just 30% of normal and well below the 185mm we had during February 2018.
The other notable factor many have been noticing is a surge in the numbers riding e-bikes.
Given March is typically the busiest month for transport, including cycleways, as you can see above, and with the weather largely holding off (touching wood), we should have some big numbers coming up for this month too.
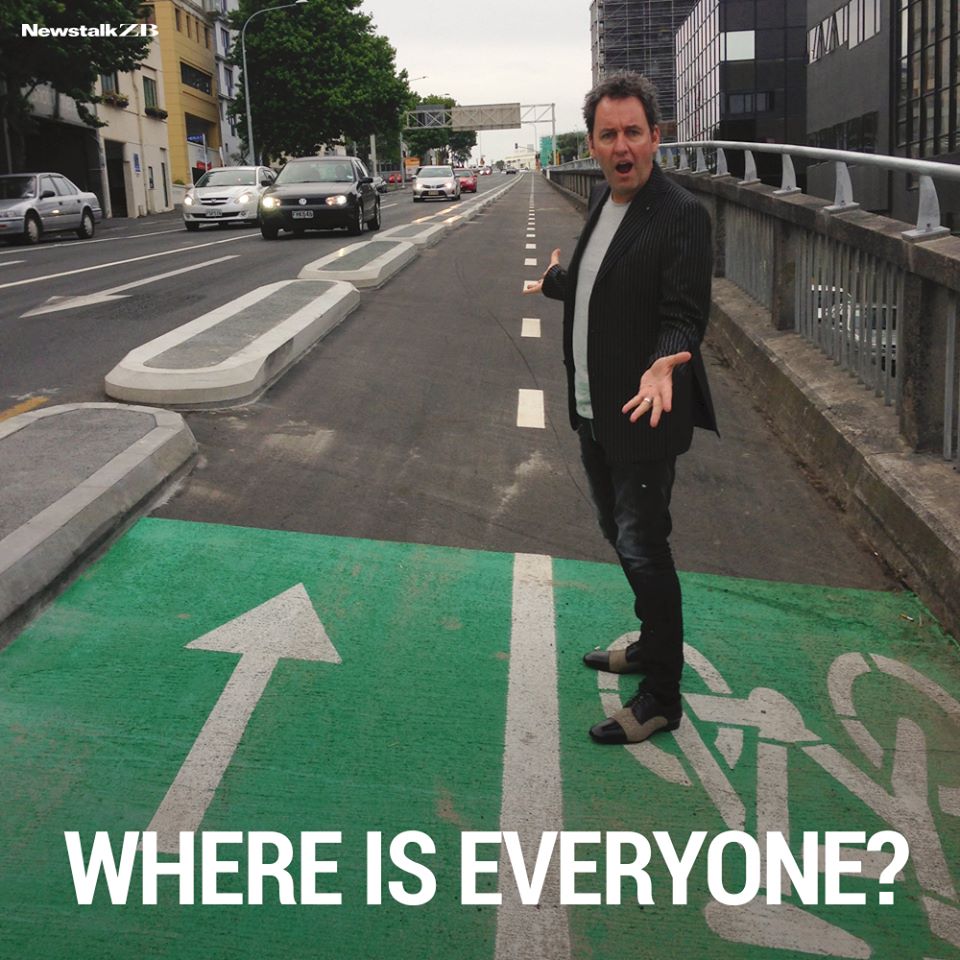
So, where’s Hosking with this latest news?

 Processing...
This coincides, I think, with the traffic hitting some sort of tipping point. The congestion is starting earlier and finishing later; and it’s a ten minute longer journey to cover the same distance at the same time as it was six months ago.
It’s clear that people just don’t have that kind of time to spend sitting in traffic going nowhere and don’t think it’s a temporary thing. We are close to to the tipping point of cycling being competitive for time over a 20km journey. That’s absolutely mind-blowing.
+1 I agree, and I wonder if the increase is reflecting a larger geographic catchment of confident cyclists rather than an increase in the number of less confident cyclists. That’s what the increase in numbers at the two NW locations suggest to me.
The Te Atatu NW numbers are staggering given that those journeys have to be at least 5km and most are likely over 10km.
If you ever needed a reminder that congestion is exacerbated with every few % of extra vehicles at peak, the NW cycle counts are it. I shudder to think how bad it would be with those cyclists in cars and adding another 1,000 vehicles each way.
if I lived in Auckland the decision on where I lived would be based on access to one proximity to a cycle route being convenient for my commute. Id be happy with a 15km one way trip.
I completely agree, peak traffic is the worst I have experienced and “peak” is getting longer and longer. I really feel for Te Atatu and the adjoining parts of Glendene, the only alternative to traffic jams is bikes or E-scooters and the cycle lane alongside the motorway, so its no surprise its proving popular.
Hoping these E-bikes and scooters prove durable as the alternatives are non-existent.
I’d suggest electric bikes also make cycling that little bit less of a chore.
I was riding in via the west last week and got passed by a dude on a scooter, passed as in he flew past me. Caught him at the next set of lights and said hi (though his full face helmet), his scooter cost him $3,000 and he used it to ride alternate days between riding with perhaps one day a week driving in. As he he left the lights he was doing over 40kmh along the flat, he soon disappeared up the road. Pretty substantial outlay for a scooter but an awesome way to get to and fro.
Not surprising. I noticed that there are lot more cyclist this year compared to last year. At the St Luke Intersection last year it was me plus one cyclist. Now it is me plus 8 other cyclists (half were e-bike). The traffic island starting to become quite crowded.
Plus the weather has been great which is awesome. Yeah holy Hosking!!!!
This is positive, the weather has been agreeable, which no doubts helps, but as mentioned above, driving a car to work has become frustrating for most people, and perhaps only those listening to Hosking still do it? I note that the Avondale New Lynn path is approaching 3 years behind schedule, and the GI Tamaki path has also been pushed back 3 years. So even with these delays, the numbers say that if you build it, they will come (Jim Morrison’s spirit in Wayne’s World?). Hoskings shoes still look engraved with tyre marks from all the cyclists that ran over his ignorant feet while he posed (illegally on a bike lane?)
The botch job to date of cycleway rollout is something that hopefully will be turned around. And you’re right – even with the active and passive hindering of building the infrastructure that been going on, the latent demand shows numbers will soar. If AT are hoping to have cycling numbers match some figure based on congestion or population increase… does this exceed that number? Imagine what success would like once investment and AT processes mean the cycleway network actually gets built.
Meanwhile vkt rises – and so the conflicts between vehicles and bicycles will rise. The Dutch Cycling Embassy says not to do this. You need to reduce traffic by good planning, or you’re planning for increased DSI. NZTA and AT need to shift on this. Maybe we need to show them that in addition to the safety risk the increasing vkt is creating, their road building in the face of evidence is creating a legal and reputational risk?
On the negative side, the public transport experience is deteriorating. Buses are packed to the gunnels and barely standing room on most commuter hour services. This is having a cascade effect in turn.
The number of bus drivers running red lights, and using excessive speed near vulnerable users is going through the roof. There are international moves to address this sort of behaviour by demanding a refund. I’m tempted to get that going here.
I’d strongly support that. It’s shameful how many times busses go through red lights.
I don’t have a cell phone, David. Do you? I’m thinking that I could put together instructions for passengers for how to apply for a refund using a computer. Could you put together instructions for how to do it with the app (with screenshots?) Then I can add in some information about it, and we’ve got a blog post.
The refund procedure is still bad. I applied for a refund due to being chanrged an extra zone (due to a temporary stop crossing over into a different zone). The form to apply for a refund had a 30 character limit on explanations. I got denied and then appealed. No feedback on the appeal but didn’t see any money so I assume it was denied.
Yes, the limit in characters is an issue. Maybe we could suggest a tagline that fits into the characters given. “Unacceptable dangerous driving.” doesn’t even fit. Maybe just “Dangerous Driving”.
🙂 Recounting, the first one does, if the fullstop is left out. But I’m open to better phrasing…?
I’m glad to be part of these statistics for the last year and a half. And as of Feb my wife has also joined the NW cycle way numbers going into the city (ebike was the catalyst).
Great to see so many people out and about using the cycleways/ shared paths.
Great to see the uptick; we’re seeing similar growth patterns in Christchurch as the network rolls out here (see https://smartview.ccc.govt.nz/#map/layer/ecocounter/@172.62658,-43.53288,13 – can also see/download data at each site right back to their installation). Capturing e-scooter numbers is useful to see as well, but I would like to think that they can still separate out the figures as desired (in the same way that road counters can differentiate cars vs trucks) so that we can still understand the growth in cycling alone.
Might have to look at a widening programme to four-lane some of these cycleways soon if this growth keeps going.
A halt on further shared paths is also needed and a programme to convert the existing ones is also needed. They have also lead to the assumption by many that all cycle paths are shared paths.
That would be a bit overreacting… I can understand the point on the northwestern cycleway, but most other places are quiet, and are very unlikely to get significant pedestrian and cyclist numbers, ever. On most streets there are just not that many houses.
Even then. Look at those statistics above… that is still under 1500 cyclists per entire day. I don’t understand how it is possible at all to get any trouble at that rate. Are people really that bone-headed and inconsiderate over here?
That’s 1500 per day, getting closer to 2000 per day at the end of the month, without much in the way of a network, for a bunch of people who have thought through their options and are what I’d call early adopters.
The comment that there is isn’t the expected drop during winter along with the expansion of adoption of eBikes and eScooters means that the numbers will continue to grow, so planning for the growth, as opposed to believing the models that continue to predict an increase in SOV usage seems like a great idea.
How much growth would be required before separation would be required everywhere? Nothern Busway White Elephants anyone?
Well we don’t have hourly data, but let’s assume a peak flow of 1000 cyclists per hour. That is better than last year but still. Half the capacity of a car lane. Is everybody cycling in an SUV or what?
It is not an ideal situation currently but I find it weird that it is already a problem at the current (still low) usage.
Soon the problem will be that of people going 40 on a bike lane, and scaring the cycling school bus off that bike lane. It is a problem which we sooner or later will have to solve.
The seasonal peak to trough difference isn’t as high as I’d have expected either. So much for “no-one cycles in Winter.”
I cycle daily between Te Atatu Peninsula and Newmarket (about 17.5km one one). It takes me 35-40mins (on ebike, door-to-door). That beats down driving hands down on most workdays. For driving it’s not just the time on the motorway (25-45mins citybound at peak), but also the time it takes to get onto the motorway.
I used to catch the bus before. I used to be able to make the trip in 45-55mins, but these days 75mins more like the norm, with 90mins not unusual. That’s generally due to lack of bus priority in key places. Train is to far away (30mins on 131, which is very infrequent, plus about 35mins on the train, plus walking from Newmarket train station).
Basically – cycling is the only viable option. Peak time is getting much longer and if something goes wrong (rain, accident) than all bets are off (also for the bus due to lack of any priority along most of the way).
Some anecdata – I often cycle to be in the city by 6am. A year ago I’d meet 1-2 cyclists before Waterview, these days I meet 1-2 on the peninsula itself, with dozens more on the NW.
Hosking is busy diving for cover because a Nazi scumbag in Christchurch took his Muslim-baiting and migrant-baiting too far.
And no doubt he is sitting shaking his head and saying “how did this happen?”. Like many of the media he has traded clicks for fearmongering about a group of people who appear to represent no threat to NZ. And support the fre speech of the people who stirred this maniac up.
Are you serious? Is this what GA is now?
A place to discuss issues? Yes, yes it is.
To reduce the SOV (single occupancy vehicles) on the roads could we consider the use of a tariff on ICE imports that reflect their potential to emit Green House gas and Particulate emissions.
(No matter what source or whether new or used).
We already have emissions standards, you can’t just import anything you like.
And still no count for Weymouth Rd?
I started cycling a month ago (switched from driving – oh the shame). I cycle from Balmoral shops to Britomart. It takes me about 25 minutes on the way in and about 30 minutes on the way home. I’m really enjoying it and regret that I didn’t start doing it years ago.
Dominion road in the bus lanes is OK but I wouldn’t let me kids cycle in them. The bus lanes are pretty empty most of the time and I speed past all the cars. There are some missing sections which make me nervous but overall its not too bad.
I’ve been buzzing AT with lots of tweets about issues along my route but I doubt anything will get done on them. Pot holes, missing cycle lanes, unprotected cycle lanes on 60kph roads, broken glass, long wait times at crossings.
this bothers me most of all… I have a feeling all debris from the carriageway (cars) gets brushed into the cyclelane which are ignored. It all ends up being a hazard for cyclists as it can create a puncture.
And I think this sums it up fairly well. Congestion is getting more adults onto bikes despite the lack of safe facilities. But a sign that we’ve provided real access will be when children can cycle to all their activities.
If AT published hourly counts that might show school related peak in the afternoon at some counters. Change in size of this peak could provide some indication of increase/decrease in numbers.
An example from Wellington is the Airport Subway counter (separated path in tunnel), where there is a clear double peak in the afternoon with the earlier one corresponding to 3pm to 4pm. My interpretation is that is related to the various school in the area (particularly Rongotai College that is close to this counter). See following link for WCC graphs & data:
https://www.transportprojects.org.nz/cycle-count-data/#showdata/electronic/100041855/2019-02-01
I’ve been riding an e-bike for 4 years now, firstly from Three Kings and recently from inner Mount Eden, with both routes meeting in Upper Queen Street. The growth in ridership over that period has been astounding, particularly in the “non-road warrior” category of cyclists, and e-bikes. Despite the very poor connection with Dominion Road, the new stretch of cycleway on Ian MacKinnon Drive has made a big difference: firstly to the ease of funnelling riders to the pink path, but also making the popularity of cycling more visible to passing drivers. I often see 7 cyclists on this new stretch in the morning. The other change I have noticed is a lot more 2 way traffic i.e. people cycling into town as the commuters go home.
So we’re expecting the NW causeway bike lane to close during building the LR along there, right?
I’m anticipating that the cycleway will have to be the first part rebuilt, then the LRT line.
Impressive numbers, great to see. I would argue Feb was a bit too hot for cycling…though wind cooling is great, so could of dampened any affect from lack of rain.
Interesting the Te Atatu result, could be e-bikes making a big difference here? I agree with comments the visibility aspect helps encourage the uptake eg Ian McKinnon Dr upgrade…and all the campaigns etc
Certainly seems to be getting much busier, week after week. I see a lot more e-bikes than I did 9 months ago when I abandoned public transports and moved to cycling.
I do 25 kms each way from Howick to Viaduct, takes 55 minutes; what I love is the consistency, I’m no longer impacted by the disruptions like we had last night on the Eastern line, no more getting off the train at Panmure and facing a 19 minute wait for a bus then another 30 hour to get home.
What’s really compelling is the finance numbers, if you’re moving from car or PT to bike, it pays for itself in a matter of months. My numbers suggest that over 10 years the monthly savings, if invested, will return a 6 figure sum. I’m also 10kgs lighter than this time last year.
Needs better infrastructure to encourage less brave people that it’s safe though. There’s big latent demand out there, we haven’t even scratched the surface of it.
I have just started using the new New Lynn Cycle lanes and it’s interesting to see that the Rankin Ave counter was 776 in Feb 2018 and 1,250 in Feb 2019 – that’s a huge increase over the year which includes the new Seabrook cycle lane which opened recently.
It’s a shame that there is no crossing across Ambrico Pl on the Rankin Ave cycle land and a lot of the paint has worn off – I wonder if there is supposed to be regular maintenance?
GA is upto playing tricks again. Com’mon, the numbers sound great with percentages, but look at the actual numbers and it’s very poor. Even if Kingsland had the odd day with 2,000 cyclists that’s an average of only 83 per hour (is that 40 in each direction per hour)?
Percentages are used to sell when actual numbers are low. Compared to bus users and cars cycling is still miles back. I’m not saying we should not invest in cycle lanes, but GA should be about encouraging more bus lanes to be built – the REAL people movers of this city.
Pretty sure GA do ALL of this and more, a lot more than questioning some numbers on an internet forum and nothing else..
Also pretty ironic calling them out for showing percentage increases then reverting bikes per hour over 24 hours, knowing that it skews the numbers..
Once again, these numbers are forever on the increase despite not having a remotely complete network…can you imagine Road figures rising and rising each year if you had to drive through fields to link up to roads, then onto gravel, then back onto roads…that’s what an incomplete network is!
In fact, no idea what you are actually trying to say in your post? You sound like someone who is just annoyed that numbers are increasing for whatever reason you seem to have.
Agree bikes/hour over 24 hours is massively misleading.
Taking an example from Wellington where hourly data is available, in February the busiest counter had weekday average of 46 bikes/hour but the busiest hour had over 200 bikes.
https://www.transportprojects.org.nz/cycle-count-data/#showdata/electronic/100049627/2019-02-01
Hey actually that averaging traffic over 24 hours is a pretty good idea. If we take the daily traffic on the harbour bridge, divide by 8 lanes, then divide by 24 hours I’m pretty sure we can prove that there is so much over-capacity we can repurpose a couple of lanes. 😀
+100
Right in the post it says
“making cycling probably the fastest growing mode in Auckland right now – although it is coming off a very low base”
Also, all the graphs are in numbers, not percentages.
One Word: eBikes. Cheaper and more available than ever. How good!
The 800 per day in Nelson Street is 1.8 cyclists per minute, meaning at any given time it will look pretty empty. Mike Hosking probably doesn’t have anything to add from his earlier comments?
Which equals three or four everytime the light goes green.
Bad math, apologies. It’s one cyclist every 1.8 minutes. Though most are probably during the day, so maybe 2 or 3 per minute in the daytime?
Nice trolling. Do we have any time data just so we can put to bed silly comments like this? Bikes aren’t going 24 hours a day, you know this,I know this, we all know this. Your maths are way off because you are trolling.
Even better, go have a look for yourself 🙂
What? Plenty of people cycling at night too you know. Bikes are 24/7 much like cars. Unfortunately PT is the only thing lacking at night time.
The Nelson St / Pink Path combo could be cheaply improved by adding another crossing phase of Union St. At peak times I’ll see 10-12 bikes waiting while 1 or max 2 cars head down Union St. An easy change would be adding a cross phase while cars can turn right into Nelson St (stop the straight through traffic onto Union). This would have zero impact on cars as they’ve just had a straight phase onto Union but would half the bike waiting time.
Great idea.
hoping street sweepers learn to do the cycle lanes as well. new north road can be like a gravel track
I have recently started using the Panmure shared path, which is lovely, but have yet to encounter anyone else on it. Perhaps not surprising when at one end is Mt Wellington Highway, and at the other is Morrin Rd, on which an no-road bike lane continues for about 200 metres, then abruptly stops on an uphill slope where the road narrows, replaced by parked cars, so there’s nowhere to go but swerve into a stream of cars and trucks barrelling up the hill. Seems a tad dangerous. It could be easily fixed with anything from yellow no-parking lines (at a minimum) to a continuing protected bike lane, but will that ever happen?
(Note, different Andrew to the previous comment)
What could be done to make Dominion and Mt Eden Roads more bike friendly?
How could it be done?
When could it be done?