Just over a week after we saw the results for December. Now the high level ridership numbers for January are out and they are looking good. January is typically the quietest month of the year thanks to a number of factors such as: school holidays, people being away on leave, the rail network shutdowns and traffic being lighter so driving is easier, but this year it seems many more people jumped on board buses, trains and particularly ferries. It’s also worth noting that there were exactly the same number of working days, weekend days and public holiday days as January 2018 which further helps make the results impressive.
Across all modes combined we saw a 13.7% increase in boardings compared to January 2018 which represents almost 820,000 more trips and pushing us ever closer to the 100 million mark – we’re now at 96.86 million. As you can see below, all modes fared well.
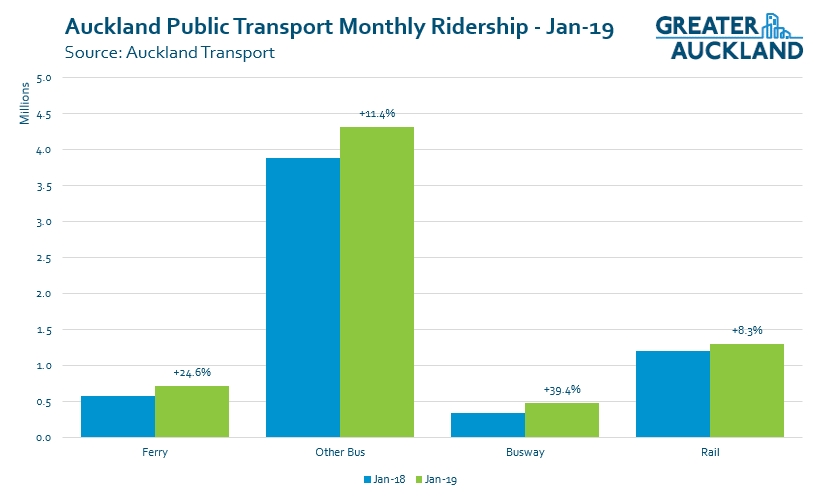
The busway is continuing to look very positive, however with the roll out of the New Network AT did change how they report busway usage. We’ll need to wait till October to see what the full impact of these changes are but as I mentioned yesterday, the indications are that the busway is now carrying more passengers on an annual basis than any of the lines on the rail network, a great example of the power of frequency and reliability in getting people to use PT.
The real surprise result for January though was the ferries. In total just over 716,000 trips were recorded on ferries, an increase of 24.6% on last January. This is probably the single biggest month ferries have seen since the harbour bridge was built, the previous biggest month was in March last year (based on monthly data since 2002. It’s not clear what caused ferries to see such a surge in usage but it might be tied to the hot and dry January we saw encouraging people to visit places like Waiheke etc.

The rail network also did well considering much of it was closed down for a lot of the month as part of the upgrade works. Overall there were 1.3 million train trips in January and what’s interesting is that prior to 2015, we had never seen even a March, typically our busiest month of the year when electric trains really started rolling out, have that many.
A good amount of the growth we’re seeing will be the result of the new bus network that has been rolled out over the last few years and for which the final major parts, Central Auckland and North Shore. Below is a quick summary of how each of the new network areas are performing. As you can see, all parts of the city are seeing PT use increase but it also highlights how almost 60% of trips occur in the central area – the old Auckland City Council boundaries.
| Trips | % of Total | Growth | |
| South | 10,300,000 | 11% | 9% |
| West | 9,500,000 | 10% | 11% |
| East | 3,500,000 | 4% | 14% |
| Central | 52,400,000 | 58% | 4% |
| North | 15,200,000 | 17% | 9% |
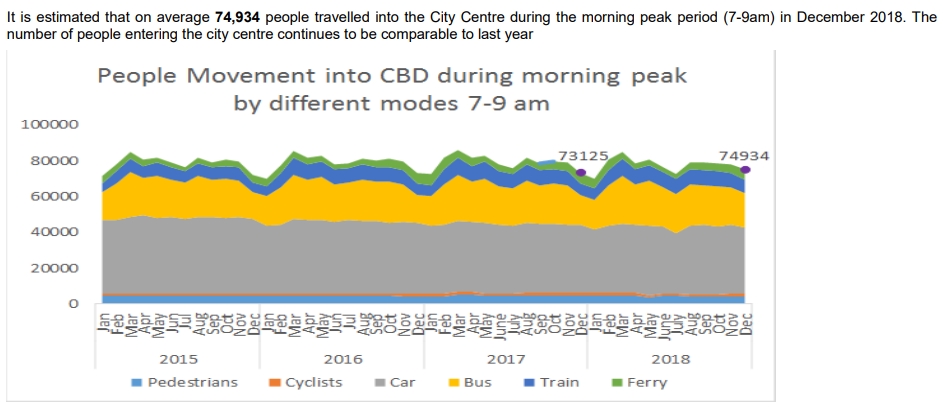
Another thing that is reported in ATs board reports is this graph which shows how people are accessing the city centre each morning. This basically the people crossing the city’s motorway noose and so doesn’t include people who live within the city centre cordon. I’ve mentioned before that I find this graph horrible to read as it’s impossible to really tell what is happening – although you can see a decrease in car numbers over time.
AT kindly provided me with the latest numbers, as used in the graph above, which has allowed me to update my version of this which I think shows the trends much better by looking at the results on a 12-month rolling basis. As you can see, the split of modes seems to have roughly stabilised over the last six-months with people arriving by car making up just over 48% of AM peak trips to the city. This is down from almost 54% around three years ago. Over the coming year it will be interesting to see how this all changes, especially if the changes to Quay St start to change behaviour.
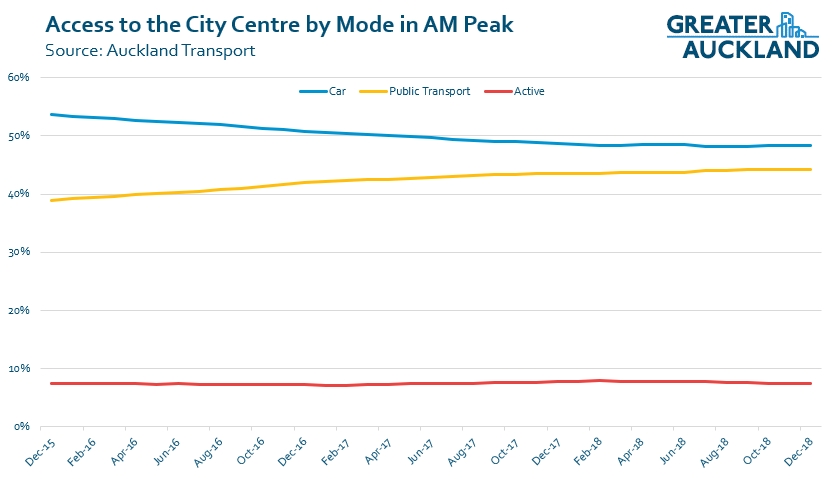
We’ve had some individual months where PT use alone has been higher that car use but I wonder when we’ll see that happen over a 12-month period?

 Processing...
Depending on where you are the peak buses are full however….
Are there any plans in the immediate future for T2 or 3/Bus lanes in West Auckland, as in around Henderson and Te Atatu or in fact anywhere out west? I realise there is some plan way off in the never never for a bus lane or LRT mirroring SH16 but have heard little more about it.
The reason I ask is I have found West Auckland to the city in the weekday mornings is the worst I have seen with the exception of the road works on Te Atatu Rd a while back. The motorway was crawling from beyond Lincoln Rd and near stationary at the Waterview interchange Exiting at Pt Chev I found Pt Chev Road stacked back toward Great North Rd and a continual line of cars back along Meola to Garnet Road. I pity the residents around there.
Despite the increase uptake in PT or according to AT, is it the increase in Auckland’s population countering things?
Yes, or perhaps the increase in population in areas where it’s harder to take public transport.
I think areas like the NWM and its ratruns are a litmus paper for when AT finally becomes multimodal and puts traffic flow subordinate to public good outcomes.
There’s very little cause for hope at the moment, unfortunately, but there is huge opportunity. What could be done in terms of increasing the flow of people through the NWM corridor and in terms of civilising the areas used as ratruns is enormous – at both the short term and long term stage. But it’s all big picture, cross-silo stuff.
Yep Meola Rd has become a frustration. Timed at 8 minutes for the 1.5km today.
Really due to NZTA priority overulling AT by pushing people onto streets or preventing them getting onto motorways.
Even if you could access the motorway without those ramp lights, its creaking at the seams.
Excluding the catchment areas around the rail corridor out west, PT is not effective for residents east of Henderson. Yes there are bus services but they get strangled in the gridlock just as bad, worse perhaps.
I’m thinking AT have a very, very long way to go before they can pat themselves on the back in offering alternatives to this sizable well established population.
“Really due to NZTA priority overulling AT”
AT was complicit. It was AT who responded to my concerns about the effect the Waterview Connection project (which includes the widening on SH16) would have on local streets by saying, “The Well-Connected Alliance responds that it considers that the project will have nothing but positive effects on local traffic.”
AT also failed last year to even respond to my request that the streetscape improvement project through Pt Chev should have traffic reduction measures incorporated within it, in order to negate the traffic induced by the road building projects.
Note, too, that the engineer in charge of the traffic modelling put in his expert evidence that a buslane on SH16 is not required. A member of the public who questioned it was disregarded in the BOI because:
“although obviously researched with care, we need to remember Mr M—‘s lack of specialist qualifications”
Only people in positions of authority like those in AT would be able to have any sway. They chose not to.
Its utterly infuriating but you get what want in this city and the people are just so damned happy to get the piss poor excuse they’re given by AT, a poor bus system always years and years behind demand.
The solution to this state of affairs for Aucklanders is to look at what’s on offer to get to work and go, ” yeah, nah”, same old same old, I’ll take my chances and take the car. There is no point complaining, no one cares, they never have, its always been this way.
11 cents per litre, less GST, since July 2018 apparently to give AT the funds to not only fund far better alternatives to cars but borrow to do the same. Where’s the quid pro quo AT? Myopic thinking all round be it AT, central government or the public who should be loud and vocal. This tax will be easy to get rid of because AT will have nothing to show for it.
The ridership may be up, may be, but its gridlock and from my experience worse out there all the same.
How I read that last graph: despite the disruption around the CRL, car mode share has stopped its decline and has stabilized at 48%, just higher than public transport mode share. I did not know that people in cars still outnumber people on public transport during the morning peak.
I suppose A4E will reduce through traffic and improve the public access, but these statistics of how many people still drive into the city may not change much under A4E. It seems they should be under the spotlight at AT and Council. There’s no excuse for such a high level of SOV’s to the city centre, with all its public transport options. The number of carparks available is, of course, inducing a lot of this travel.
My understanding is that there is a target drop of 10% in the car mode share from the council
Given that Sydney’s modeshare for commuters entering the city centre was 14% back in the early 2010’s, that’s very unambitious. They should aim to halve mode share within 5 years, then halve again in another 5 years. That is, if they have any intention of meeting their emissions targets for the city centre.
On an annual basis, yes, there are more who drive than use PT but in some months it’s the other way around.
The changes seem to occur as other things happen i.e. when Albert St was effectively closed it caused a drop. That has now stabilised but since December, Quay St has been reduced and so that will likely over time result in a further reduction.
So if Albert St is reopened as the current plans intend, we’ll see a rise.
I find peak to be interestingly interpreted by AT. Often trains going west through New Lynn at 5.40pm are already 3 carriage. By my calculation this would be an approximately 5pm Britomart train, or typical end of day, and AT don’t feel fit to put on a six carriage train. I know it is because the return leg from Swanson does not have high patronage, but still, it hardly encourages Westies to abandon their private motor vehicles for the downtown commute.
None of the return legs have enough patronage to require a 6-car train, the decision on allocating 6-car sets is entirely down to the peak direction journey. It does seem odd to have a train leaving after 5pm that is 3-car, we had a 5:14 on the Eastern line that was 3-car and routinely left people behind at Britomart.
How long will it be until the additional EMUs arrive and all trains (except Onehunga) can be run as 6-car?
I believe the first lot roll out later this year, with the whole fleet in place by 2021.
They start arriving at the end of the year and after being completed and commissioned here, the first should be in service in a bit over 12 months from now.
There aren’t enough trains to run a full six car service on all peak departures, so they target the busiest ones. 5pm departures aren’t that busy, it really ramps up from about 5:15 onwards.
Many people (workers and students) finish on the hour. So allowing some time to get to station, it makes sense that first service
~10mins after the hour is relatively busy. Especially in Britomarts case, given the walk involved from much of the city centre. Seems to be a consistent feature of all PT systems I’ve worked in.
ItsI not just the busiest single peak runs, but the busiest sets of runs right from the time the unit enters service, through to when it returns to stabling. Sets that intersect multiple school releases on the western and southern lines carry a lot more passengers over their afternoon than ones that just do one heavy trip out if Britomart at 5:45, so they get doubled even if they’re counter peak when Britomart is busy.
None of the return legs have enough patronage to require a 6-car train, the decision on allocating 6-car sets is entirely down to the peak direction journey. It does seem odd to have a train leaving after 5pm that is 3-car, we had a 5:14 on the Eastern line that was 3-car and routinely left people behind at Britomart.
Great result, really. ~13% growth in an offpeak month means we’re making more use of existing assets. Rather than ferries, which are weather dependent, I’d suggest other bus is the star of this show: the NN continues to deliver +10% p.a. growth even though some parts were implemented over 18-months ago?
But maybe I’m biased…
Probably due to the NN parts not being greater than the whole. Now that the whole is complete (sortof) you get the whole network benefit increasing usage. There’s a bit more advertising, it’s easier to understand the network, it’s faster for most people, others are probably encouraging their friends and coworkers etc to give it a go etc.
For sure there’s a network and marketing effect. That said, all parts of NN deliver 10-20% growth over 12months following implementation. This 10% growth thus seems reasonable given its a weighted average of performance across subregions.
Key question is how long is this growth sustained? I’d guess ~2 years but could be more/less
Ferries are able to have more growth if newer/bigger/faster boats are bought. Hobsonville is getting additional services for example. I’d love to see Fullers Devonport/Waiheke special legislation withdrawn and the Kea replaced with 2x modern ferries allowing faster journeys and increased frequency.
Trains are for the most part maxed out (until the new EMUs arrive but really until CRL) unless AT do something to promote off peak usage. Likewise the NEX is also nearing capacity unless as with trains AT does something to encourage off peak usage (and counter peak usage). Might be possible to further increase capacity by introducing articulated DD buses on this. Would need to have rear door boarding though.
Reality is that most growth over the next few years has got to be from buses. More DDs, increased frequencies and hopefully more off-peak usage. Maybe make fares 25% less between 9:30am and 4:30pm + before 6am and after 7pm. Makes better use out of existing services while reducing the need for extra peak services and improving off peak frequency, all while increasing overall usage due to it being more viable for everyone.
Devonport ferries are limited by the 12 knot speed limit in the channel. The best bet with them is a double ended boat with big doors for quick boarding and turn around.
You should remember that the ferries that operate with in the central harbour area can go no faster than 5knots and that is by law [500 metres of the shore] so you can’t have faster boats on the run . What fullers need to do is build another like the Kea that way they don’t have to reverse and turn from either wharf
But not the same layout as the Kea because it’s an awful tub for the passenger experience essentially being a closed in box with unacceptable levels of noise and vibration. A modern version of the old double ended ferries would be much better.
Plus at the end of the day, “other bus” makes up two-thirds of the network usage and most of the coverage. So it has to do the leg work, otherwise we’d be failing most of the region.
I don’t disagree that buses and the NN has been driving significant ridership lift, but that’s not a new story – the reason for calling out ferries is that for most of the last year or two results have been sluggish so this result was not expeted
Eastern NN increase is good although I see it’s the lowest starting base.
Looks to me for the central city access graph (the last one) that the Active and PT mode shares combined “crossed over” with car usage, around October-December 2016 – on a 12 month rolling basis.
So, since then the modes at the top of the “priority tree” (walking,cycling, PT) that AT should be prioritising are finally getting their due by dominating the AM peaks in the CBD.
So Matt, in the future could you maybe? add a “combined PT+Active” line to your graph to help show this. As to me that’s a major plus that the majority of Aucklanders who come in the Central City Area are voting with their feet and using walking. cycling or PT to do so.
Now, if AT can hold its nerve and not simply allow unfettered private vehicle access back into the CBD, anytime soon (and particularly between now, when the Albert St works complete or once the CRL works are all done), then the car mode share will continue to drop further in the next 5+ years.
By the time CRL open that “wall of buses” problem CCFAS predicted will be very apparent. Hopefully Light Rail will be able to alleviate that problem around that time. But I’m not hopeful NZTA will be that proactive in ensuring we avoid that situation given their past love of all things Motorway.
And on the subject of additional EMU’s. AT definitely need to get their shit together – unlike last time, and ensure they place a decent “follow on” order for even more EMUs from CAF before the the current order construction is finished – to ensure we can continue to support rail growth – even if that means AT actually roll out the additional EMUs before CRL opens.
Because, it is clear that rail growth is going to only go up and up. Despite the current constrained availability of 6 car EMUs for every service at peak. And once we get CRL open then we will likely find we need 9 car EMUs to become the norm in short order – especially for the Southern and Western lines in the peaks.
So its good that CRL platforms will enable 9 car EMUs.
And those additional EMUs will never be cheaper to buy than they are today. They would have been even cheaper if AT could have ordered them a few years back when we got a good offer from CAF to do so.
So AT, best not miss that train a second time around.
I don’t think we will see 9-car trains when the CRL opens. The first thing we will see is an increase in frequency to make use of the additional capacity, only once this is maxxed out will we see 9-car trains as this will require a number of station upgrades.
I think we’ll see metro seating a long time before 9-car trains and even when they do run 9s, it will only be a couple per peak for a long time. I’ll be unsurprised to see the new units arrive with metro seating. Availability of EMUs isn’t the only limit to service capacity niw. Network and platform upgrades are going to lay a heavy burden on finances and construction capacity for a long time to come. How quickly these improvements can be implemented will be the ruling factor.
“Network and platform upgrades are going to lay a heavy burden on finances and construction capacity for a long time to come” … Any thoughts on what it would take to encourage some of the road construction sector to move into construction of infrastructure for the other modes, and of housing?
It wouldn’t take anything to encourage some of the road construction sector to move into rail, this is a space most of the big companies already compete in. As for footpaths, buslanes and cycleways; those are functionally no different to building a road.
There’s a lot of civil construction capacity tied up in the RONS projects at the moment but this will be freed up as those projects finish. Those resources could easily be reallocated to other transport projects. However that relies on other transport projects being funded, which seems to be the missing link at the moment.
True but to increase frequency you will need more trains in total, and not just dinky 3 car EMUs either to enable that.
6 car EMUs need to be the default for all services at peak (except Onehunga of course) well before CRL opens.
Even achieving that will be a step up, but once the frequency goal is met the only growth left is longer trains.
Right now, you could fill a few 9 car EMUs at peak. So what do you think it will be like in 2024?
Yes a train every few minutes going your way will help, but if everyone rocks up at 5:10pm for the Western service train from Britomart (or Aotea), people will expect to fit in.
Even at 12 trains per hour per direction on the CRL, agreed thats 1 train of 700+ people each 5 minutes if they are 6 car EMUs.
But before we get there we have to accept a limited Britomart situation with a total of 20 trains per hour over all directions – I suggest that we will need 9 car EMUs long before CRL opens to cater for the bottleneck of Britomart.
Once CRL opens then that “pressure” is relieved – a bit – but ask yourself the question – will people accept overcrowded 6 car EMUs at peak times that are leaving folks behind?
Or will they come to expect pretty fast simply that the NEXT train that pulls up in front of them is one they can get onto [maybe not a seat but certainly standing room at least] to continue their journey.
And so they’ll soon get impatient and expect not to have to wait another 5 minutes [on top of whatever time you’ve already spent waiting for this one] for the NEXT train evan at peak.
I think while folks might accept these too full trains for a short while, longer term [and not that long after CRL opens] we will need 9 car EMUs at peak – for at least some services – during each weekday AM and PM peak.
It will be a while before the 6-car trains are routinely leaving people behind, I often get a seat for me and a seat for my bag on peak services, plenty of room to grow numbers.
The CRL will ultimately allow for 18tph on the Western line so there is plenty of scope for growth before 9-car sets are needed.
I agree though we need to get the EMUs sorted so all services post CRL are 6-car.
Six car trains hardly ever get filled from end to end other than concert and sport nights. People complaining about packed trains must be the ones who get on at the first door rather than walking to the roomy other end with the sensible ones. 9 cars wontw change that.
Hi, I would show the mode shares as a single %age stacked bar per month and the total commuters counted as an overlay line. You could also add two further lines being total employed & total resident in the defined area to get a full picture of commuters by type plus commute avoiders who are actually using another form of commuting- don’t!!!
Yes, a full set of data would be good, including the residents. Some of the residents also commute out of the city centre, and it would be good to track how many of them do so by each mode.
How both incoming and outgoing mode share shifts after the implementation of parking levies is the sort of thing we can guess from international data, but given how people love to state that NZ is different, AT should be monitoring all this now, in order to be able to report what happens in a NZ city.
And counting the pedestrians – I know where the counters are, and there are not sufficient to produce reliable mode share figures. Does anyone know how they produce the information on walking mode share that fed to the graph in the board report?
To truely show modeshare you need to include traffic that passes through CMJ which of course is a major cause of congestion. Just see the queue each morning and evening from SH16 to SH1 north (which is why people do the illogically faster rat run by leaving motorway at Pt Chev to go via Westmere to Curren St or city)
Would also be interesting to know how much extrapolating goes on with the counts. Other than PT tag offs the rest are estimates based on partial counting.
Stacked graphs can be useful in some situations but I don’t think this is one of them as when you have multiple things moving it can be hard to see the relative movements of each. I had previously looked at doing one for this but decided it didn’t work well for this data.
I already have a combined PT + Active version of it but kept them separate as is useful seeing the relative contribution.
“the busway is now carrying more passengers on an annual basis than any of the lines on the rail network”
How about running trains AFTER 10:30pm Sun – Thursday then?
So many occasions I have to drive to work when I have work functions or dinners ending after 10:30pm it’s a joke there’s no trains but plenty of NEX buses operating.
Yes. And the other madness I noticed when the NN came out is that you can only organise a work function in the city centre, because the buses at night go in one direction. If you try to organise one outside the centre, there may be buses – but not into town to connect to the buses back out to people’s homes.
I’m wondering if there’s an issue of equity hidden by the ferry ridership numbers. The rise in ferry patronage for Aucklanders in January was probably people taking the opportunity of fantastic weather to have an outing to some of our island jewels. But plenty of Aucklanders would find ferries too expensive.
What options are there to use public transport for families wanting to get to really beautiful spots? From my place, it takes half an hour to drive to Long Bay. It takes over an hour and a half to take the bus. Piha, Bethells Beach, Muriwai – the Journey Planner says “Ooops no journeys found.”