Victoria’s traffic fatalities dropped by 17.8% last year, to 213. This means their traffic authority, VicRoads, is on track for meeting its interim Vision Zero target of fewer than 200 lives lost in 2020. Each one of the lives lost is an unacceptable tragedy, but the drop from 2017 (259 lives) is part of a steady reduction in lives lost, and hopefully this will continue:

(The December total was interim when the chart was made, and therefore is in red but, sadly, two more lives were lost that month.)
Victoria’s drop in road deaths by 17.8% was much better than the Australian average of a 6.4% drop.
During the 12 months ended December 2018, there were 1,146 road deaths. This is a decrease of 6.4 per cent from the 12-month period ending December 2017.
Both of these results are in stark contrast to the trend in NZ, which is heading in the opposite direction:
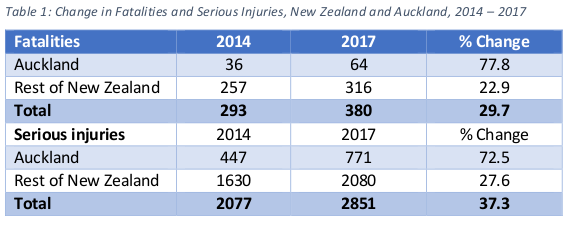
The above chart is from the Road Safety Business Improvement Review, which also says:
While Auckland remains below the national DSI per head for New Zealand (831 DSI cf pro rata 1021), this is certainly to be expected given the lower speed environment on average on roads in urban areas (most of Auckland) compared to some urban but mainly rural higher speed roads across New Zealand.
So what’s Victoria’s Secret?
There’s a lot to feel positive about when reading of shires which have seen no deaths, and the locals’ appreciation of the Vision Zero approach:
For the first time since the Transport Accident Commission started keeping track of the state’s road toll in 1987, no road deaths were recorded in the Moorabool and Macedon Ranges shires near Ballarat.
That’s a significant improvement from last year, when there were six road deaths in Moorabool and four road deaths in the Macedon Ranges. On average four road deaths a year are recorded in each municipality.
Macedon MP Mary-Anne Thomas said the zero figure for the area was a great result that showed “having a zero road toll is an achievable goal”.
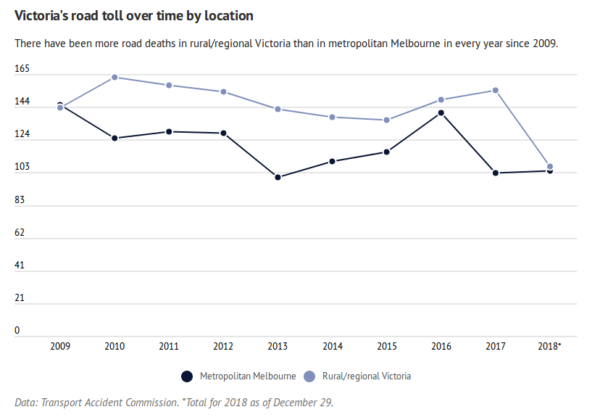
Are there lessons for NZ in what Victoria is doing? Are there lessons for urban Auckland? I thought perhaps not, when I read that the drop in Victoria last year occurred on rural roads:
Victoria is set to record its lowest ever road toll, driven by a large drop in rural and regional road deaths this year.
… but I also realised there was variation from year-to-year:
I decided – for what it’s worth – there might be some value in looking at the breakdown of fatalities for different road user categories and different location types. I compared last year’s results with the 5 year average for different road users.
The best reduction in loss of life were in these categories:
- car passengers down 26% from 46 to 34
- rural Victoria down 24% from 144 to 109
- car drivers down 24% from 127 to 97
- cyclists down 22% from 9 to 7
- urban Melbourne down 18% from 92 to 74
Whereas these road user categories aren’t seeing any gains:
- pedestrians no change at 37
- provincial towns, small towns and hamlets up 4% from 24 to 25
- motorcyclists down 3% from 39 to 38
Rather than the biggest difference being between rural and urban areas, it seems there are improvements being made in both. But there are some road users not benefiting from the changes: pedestrians, motorcyclists, and people in small towns.
I wonder if any knowledgeable readers can offer insights into the safety plans for Victoria? What are they doing to achieve the improved safety results? Are there changes planned that will improve things for pedestrians, motorcyclists, and for small towns, too? Some snippets I found as I trawled the VicRoads website were:
Side road-activated speeds, which made good sense to me, except that I didn’t see anything about a beg button to provide the lowered speeds for cyclists, and for people wanting to cross on foot.
A rule for cyclists that doesn’t add much for someone in the “interested but concerned” category:
If you are riding a bicycle or an animal (e.g. a horse), you have the option of turning right from the left lane. In this case, you must give way to any other drivers exiting the roundabout before you make your turn and exit.
And some rules that highlight safety gaps rather than help with pedestrian or small town safety:
Vehicles do not need to give way to pedestrians at roundabouts unless there is a pedestrian crossing there.
It’s clear that Victoria, like Auckland, will need to overhaul some existing conventions, and pull on all the different strands of the Vision Zero approach.
One reason for taking a look at Victoria is that this is where Auckland Transport’s new Executive General Manager Safety, Bryan Sherritt, hails from. He was employed by VicRoads for over 27 years. With a bit of luck he will bring an effective toolkit with him, and will have power within Auckland Transport to use it. I wonder what he thinks will translate from Victoria to Auckland, what he thinks needs to be done differently here because of our differences, and what he’s itching to do here that he was unable to do in Victoria.
Welcome, Bryan, and I look forward to hearing your plans for Auckland.

 Processing...
Crashes a rare events so when the total goes down everyone claims it was a result of their project, programme, policy initiative or actions. When the total goes up well obviously it would have been much worse if it wasn’t for them. My guess is there is a 50% chance our total next year will come down if we do nothing at all.
While they are rare events the sheer number of movements on the road network means the road toll is not random, it didn’t fall for 20 years by chance and it didn’t go up for the last five years by chance.
I agree though, everyone will claim their project was the one that made the difference. My view is the main contributors for the 20 year drop were rescue helicopters, safer cars and road improvements.
Agree. And my view is the main contributors for the 5 year increase were smart phones, drug use and lack of policing.
Soon you can add cars with huge built-in touch screens.
Plus vehicles with nearly zero visibility because of high ride height, high beltlines (the line along the bottom of the window glass), thick pillars and tiny mirrors. Ironically these features are mostly implemented to improve safety in the event of a crash, they just don’t help drivers avoid crashing in the first place.
I guess the more data the better, unless we’re going to leave everything up to ‘common sense’. So it’ll be good to see AT monitoring the Healthy Streets initiatives they take, including this first tranche of Safer Speeds. Pedestrian data and cycling data taken now, for example, so a comparison can be made. Would’ve been better to have years of data, or course, but that’s the state of things. They can at least put some effort into counting people in all the places they know will get changes this year, and some city wide base counts would be good too.
Straight forward stuff for an evidence-based organisation.
What about the cars themselves? The modern car is so easy to drive that even someone with very little experience can dive faster than their skills would allow in a vehicle of an older generation. They are great until you get yourself into trouble and then the lack of experience and skill becomes all too apparent.
I’d chalk a large chunk of it up to rising seatbelt use and a smaller chunk up to changing attitudes towards and greater penalties and enforcement for drink driving.
Heidi
I note that car registration cost in Victoria has been increasing for a number of years. Is there any evidence that this is leading to decreased car ownership and therefore less crashes?
I was going to say that the registration cost in Victoria at $800 per year is expensive, but I hesitated. I wonder whether NZ should also be increasing these costs in a similar fashion? Shouldn’t road users pay all the costs associated with driving? For example, is it reasonable that road users meet the cost of the $700 million being spent on road safety programmes, rather than general taxation? Why should 84 year old Mrs Peters in Milford contribute when her only weekly excursions out of the suburb are using her Gold Card to get to bridge twice a week in Takapuna and then to the Library.
General taxation does not pay for road safety programs, they are funded by fuel tax for national programs and a mix of fuel tax and rates for local programs. If ACC are involved it will be a mix of ACC levies on fuel tax and ACC levies on registration fees.
Using registration can also punish Mrs Peters of Matamata who owns a car which she uses just once a week for her outing.
“If ACC are involved it will be a mix of ACC levies on fuel tax and ACC levies on registration fees.”
except when it isn’t – and we only have to look back to last year
“The ACC proposed in September higher levies for motorists in New Zealand, which could see petrol prices increase by almost 2 cents a litre.
The Government would have to agree on the changes for the 2019-2021 levy. It included an increase of 1.9 cents per litre for petrol, part of an overall 12 percent increase in the average motor vehicle levy (including petrol and registration).
ACC Board Chair Dame Paula Rebstock said at the time the increases would substitute the growing number of claims for injuries in New Zealand, which have increased by 6.4 percent, with “more people than ever needing our support”.
Alongside increases to motor vehicle levies, ACC proposed decreasing the average levy for employers from $0.72 to $0.67 – a 6.9 percent decrease. But earners’ levy on income would be increased 2.5 percent from $1.21 to $1.24.
The Prime Minister said she and ACC Minister Iain Lees-Galloway received guidance from MBIE and the Treasury in reaching the decision not to increase the levies.”
Rebstock needs to show her working.
Is she implying that a 1.9 cent fuel increase would reverse that 6.4% increase in injury claims? That would be pretty effective. What would the accompanying numbers of deaths be? Whenever there’s reduced injuries and deaths, there’s also increased physical activity and public health due to the increase in safety. So how much did she calculate the public health bill would reduce by? How many people did she calculate wouldn’t need our support in their bereavement, in their caring for injured and unhealthy loved ones?
And then on the flip side, how many people has she calculated would need our support with the 1.9 cent increase on fuel?
That appears to be related to claims not road safety programs, I’m not quite sure what your point is there.
While ACC covers some health relatedcosts of motor collisions it doesn’t cover all of them. For example, emergency care isn’t covered by ACC, it’s borne directly by the hospital (general taxation); long term disability benefits are covered by WINZ (general taxation), not ACC. Further, healthcare costs due to sedentary lifestyles and air pollution driven by motoring are covered by general taxes, too.
Looking at the census data for 2011 and 2016 (Oh, I wish we could get our census dates to line up with theirs as they used to!):
In Victoria as a whole, and Greater Melbourne, the number of households with 0, 1 or 2 cars has decreased, and the number of households with 3 or more cars has gone up. The number of households that didn’t state how many cars they have went up too.
To put that into context, the number of people in Melbourne has increased from about 4 million to about 4.49 million. The percentage of households with one, two and multiple people has stayed the same. And the median age has stayed the same.
I’d like to see the figures for urban Melbourne.
“Looking at the census data for 2011 and 2016 (Oh, I wish we could get our census dates to line up with theirs as they used to!):”
I think given the current, and ongoing problems with the 2018 census, the Government will likely I think, need to order Stats to rerun the damn thing, properly, and do it sooner than later, so a census run in 2021 would allow a “reset’ of the census dates trans-Tasman again. Meaning the “wilderness years” of a broken data set (in more than one) covering the 2012-2020 period can be forgotten longer term.
Personally I never thought that delaying the 2016 census to 2018 as Stats higher ups proposed was ever a good idea.
Its even more annoying that its now 2019, nearly 1 year since the “online” 2018 census and we still don’t have any usable numbers from it. Must be a hell of a lot of quality problems with the data to have delayed things this much.
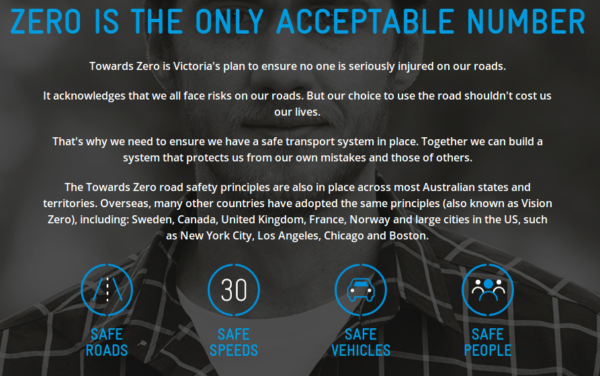
Oh, and I note that Victoria has ‘Zero if the only answer” tagline.
AT has that too – but in this case it applies to vehicle flow disruptions by safety improvements.
i.e. “Zero disruption to all vehicle flows caused by safety improvements is the only answer”.
So I think the new safety guy is pissing in the wind if he thinks he’ll get anywhere with that inherent belief embedded in ATs culture.
I agree about resetting the Census dates as you’ve suggested. I wonder how we advocate for that?
The new safety guy needs our support to make what changes he can in an organisation that doesn’t yet understand multimodal. They’ve gone backwards with the restructure, but his position was created because it was a recommendation of the safety review. So there are at least some good things coming from that.
Australia recovers a far higher percentage of user charges via motor registration then via a fuel tax. On a world scale, and compared to New Zealand fuel is cheap. This reduces the variable cost of driving so favours more distance covered per car and therefore more exposure to accident.
I think the biggest factor in their superior driving culture is that in Victoria stretching the law from “what is written” to “what you can get away with” without penalty is far reduced. They place a lot, lot more resources into enforcement. None of this NZTA crap about concentrating on education as a preferred alternative. To be fair to the NZTA their woes would not have been formed in a vacuum, but rather implementing the right wing philosophies of “small government” “freedom from government interventions” and “personal responsibility” of our last government.
Leaking Buildings, Pike River, and a rising road death rate were all symptomatic of those same flawed philosophies.
Just anecdotal, but when I was last in a car being driven in Victoria the driver was absolutely paranoid about sticking scrupulously to the speed limits. The probability of detection coupled with the stiff fines seemed to have a significant effect on driver behaviour.
Compare this with NZ where speed limits are regularly flouted, probability of detection is low, and the consequences for being say 15kph over the limit are relatively trivial. I can hear the outraged cries of “revenue collection!” already, but I reckon if NZ implemented a similar enforcement/penalty regime to Victoria it would contribute to safer speeds and a lowered road toll.
This among many other safety measures waiting in the wings too.
I noticed something similar when I was a car passenger in Illinois a number of years ago. The friend who was driving answered his phone told them he was driving and hung up. I said that sounded a bit blunt but he said they would know exactly what he meant and wouldn’t be offended at all knowing he would call back.
The fines there were clearly more of a deterrent than ours. I prefer the term ‘voluntary tax’ to ‘revenue gathering’.
Both Victoria and South Australia have record lows.
Comments by the police indicate an increase in the amount of drink and drug drive testing, and an increase in seatbelt and cellphone enforcement.
Also in the last 3-4 years the installation of 1,500 kilometres of flexible barriers, including on roads such as the Hume Freeway, had reduced serious crashes. The barriers prevent drivers veering into trees or oncoming traffic.
“Vehicles do not need to give way to pedestrians at roundabouts unless there is a pedestrian crossing there.”
There is essentially no legitimate reason to not have a pedestrian crossing on every leg of a roundabout, and it should be max one car length from the circle.
based on the numbers of deaths in rural/regional Victoria(1.4 mill) and the metropolitan Melbourne( 5 mill), we can clearly see its
1)Speed
2) Speed
3) rural people drive further distances
Would be interesting to see if the accident rate is so much higher in rural areas for the distances covered, and of course with higher country road speeds the injuries are much worse with more deaths.
In Australia there are rules around it being illegal to ‘jaywalk’. I’ve done some quick research and it seems like the rules and enforcement can vary. My experience from living in Brisbane was that pedestrians do get fined for crossing the road, and car drivers don’t expect you to do so unless you are at a designated crossing. So car drivers may not be used to pedestrians crossing streets in urban areas than here. I wonder if this plays a part?
Good post thanks.
As an aside, just had 5 major crashes on the Auckland motorways and SH1 (Pokeno & Mercer) this afternoon.
Police in Australia recently have also had more of a focus on enforcing the keep Left Unless Passing law which has a huge impact on reducing head on crashes (which are usually fatal). Wish the police here would do the same.
I just found that in Victoria they’ve used covert mobile speed cameras much more than in other states. This is thought to have reduced injury crashes and fatal outcomes to the extent that in Melbourne only 7% of crashes causing injury are due to fast speeding, whereas in other Australian major cities the rate is around 30%.
Having driven extensively around Victoria my two observations as to why their toll is better than ours are:
1) Extensive 4-lane divided carriageways. The same thing the RoNS were providing in NZ.
2) The open road speed limits are set to the local environment. Get a few roadside houses close together and the speed drops from 100 to 60. In NZ it just stays at 100.