Auckland Transport have published the ridership data for July and August and they both look positive. Here is a quick breakdown of the two months.
July
The numbers for July look impressive, particularly with non-busway buses which saw double digit growth, although some of this will be the result of there being one extra business day compared to July-17. The month also saw changes to buses on the 8th with the New Network rolled out on the Isthmus.
- Total trips – 7.9m, up 10.6%
- Rapid Transit – 2.3m, up 7.0%
- Rail – 1.8m, up 4.8%
- Busway – 496k, up 15.5%
- Other buses – 5.2m, up 13.2%
- Ferry – 437k, up 1.5%
August
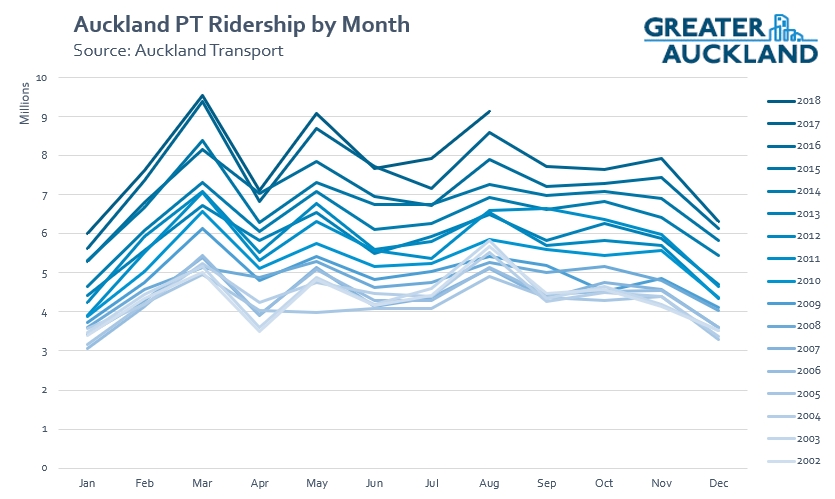
August is usually one of the busiest months of the year for PT use and 2018 has proved no exception with over nine million trips in the month. That’s the third highest monthly result after March-17 and 18. The result also comes with August-18 having exactly the same number of business days as Aug-17 so allows for a relatively fair comparison.
- Total trips – 9.1m, up 6.3%
- Rapid Transit – 2.6m, up 6.5%
- Rail – 2.0m, up 6.1%
- Busway – 542k, up 7.9%
- Other buses – 6.1M, up 6.4%
- Ferry – 454k, up 3.3%
Both of the results are positive and you can clearly see the outcome of them in the graph below showing ridership in each month.
One thing that’s been pleasing has been the solid growth in the ‘Other Bus’ category. These are the trips on buses that aren’t using the Northern Busway and still represents the bulk of PT use in the city. They’re also the trips that are most likely impacted by the roll-out of the New Network. Over the last year, just under 62 million boardings took place on these buses which was an increase of 5.9% on August-17 but as you can see from the graph below, it wasn’t always growing like this and as recently as 2016 ridership numbers were going backwards a little bit.
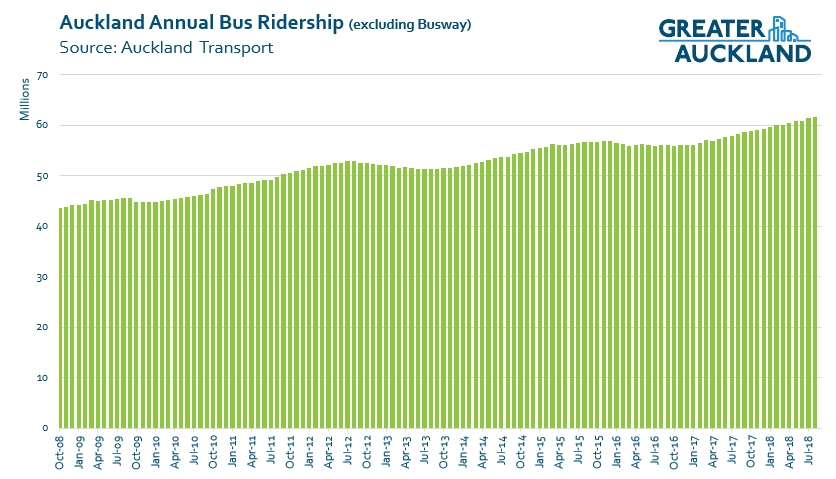 While ridership on these buses has improved, the opposite is true for the share of PT trips which as dropped from around 88% back in 2003 to around 65% now thanks to the rise in use of the rail network and busway.
It also seems like we could be seeing some growth on the rail network again after numbers have largely flat-lined this year. When combined with the other results, I wonder if the Regional Fuel Tax is starting to have an impact on numbers.
All up a good few months and total ridership has pushed the total ridership over the last 12 months to 93.7 million.

 Processing...
Thanks Matt. Do you have figures for just the Central NN? I believe you’d normally expect to see a drop in ridership initially as people adjust but then the improvements kick in a month or so later, but that this wasn’t observed in the Southern NN. I’m just wondering if there was no drop in the Central NN as well, despite the media beat-up.
Be interesting what effect the 20 min weekend rail frequencies & improved timetable have on this next month. With the regional fuel tax & oil price hikes the contribution of the central & northern new network will be less clear.
I would assume it is the rising and high cost of fuel which is more to do with crude prices and oil price speculation that is pointing people to take money saving alternatives. Currently an eye watering $2.68.9 per litre for 98 octane at most Auckland BP’s. .
And saying that I can only hope and pray that AT don’t see fit to whack fares up too.
Which brings me to the next point. As a nation, apparently, we want to do something about climate change, and we want to stop spending up large on roading. It would be logical surely therefore to encourage PT from a Central Government perspective. So why do bus operators that service PT routes subsidised by rate and tax payers have to pay Road User Charges (RUC’s)? Why are they not exempt because these buses take many cars off roads every minute of the day and that saves a huge amount of wear and tear on roads and carbon emissions. The more of this the better is the only answer!!
And as surely RUC’s are counter productive to cheaper PT and only mean the subsidies have to be made to counter that RUC’s, excluding collection and payment costs to facilitate this counter measure. Where is the logic in that?
I wouldn’t shop at those BPs then!
According to Gaspy you can get 98 for $2.38.7 at Gull Onehunga. Or $2.39.9 at Mobil Mt Wellington (after 6c discount).
pump prices are somewhat artifical as you can pretty easily get a discount thru loyalty schemes like smartfuel or supermarket vouchers. My assumption is the price gets inflated and the discounts give consumers the actual price set by the market.
I have noticed that it’s every BP I use in Auckland, city, North and West. I can’t say all as I obviously cannot realistically check every site nor would I want to, but the high octane price seems set by head office and it is.setting records and not for good reasons. Price gouging comes to mind.
Their 91 and diesel are a more competitive but and I have yet to see BP a price leader.
Get yourself the Gaspy app it has current prices from all stations near you. I think it’s a must have if you use 95 or 98 as the prices vary a lot.
I see what you mean about BP – BP Newmarket is $2.67 compared to Gull kingsland which is $2.33, how can they be that far off!
Prices for 95 and 98 have been all over the place and are where the oil companies make most of their money by price gouging ever since they all removed the prices for both grades from the main sign boards.
95 used to be only 8-10c more than 91. These days it’s more like 20+ and 98 is 25-40c more. By removing the signs people don’t know until it’s too late as they are already at the pump.
What makes it even worse is that most of the fuel efficient cars require 95 to run (small turbo engines or high compression engines).
Overseas 95/98/100 is only about 5c more than 91.
Do you also think that Transdev should be exempt from paying network access charges? Or should Fuller’s be exempt from paying wharfage fees?
The reality is that buses are heavy vehicles that do significant damage to our roads. RUC’s are the way to cover the cost of this damage.
I support government subsidies of buses, but it should not be done through removing RUC’s.
This. Heavy vehicles damage our roads even if it’s for a good cause. Plus I think you’ll find RUC’s are a small proportion of the costs of running a bus (driver wages, fuel, maintenance, depreciation etc.).
As of 1 October it will be $3030 per 10000 kms for a 3 axle bus, so quite an expense and they are far more common nowadays to increase passenger loadings.
A two axle bus is about half that amount but can be more dependent upon its weight but there’s quite a few fares required to cover that.
So they pay, then either we pay back to cover that expense or we don’t and get less in return because of it. Pretty mindless!
Or will PT operators and AT be tempted by smaller buses as a result and harm PT? Or will they only operate bigger buses at peak only severely diminishing their return on tnise units investment, making investment in them far less attractive?
What are the cost savings in smaller buses? Some capital, some depreciation and maybe some fuel?
The problem as seen with the buses assigned to link is they don’t have the capacity, which makes them a lemon, especially when in a growing PT environment, which i’d suggest we still have.
The other option is to have two fleets, one for off peak and one for peak, which is capital intensive and unlikely to happen.
It’s the same as the argument for 3 or 6 carriage trains. three was safe for the initial implementation, but i’m guessing that we’ll be ordering 6 carriage trains in 2 or 3 batches time, probably about the time a new maintenance facility is required, as I don’t think they’ll fit into the current one.
Think TCO (Total Cost of Ownership) not sticker price.
Does a 3-axle bus cause significantly more damage to the road surface than a two axle bus? If so it is important that this is priced into the operating cost to ensure good decisions are being made when procuring buses.
Does it really matter when drivers aren’t paying for the costs they impose on the rest of society? It’s not like we’re close to some sort of free market that doesn’t subsidise certain transport choices. Is there some administrative reason why not to try to effect progressive change in the way Waspman has suggested? All things being equal, which they’re not of course, if the full transport budget had to find more money for maintenance of roads because the buses weren’t paying RUC’s, could that not work as an incentive to take from the wasteful and counterproductive road expansion projects? Seems to me if fares could be legitimately lowered with the removal of bus RUC’s – on the basis that ridership would grow, the effects would all be positive – lower costs imposed on the environment and society, higher sustainable mode share, healthier population, etc.
While you are right that there are already distortions, I don’t think adding distortions is the solution. We could end up with a situation where buses look artificially cheaper than rail if it is still paying track access charges, meaning we might make infrastructure decisions which are not best in the long term.
If PT needs a bigger subsidy then it should get one across the board, not just a cost reduction for one mode.
Supplying roads for PT vehicles is a cost and should be recovered to preserve some integrity in the RUC regime and allow the actual costs of this service to be determined. This is a separate excercise to determining an appropriate level of subsidy. Paying both RUC charges and subsidies does invovle a degree of a money go round but does not involve any extra costs, infact administering a RUC regime with both chargeable and exempt kilometres whould introduce a costly complexity for no gain.
Yes, normally it is best if subsidies are explicit IMO. Administering for the edge cases would be costly. And we should move to proper road use charging as soon as practicable.
Yes, thanks Jezza, Don, Errol. I can see the administrative reason against removing RUCs for buses, thanks.
Just playing with ideas, there is a difference in RUCs and track access charges… we’re not trying to prioritise passenger rail over the other users of the tracks (freight) because all rail use is good, taking freight and traffic off the roads. But we are trying to prioritise buses over other users of the roads (private cars and that freight which could move to rail or which could be reduced). Apart from bus priority measures like buslanes, and direct funding of PT, are there any other financial mechanisms we should be using?
Is there a similar administrative burden of exempting buses from congestion charges, or could that be straight forward? Seems stupid to charge buses for congestion when they’re a number one solution to it…
By definition congestion charging will be based on much better data than RUCs (the system will know what, where and where), so my gut feel is that exceptions will be moderately easy to manage. For buses, set at a level that covers road maintenance with no congestion element (road pricing should replace RUCs, yes?)? Do you want to charge tourist coaches in the CBD at peak more?
It’s generally more efficient to have money go round in a circle, given they are generally just electronic transactions anyway, than to have to administer exceptions.
Pensioners, beneficiaries and public servants all pay income tax for this reason as well.
So this increase in Other Bus patronage is real and not just the result of more transfers?
Says 62 million **boardings** which was a rise of 5.9 % on August 2017.
Looks like when the new Northern Network starts later this month, instead of boarding once (911) to get to Takapuna, I’ll have to board twice (926 plus 801,843,814,942) so as to go via Akoranga Station. No doubt the stats will show a pleasing rise, concealing the fact that fewer people are travelling.
That’s some surreal bollocks being spouted there Neil!
More people are travelling, even if some people will have to connect to complete their journey using the New Network. Note that the opposite is also true: Some people now have a one-seat journey whereas they previously had were forced to connect (look at route 83 in the NN for the North Shore, for example). https://at.govt.nz/media/1977846/north-shore-new-network-map-29-august.pdf
It’s not clear to me that even if the NN is premised on underlying principles of frequency –> connectivity that this will necessarily (in of itself) lead to more connections. Of course, it may be that more people choose to connect because of the frequency that is now available, but it’s also true that some people now benefit from not having to.
I know plenty of people who now walk a little further but are really pleased because the frequency is so much better.
Based on the other NN roll outs it will be a mixture of both. However, only one NN was rolled out during this period so I imagine the majority of the increase is a true increase in passenger numbers, although some will be because of an increase in transfers.
In the December Ridership post, there are charts showing the numbers for trips, transfers and journeys. The spreadsheet that you can see if you follow Matt’s link says:
Source: Operators provided Reports (Prior to July 2014)
AT HOP (From July 2014 onwards)
Busway (Prior July 2015 NEX only)
so with AT HOP providing the data, I would have thought it would be journeys, not trips?
Pretty sure it’s whole journeys or the data is pretty meaningless.
AT primarily report boardings, unfortunately. Generally though the NN has increased both journeys and boardings, so I wouldn’t fret too much about it — and I’d expect more detailed data on central NN to become available in future months, as per earlier subregional rollouts.
Zippo, a very good question and I also would like to know the answer to this one?