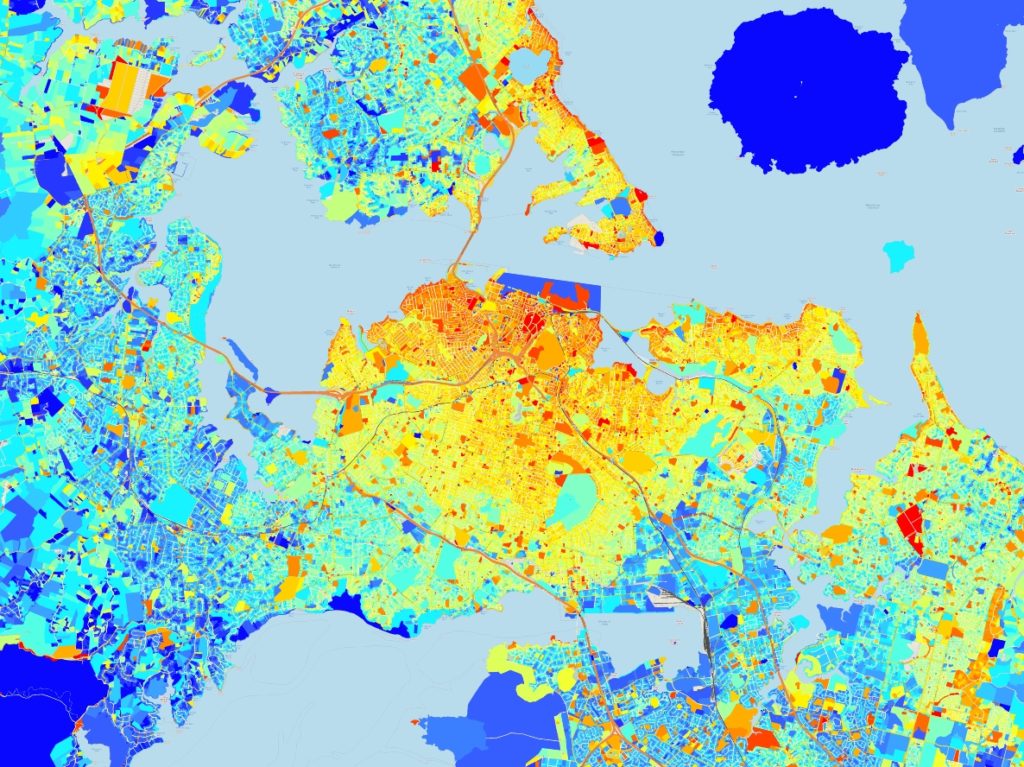
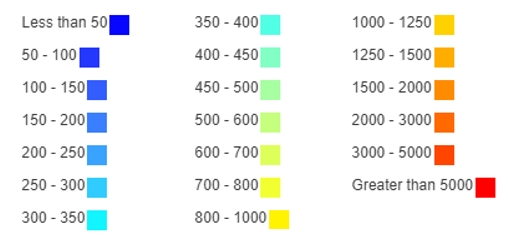
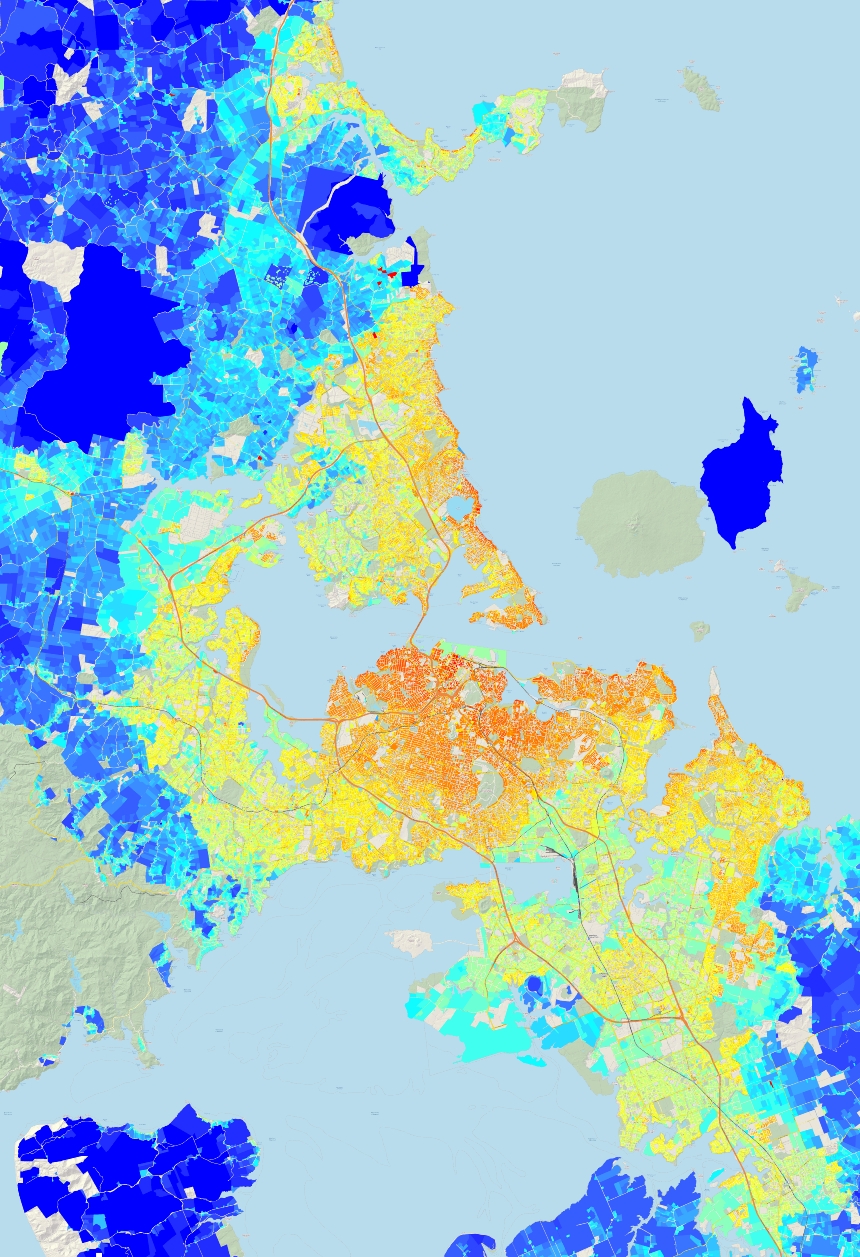
One of the neat features of the Council’s GIS viewer is the ability to put on an overlay showing the land values per m² for the Auckland Region. Council valuations are conducted every three years and the 2017 data is now able to be viewed – see the end of the post for instructions if you want to have a look yourself but aren’t sure how to do so. The 2017 valuations came on the back of a number of years of significant increases in house prices helped lead to the housing crisis we’re in.
The results are largely what you’d expect but it still interesting nonetheless. As you’d expect, the areas with the highest values are those close to the centre of Auckland or coastal land.
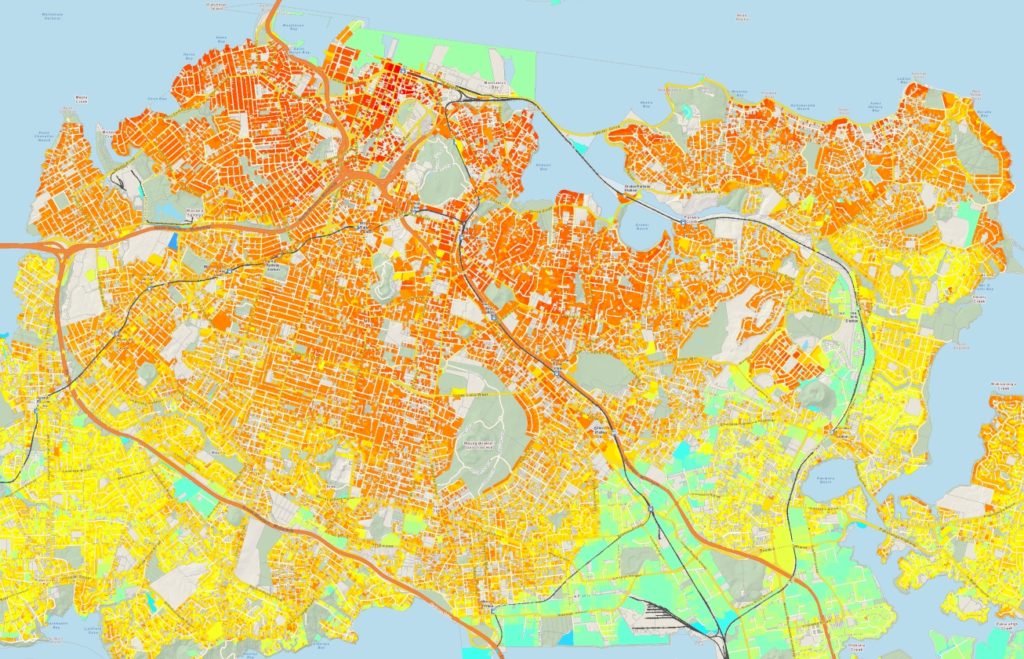
Here’s a closer look at the Isthmus. One thing that stands out to me is how the higher value areas track to the South East (around Epsom) but drop off around the western line, such as at Mt Albert. It will be fascinating to see who this changes over time once the City Rail link opens effectively shifting those areas 10-20 minutes closer to the centre of the city.
To highlight how much things have changed, it’s also worth looking back at the 2011 valuation data. The first thing to note is that the scale is slightly different and the darkest red colour maxes out at $5,000+ per m² whereas in the above maps the maximum is $16,000+ per m². So, while the overall pattern is about the same, there wasn’t all that many properties over $5,000 per m². Much of the central isthmus seemed to be about $700-1000 per m². Now those same locations seem to mainly be $3,000 to 8,000 per m².

 You can also see some 2014 versions here.
Quick GIS Instructions
In the GIS Viewer, go to themes on the blue bar along the top and go to the property theme in the middle. Then select Revaluation / the year you want to look at / the metric. You’ll need to be zoomed in to 1:25,000 or higher for it to show. To get the larger images above, I manually stitched together a lot of smaller images


 Processing...
Look at how hot Hobsonville Point is! The poster child for density done well, reflected in the land value.
The colour shows the price per sqm of land which is simply reflecting the value of the higher intensity zoning. The GIS map shows the same thing occurring on Andrew Jack Rd up at Millwater, the Fields Way area in Albany and the next valuation will show something similar for the THAB zones.
what precisely do you mean by “simply”?
The price will reflect the estimated value per sqm, which in turn reflects a combination of socioeconomic factors, such as zoning and density, as well as amenities, such as proximity to coast.
You’re both potentially right, in other words.
Because there is a zoning constraint on land and local government has created a shortage the land price now follows the zone more than any other factor in these outer areas. Each site that is allowed one house has a broadly similar value if everything else is similar. Divide that by the land area and smaller higher intensity sites will look redder regardless of whether there was an urban designer involved or not. Coastal and closer in properties will show that that trend as well after you correct for proximity. What will be interesting is if the AUP has rezoned enough land to break that governing trend.
Stonefields is also over-priced, though I don’t think that is density done well.
They certainly made it difficult to use public transport in Stonefields. That aside, in what ways do you not consider it to be density done well?
It has a community feel and people are friendly to strangers (my dog likes walking there sometimes). The yard sizes are not big, the houses are mostly brick or concrete and are a mix of densities. There’s a lot of parks as well and the place has it’s own school that kids can safely walk to.
I guess you could argue that the houses themselves near Tephra Blvd are too large, however there are many other houses that are much smaller and they now have a lot of apartments.
I personally wouldn’t buy in Stonefields, overpriced and with poor transport links. Also, how desirable will the place be once the developers infill the housing around Tephra Blvd, or The Warehouse opens on Lunn Ave?
Is it also showing that industrial and rural land is worth very little on a per sq m basis compared with residential? Shows the impact of zoning and boundaries as well as infrastructure. It also looks like there are bits of new housing that are much higher value than their proximity would dictate e.g. Stonefields and part of south-east Auckland.
Yes, and the train line out east seems wasted on most of that industrial and commercial land.
On the contrary, Heidi. The eastern line will drive up those land values. Besides There’s maybe 10,000 more houses coming in GI / Pt England / Panmure / Stonefields / Meadowbank within walk-up or at least bike-up distance to the eastern line stations. That’s not including what may happen to the NZTA corridor itself between the GI-TD Shared path and the railway tracks. Mixed development? And as Sylvia Park builds upwards, that land value is surely going the same way.
I hope so. Seems loads of opportunity.
With regard to Stonefields – There’s not much point in building to capacity there unless major work is done on the transport links. Where Morrin Rd joins Te Horeta Rd is an absolute mess – It’s as if a de facto expressway has just been dumped onto a quiet industrial road.
They need either a bike-suitable path to Lunn Ave or a serious redo of how people travel from College Rd to Morrin Rd – It’s a dangerous slog to either Panmure or GI. Going to GI is probably safer on a bike, but it’s not an obvious choice (which leads to people taking their cars).
Centralness and north-east costal are big factors. But I think people gloss over the biggest one: minimum lot size aka allowable density. Farmland you can’t legally build houses on is cheap per square metre, obviously. But a lot of the older inner sites, and the newest ones, just have more housing per metre. That makes it much more valuable per metre.
That transition from orange to yellow southwest of Mt Albert corresponds well to the hydrology of the area:
The narrow Oakley Creek catchment transitions quickly to the eastern arm of the Whau; i.e. West Auckland. Bounded by Dominion Rd Extension and Richardson Rd.
I don’t really have a point. It just stood out visually.
I reckon the 2nd biggest factor in land value is proximity to state housing – hence the lower values in Avondale, Roskill, GI, Panmure, etc.
Agree, although I would say it is the third behind proximity to the CBD and then beaches.
There are other factors too, schools, for example.
I was always taught to buy a long way away from the motorway, and on the seaward side of it. 🙂
Another correlation:
Altitude; In the Whau,the poorer areas are in the swampy bits.
The future Epsom Island is good to go for 80 m of sea level rise.
It was social failure in the way we do state housing, combined with flawed school decile zoning stigma
-Mass concentration of low income people cause ghettoization
-Low local social upward mobility. Better off old statehouse residences are no longer eligible, and forced to move out.
-Ghettoization scares away affluent resident
-School rolls with too many state house children will be stigma as low decile
-Low decile school perceive as low quality school and scares away new home buyers
-Long term low income force affluent shops and services to close down
-A lot of state house residences have anti social and criminal issues and cause trouble to the surround area
-Lack of statehouse tenant ownership means statehouse residences are not motivated to maintain the property.
-A lot of property will be meth contaminated and run down
-Rebuilding new statehouse does not solve the underlining problem. So new statehouse will depreciate quickly and become rundown in a matter of years
-The whole area slowly become a slum
-Land value reflect that
-Everybody is a loser here
The whole statehouse system is a issue
+1 to Kelvin’s assessment of state housing policies
Certainly selling off the state houses in areas that had become gentrified created a problem. Huge capital gains to be had, but it wasn’t typically by the original tenants, but by clever handling of the situation by entrepreneurs. In Pt Chev, there had been a good mix of state houses and privately owned. It wasn’t a ghetto, it was a healthy social mix. By selling the houses off ‘and being able to build more’ in cheaper areas, a gentrified Pt Chev was formed at the same time as ghettoes, perhaps, elsewhere. Instead, had they been retained, integrated with the community as they were, everything would have been fine. Perhaps their presence would have put a cap on private house prices, and this would have been a good thing.
Now the few that remain are being intensified by HNZ, but against a background of particularly vociferous protest from the gentrified locals, who are resisting the “crime” it will bring and the “devaluing of my property”. Would have been better if National had never sold off the bulk of the properties in the first place.
And I must say, the private sector certainly didn’t step up to the intensification challenge, so I’m very happy that HNZ is doing so.
+ lots
“Much of the central isthmus seemed to be about $700-1000 per m². Now those same locations seem to mainly be $3,000 to 8,000 per m²”
Says it all, even allowing for inflation.
Excessively high immigration rate and poorly implemented RMA and see what you get – a waste of precious capital being sucked into increased land prices.
There’s a significant part of that deep red covered by a “heritage overlay”, which appears to imply SHZ.
SHZ theoretically requires 600m² for a section, at this rate that’s 2 million dollars worth of land under that single house. That’s taking ‘Keeping Those People Out’ to the extreme.
how do you define excessively high?
The immigration rate should be broadly set to assist maximizing gdp per capita growth.
(NZ & Australia currently have some of the highest immigration growth rates in the world per capita which are causing infrastructure deficits & excessive increases in land prices.)
Exactly. But rather than maximising GDP per person, our immigration targets are set to ensure wages don’t rise for lower skilled jobs. In fact so wages don’t rise for any jobs.
The simple fact is that more people and the same fixed assets means fewer assets per person.
Immigration rate, or just immigration by those who look different to you? In other words, are you an equal opportunities racist?
Jon, immigration rate. The argument is economic (& environmental in terms growth of vehicle emissions). All of us are immigrants to NZ.
I’m always stunned by the expectation of our young people that the world will allow them entry. It’s built into their career plans, and they become Kiwis Overseas, despite the immigration barriers that exist for the vast bulk of the world’s population. Isn’t it nice that we are reaching out to ensure that young people throughout the world can grow up with the same set of high expectations for the opportunities that could be available to them. :/
Heidi, NZ has one the highest foreign born population components in the OECD. The barriers to entry to NZ are low.
https://data.oecd.org/migration/foreign-born-population.htm
Kiwi’s leave NZ as we have many more university qualified people than the NZ economy needs. Given the gdp/capita (proxy for income) has dropped from the highest in the world in the 1950’s – 1960’s to middle of the pack its very rational for NZers to seek out better economic opportunities.
A couple of other interesting points:
-Unitec in 2011 had a much higher value than the land around it, yet it’s now gone ‘grey’.
-Motutapu in 2011 had a higher value than Rangitoto but now Rangitoto’s gone ‘grey’ and Motutapu hasn’t. Wonder what that means – it’ll be interesting to see what happens to Motutapu in the future, being the ancestral land of people who value it. I heard the farmer there sought no permission to bury a dead cow and dug right through a mapped yet unexplored midden to do so; might be time for a change.
Looks like the newer one has just excluded DoC and council reserves. I’m pretty sure Motutapu is also owned by DOC and the farmer is appointed to manage it, so that is pretty poor form by someone who is basically a DOC contractor.
Schools and church land seems to be excluded too.
Two questions:
1) Is anyone else surprised that beachfront properties are still valued so highly? I would be too worried about the possibility of them being under water or having the ground eroded away beneath them in 50 years. Or is it just that this map doesn’t capture enough detail to show the properties right on the front line that are in danger?
2) I assume that council valuations are a fairly crude proxy for real world prices, but the trend should be about right? Are there any known examples where there’s a big difference?
There is a risk to beachfront property. The solution in some islands is to build a platform and lift the House.
An example of big difference in CV is meth contaminated house that are forced mortgagee sales in a cooling down market.
Another example would be subdividable property that appears to be not, or vise visa.
It gets even more interesting once you start looking at rates per sq/m. 🙂
what would be the value of land in the new Drury city center per sq mtr