This is a post from reader Stephen Davis. It originally appeared on his his blog City Beautiful. Part 1 can be read here.
Density is a slippery subject. Many an interesting but false factoid is thrown around about Auckland, such as that it is “the size of London”1 or “more spread out than any city except Los Angeles”2.
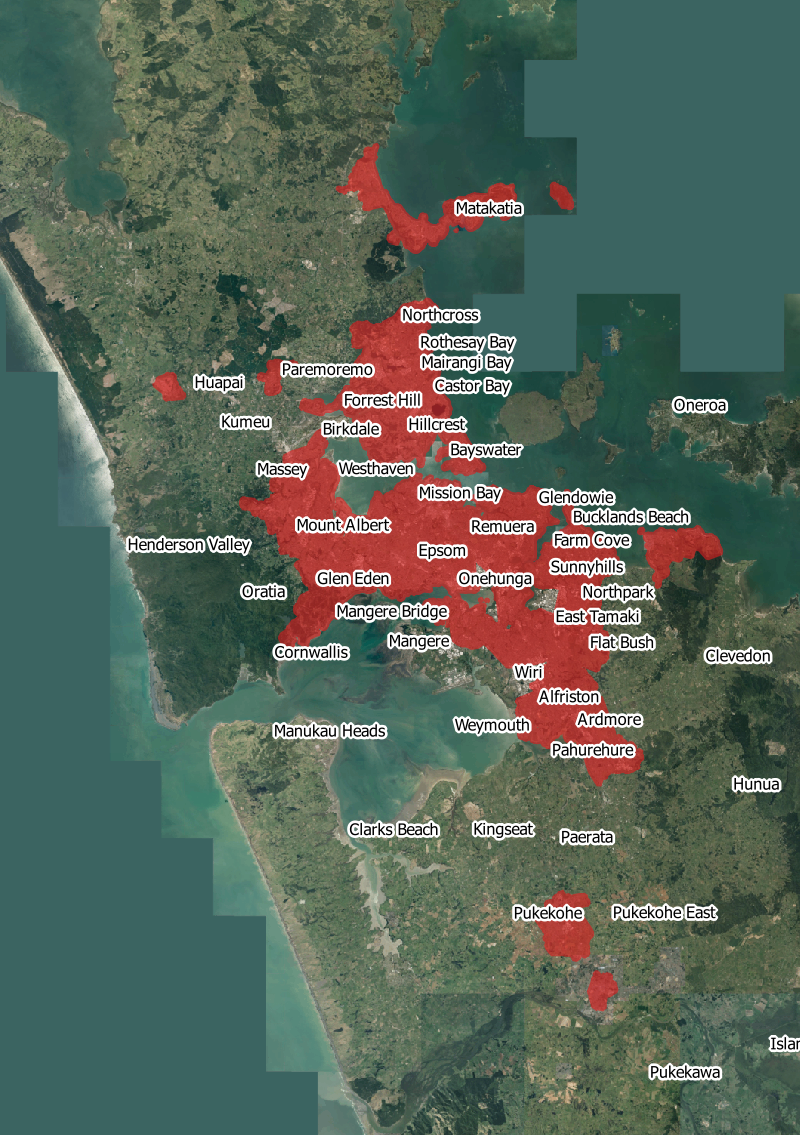
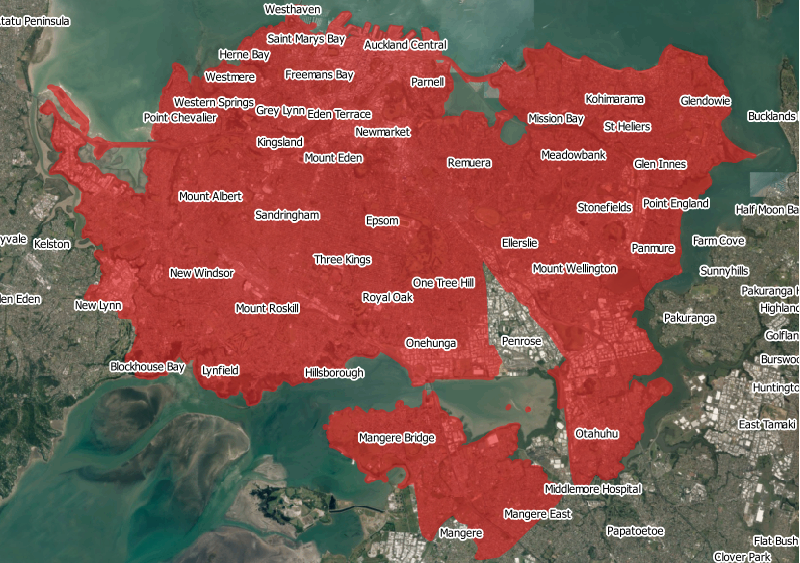
The extent of “Auckland” for the purposes of this post: it has a density of about 2,200 people per square kilometre
This is the second part in a series. A few months ago (sorry it’s taken so long), I talked about how density is defined, and looked at an alternate history, where Auckland had spread out even further than it has in reality. Now let’s look at the other direction: a more compact form, like you’d find in Europe, or, as the title suggests, Asia.
2,900
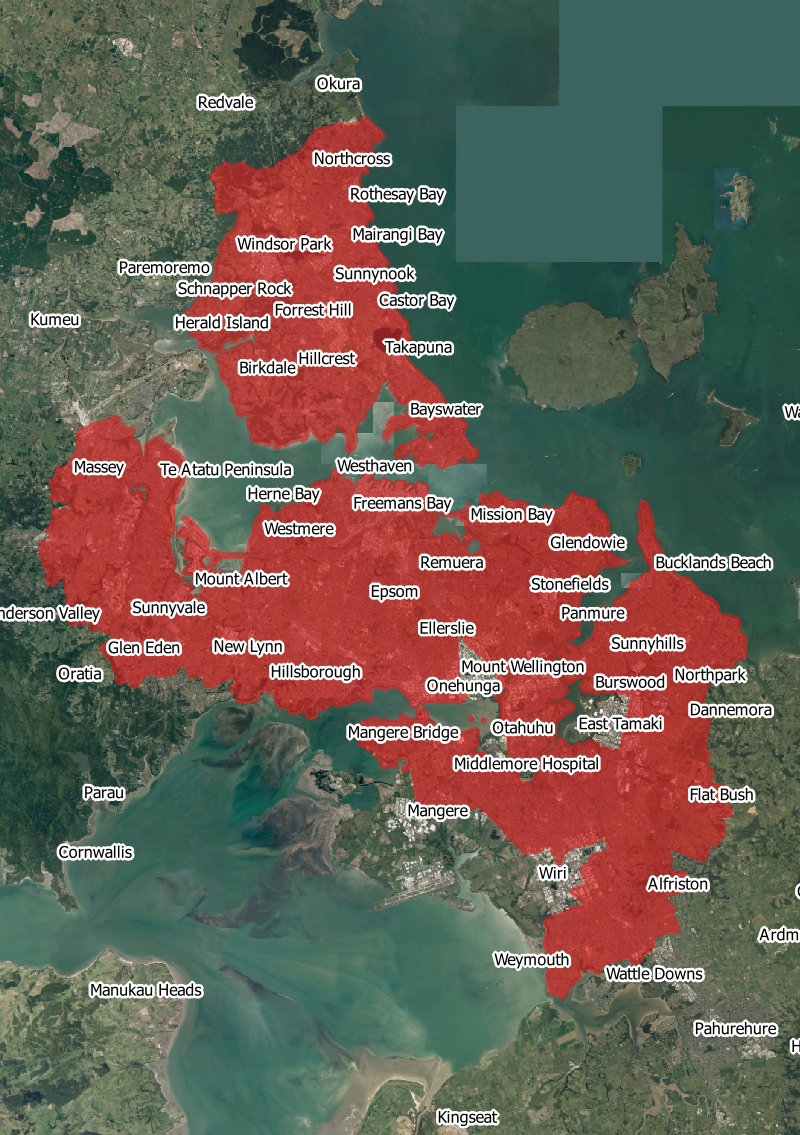
Our first step up in density is to Sydney, at 2,900 ppl/sq km the only city in Australia or New Zealand that is even denser than Auckland is in real life. It’s slightly denser than Los Angeles (2,700 ppl/sq km) and a little less than the urban area of Amsterdam (3,200 ppl/sq km).
Sydney is pretty similar to Auckland in most of its form: a few main centres with high-rise towers, and a large suburban area of detached houses. The major difference you would notice is that, especially in the innermost suburbs, you are more likely to find two-storey terraced houses.
If Auckland had followed suit, the main effect is that the commuter exurbs are no longer necessary. While they might still exist as small rural towns, Pukekohe, Papakura, Orewa, Whangaparaoa, Kumeu and so forth are not large parts of the Auckland commuter belt. The edges of the main urban area have also contracted slightly.
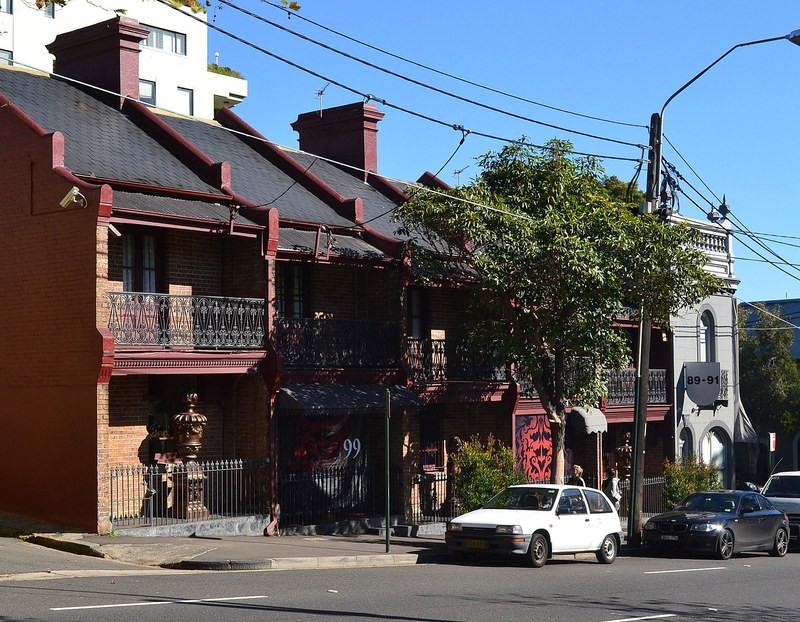
Terraced houses in Sydney. Image: Wikipedia User Sardaka
3,800
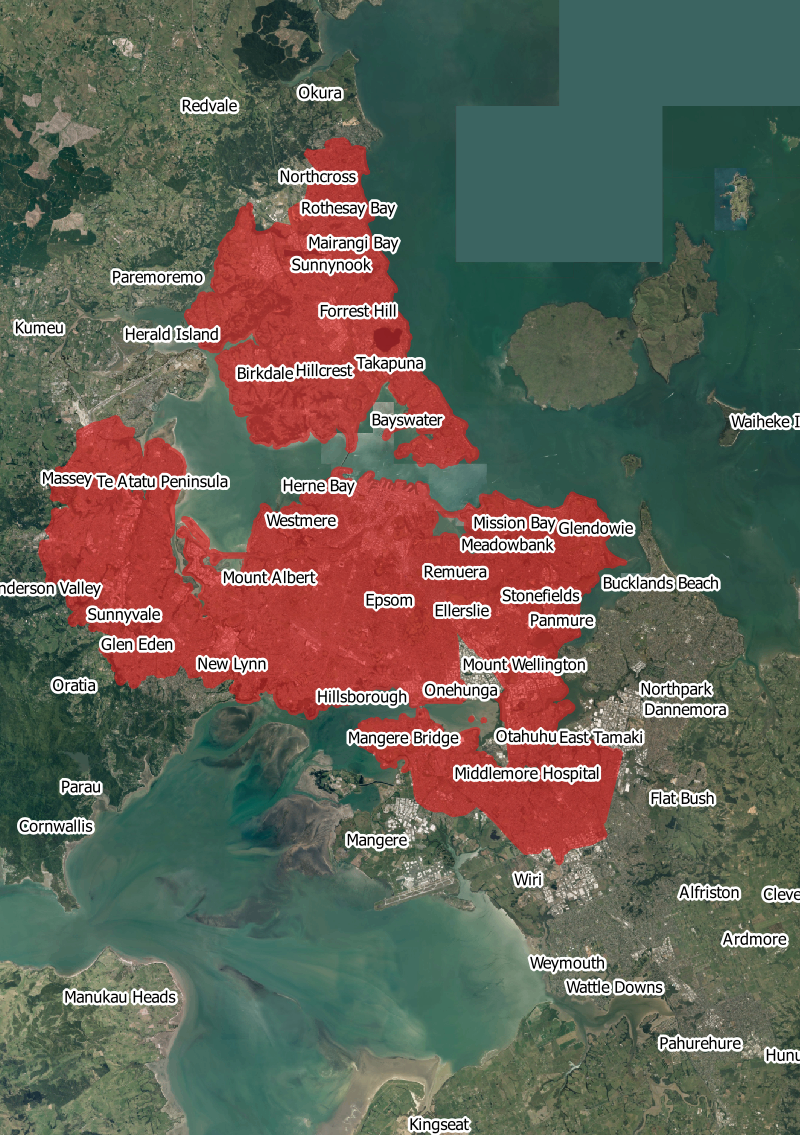
Next stop: Paris. 3,800 people per square kilometre. The tourist-laden central city is only a fairly modest part of overall Paris, but the suburbs are still somewhat suburban. It’s also a fairly desirable place to live and travel to, so being a little less than twice as dense as Auckland and having not quite as much natural scenery doesn’t seem to have hurt it that much.
Paris is also interesting, in that the core has very good public transport, but much of the suburbs are highly dependent on cars, or in poorer areas, there is simply little opportunity to be mobile at all, and as a result, high unemployment.
Paris is currently in the process of expanding its rail network to more of the outer suburbs.
If Auckland were the same average density, there’d be nothing east of the Tamaki River or south of Manukau, and we contract a little bit in the farther suburbs of the North Shore and former Waitakere City.
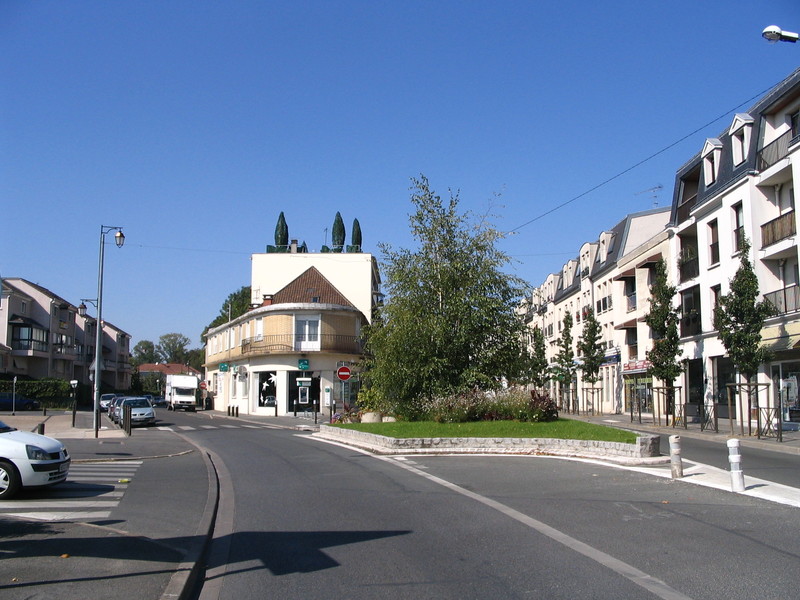
Gournay-sur-Marne, in the outer suburbs of Greater Paris. Its density is about the same as the average for the greater Paris region as a whole. Image: Wikipedia user Benjism89
5,200
This is about halfway between the city proper of Amsterdam (4,900 ppl/sq km) and Greater London (5,500 ppl/sq km). The latter includes most of London’s “suburbs” and a little green belt, but doesn’t include some parts of the Home Counties that are still dormitory communities for London commuters.
London is the European city New Zealanders are most likely to be familiar with. It’s similar to Paris, with a tourist-clogged central area but with relatively unknown suburbs providing most of the places people actually live. The suburbs are dominated by terraced or semi-detached houses on fairly small lots: apartments are still fairly rare.
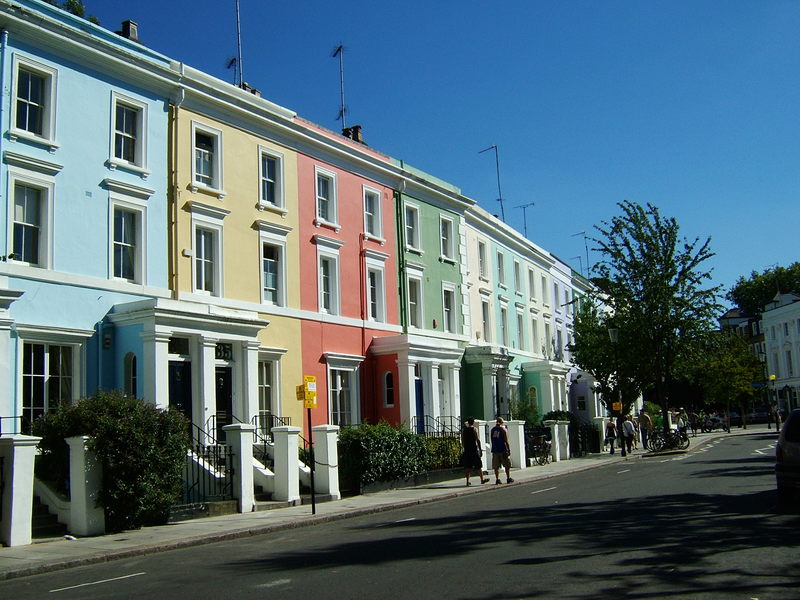
Notting Hill, London. Image: Flickr user S Pakhrin
Central Amsterdam is also dominated by terraced houses or small apartments: generally a four or five stories, taller than most of suburban London at two or three. However, with larger lots, larger private courtyards, and its famous canals, the density is actually lower than Greater London.
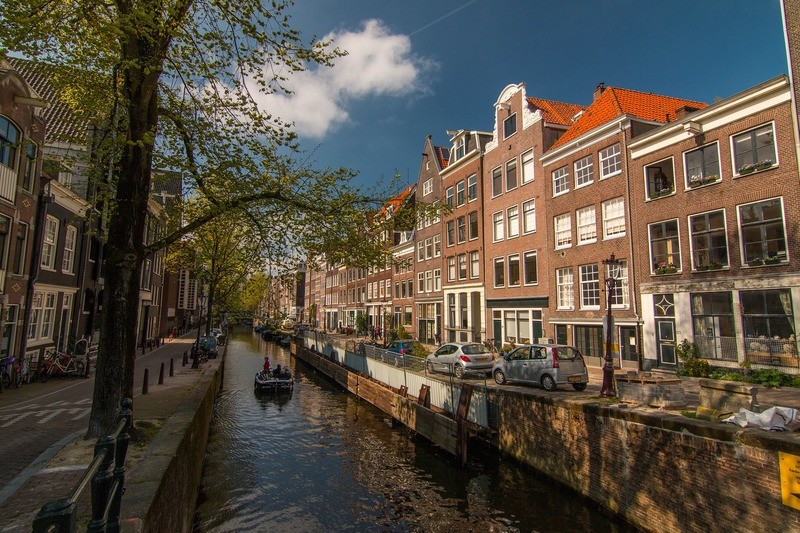
Amsterdam. Image: Pixabay user neshom
7,700
Okay, let’s stop messing around with namby-pamby European cities and get somewhere serious. Singapore (7,700 ppl/sq km) is fairly uniformly dense, a city that takes up almost all of the land inside the country’s tiny borders. It’s technically denser than the entire Special Administrative Area of Hong Kong (6,500 ppl/sq km), but that latter figure is entirely misleading. Most of the area of Hong Kong is in the New Territories, and not urbanised. The actual Hong Kong is far denser, as we’ll see later.
Compared to the European and even Australasian cities we’ve looked at, Singapore is fairly new, and very heavily centrally planned. Most of the built form dates from after World War Two, and more than 80% of Singaporeans live in housing schemes built by the government’s Housing and Development Board. As a result, the city is dominated by large apartment buildings, on the “tower in a park” model popular in the mid 20th century. The city has a generous network of wide roads, and efficient subways, but provision for walking varies considerably.
Singapore is probably close to the mental model many people have of a dense city: lots of high-rise buildings, not much private space. However, because high rise buildings are also generally spaced farther apart, the density is often similar or less than cities with closely-packed but shorter buildings.
Singapore is probably the densest large complete metro area in the world, thanks to being so very contained within its national borders. From here on, we’ll only be looking at parts of cities.
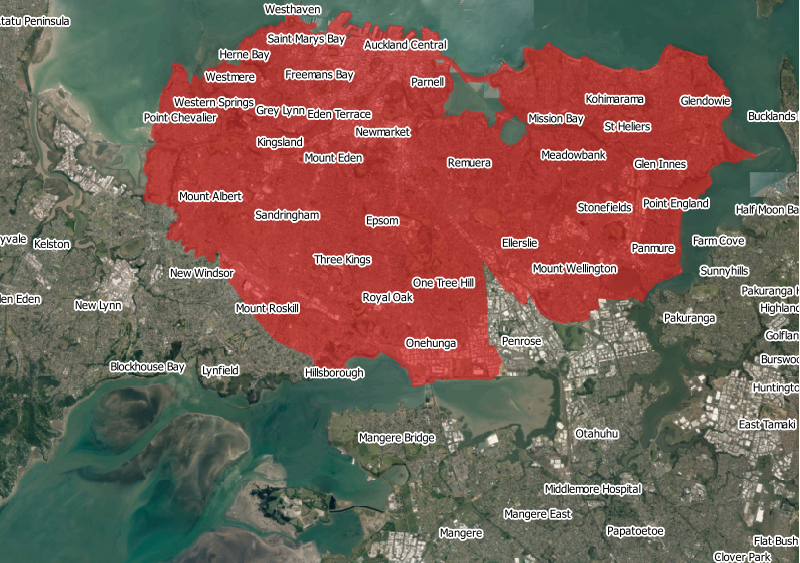
An Auckland at Singapore densities is only slightly larger than the old Auckland City Council area, the main part of the isthmus.
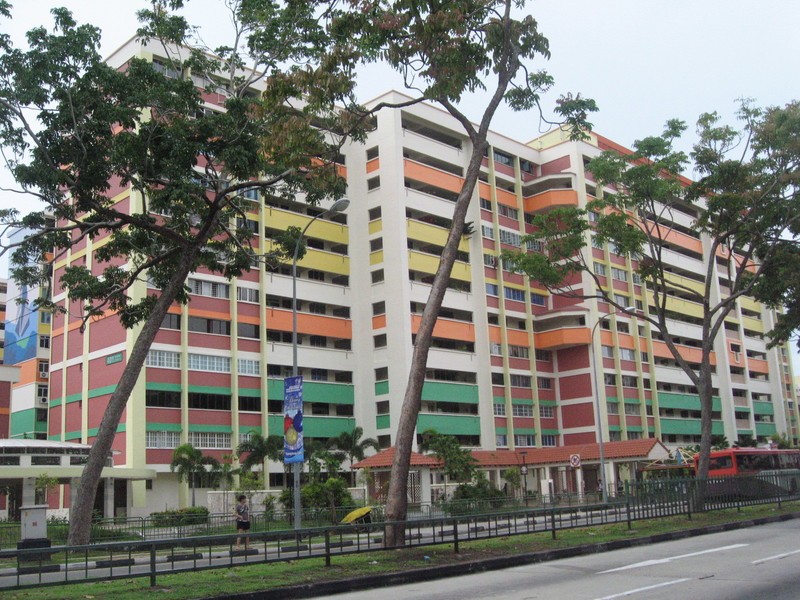
Singapore. Image: Wikipedia user Terence Ong
11,000
Our next stop is somewhat surprising: real life Auckland. Or rather, the census area unit that makes up the half of the city centre west of Queen Street. The varyingly dire apartment blocks of Hobson Street. Sky City. A lot of it isn’t residential at all: some of our biggest office buildings are here, and a large area of low-rise retail around Cook Street and Victoria Park. (This doesn’t include the waterfront itself).
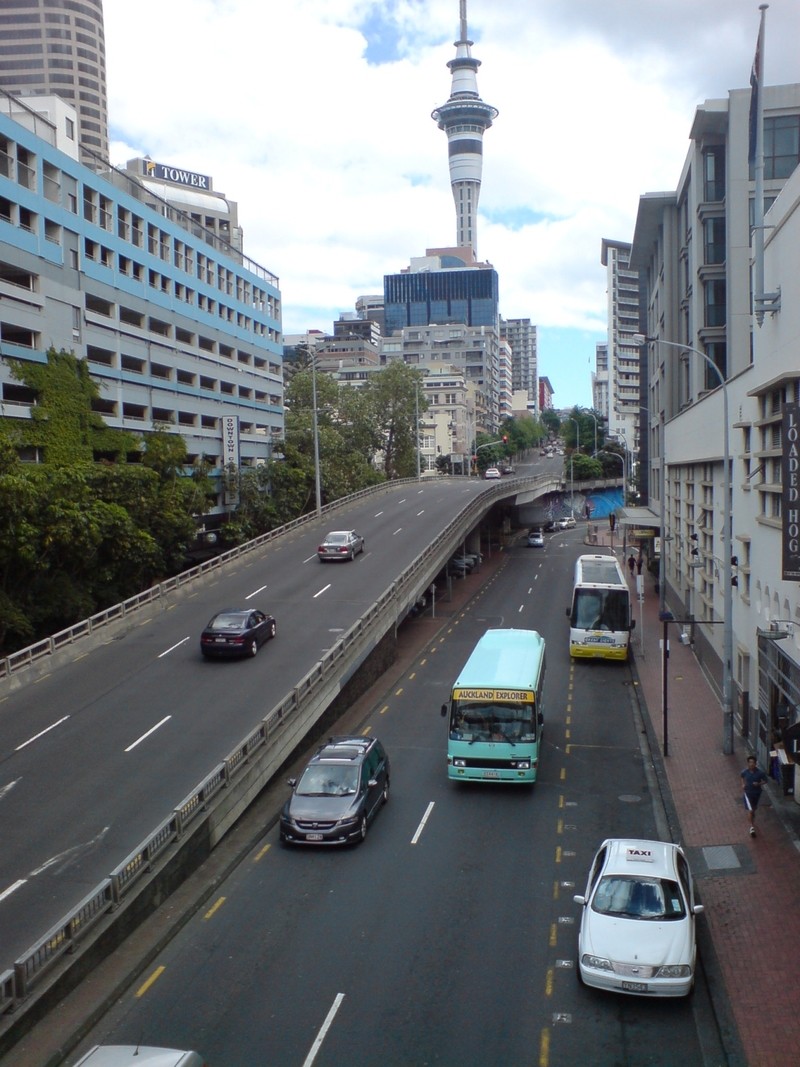
Auckland’s Hobson Street. Image: Wikipedia user Ingolfson
It’s also pretty well exactly the same residential density – 11,000 ppl/sq km – as the City of Westminster, the heart of inner London3. This shows pretty well that density figures alone do not tell you a lot about the feel of a place4. Central London is a very different type of place to particularly the western half of Auckland’s CBD, while also being full of major tourist attractions, some large parks, and significant employment.
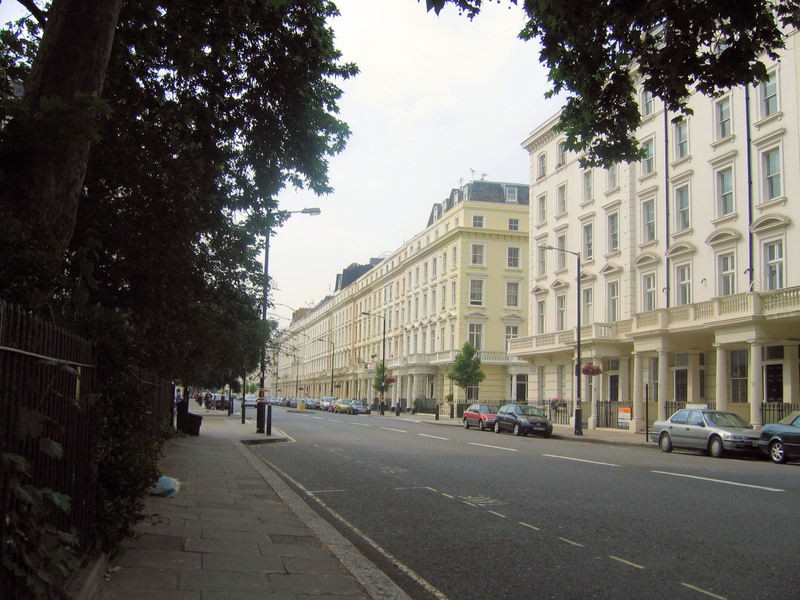
Affluent area in Westminster, London. Image: Wikipedia user Don Joseph
15,000
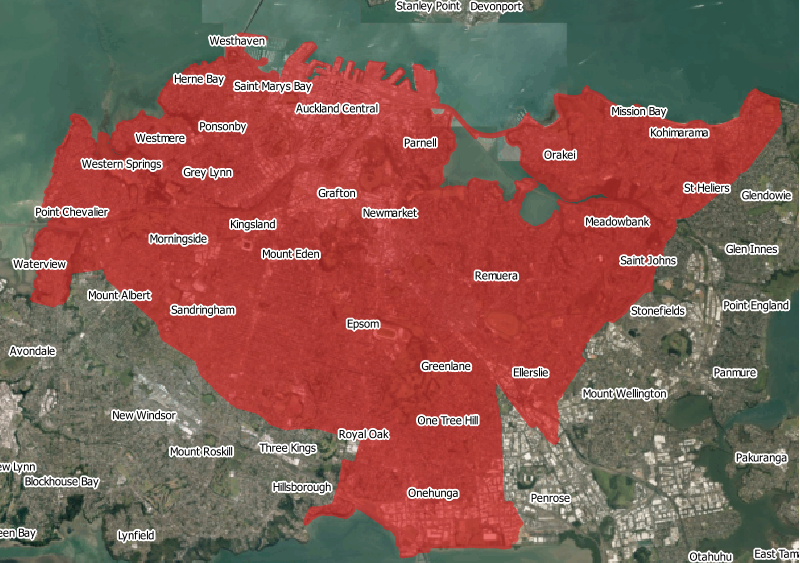
15,000 people per square kilometre would give us the New York borough of Brooklyn, or the 23 Special Wards of Tokyo. It’s a little less dense than Hong Kong Island at 16,000 ppl/sq km, or the city proper of Paris at 21,000 ppl/sq km.
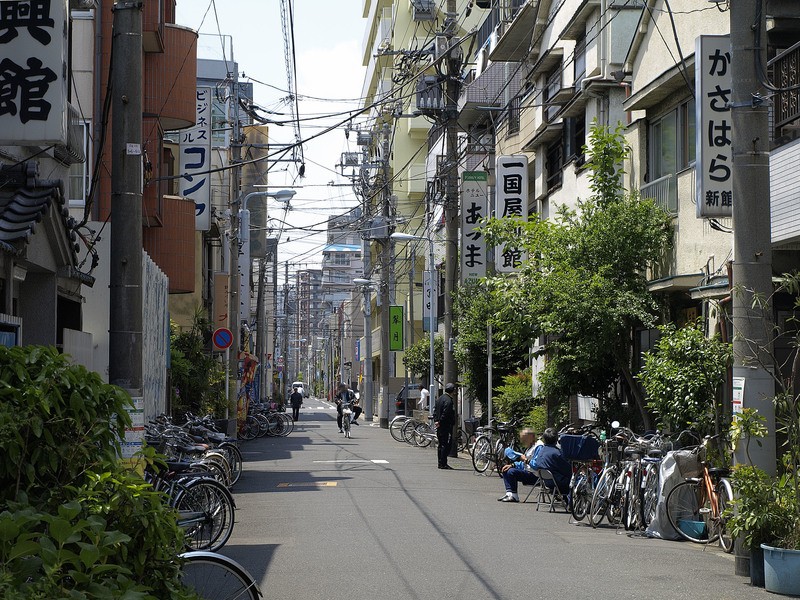
Street in Taito ward, Tokyo. Image: Wikipedia user Kounosu
Once an area is at about this density, cars start to become impractical, no matter how much effort it put into making driving easy. Most world areas at this density have well-developed public transport systems, or are small enough to simply walk across.
An Auckland with our modern-day population at this density would cover, coincidentally, about the area that was served by Auckland’s tram network at its height.
27,000
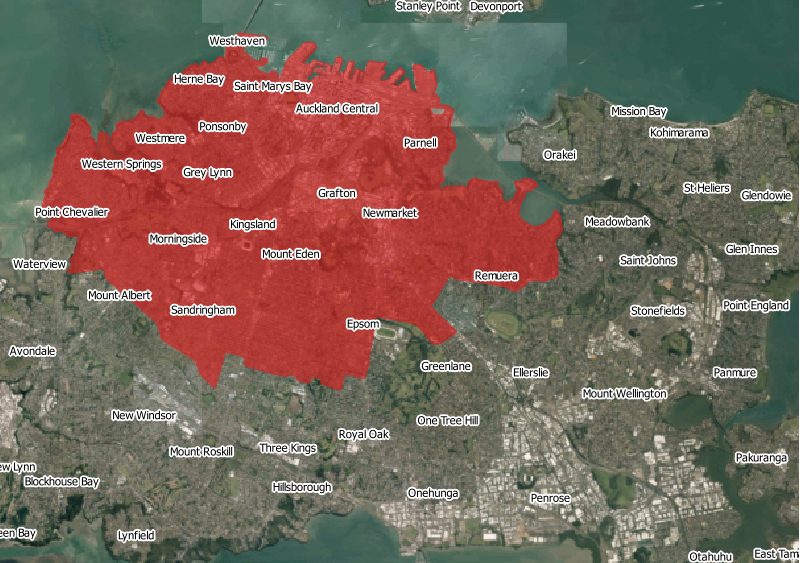
27,000 people per square kilometre: the density of the New York borough of Manhattan, one of the most famously dense places in the world. Almost the entire island’s residential space is in apartment buildings, often around six to eight stories, but with several large areas dominated by high-rises. It’s a good illustration that height isn’t everything when it comes to density.
A Manhattan Auckland would be a place you could walk across in about an hour: it’s also approximately the size the city was in 1915. For reference, real-life Auckland in 1915 had a population of about 130,000: giving a density of around 3,000 people per square kilometre.
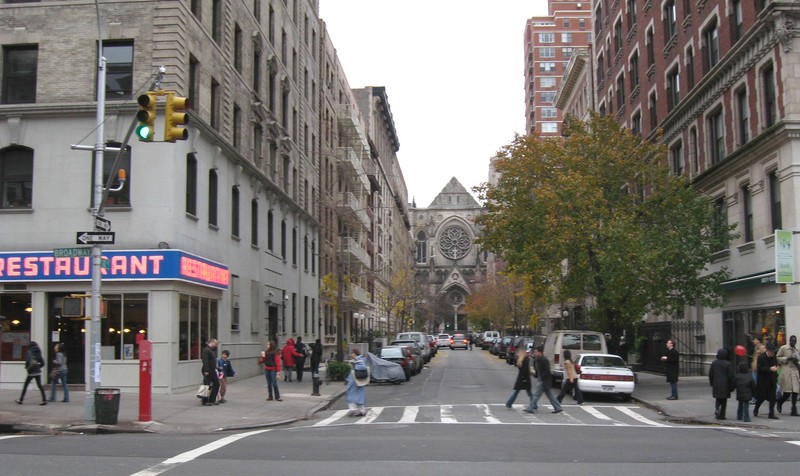
Manhattan. Image: Wikipedia user Jim Henderson
Hong Kong and beyond
Phew! That’s quite a range. But we’re not quite done. There are parts of cities denser than Manhattan. The densest part of modern-day Hong Kong is Kwun Tong (51,000 ppl/sq km). The densest I could find anywhere in the world is Lalbagh Thana, in Dhaka (168,000 ppl/sq km). An Auckland at that density would cover roughly the CBD and Ponsonby.
In general, cities are only this dense with very crowded living areas: lots of people living in small apartments, or informal settlements with little outdoor or public space.
But the densest city that there’s ever been, as far as we know, was the Kowloon Walled City, in what was then British-controlled Hong Kong. The Walled City grew rapidly from 1945: due to a complex legal history, neither China nor Britain could technically exercise control over a relatively small, 2.6-hectare area, a former fort. It became a popular destination for refugees and other migrants from China, not allowed into Hong Kong proper.
It was lawless – controlled by the triads, with almost no police presence or government regulation. Most residents didn’t engage in crime or drug trafficking, but all sorts of businesses that would prefer less regulation flourished. Unlicenced dentists and doctors, particularly liked the city, as there was no threat of prosecution if anything went wrong.
So there was no-one and almost nothing to stop the city being developed to near the limits of physical possibility: tall buildings jammed directly next to each other. The only limit was the flight path of Kai Tak airport: buildings generally topped out at 13 to 14 stories. At its peak in 1990, there were 50,000 residents, which equates to 1,923,000 per square kilometre, nearly a thousand times denser than present-day Auckland.
After China and Britain had agreed on terms to return Hong Kong to China, and settled their dispute over the governance of the area, the Walled City was cleared in 1993.
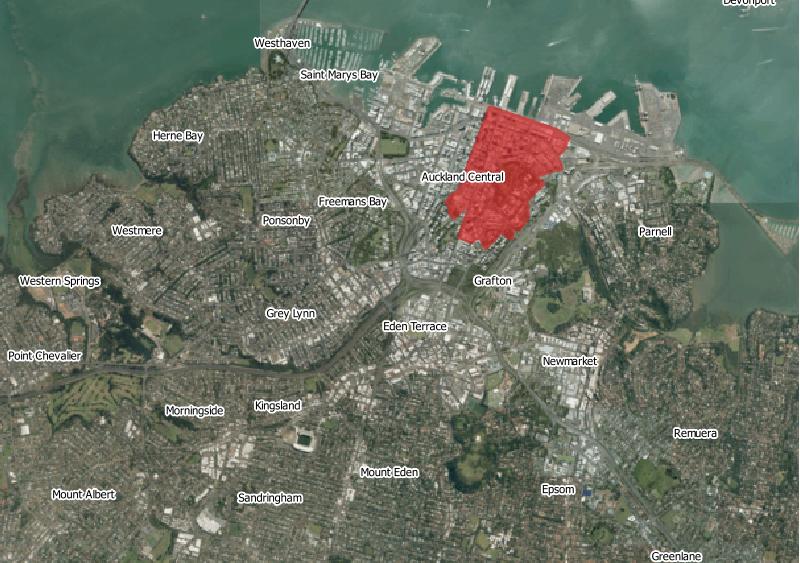
If Auckland were that dense, it would house all 1.3 million Aucklanders (circa 2013) in an area about one-third the size of the current CBD. Most of them wouldn’t see the sun much.
Photographs still survive of the Walled City, but it’s difficult to get a sense of it from inside. There simply isn’t enough room to see very far. Buildings are also so close together that streets don’t really exist: they are more corridors, with no access to daylight.
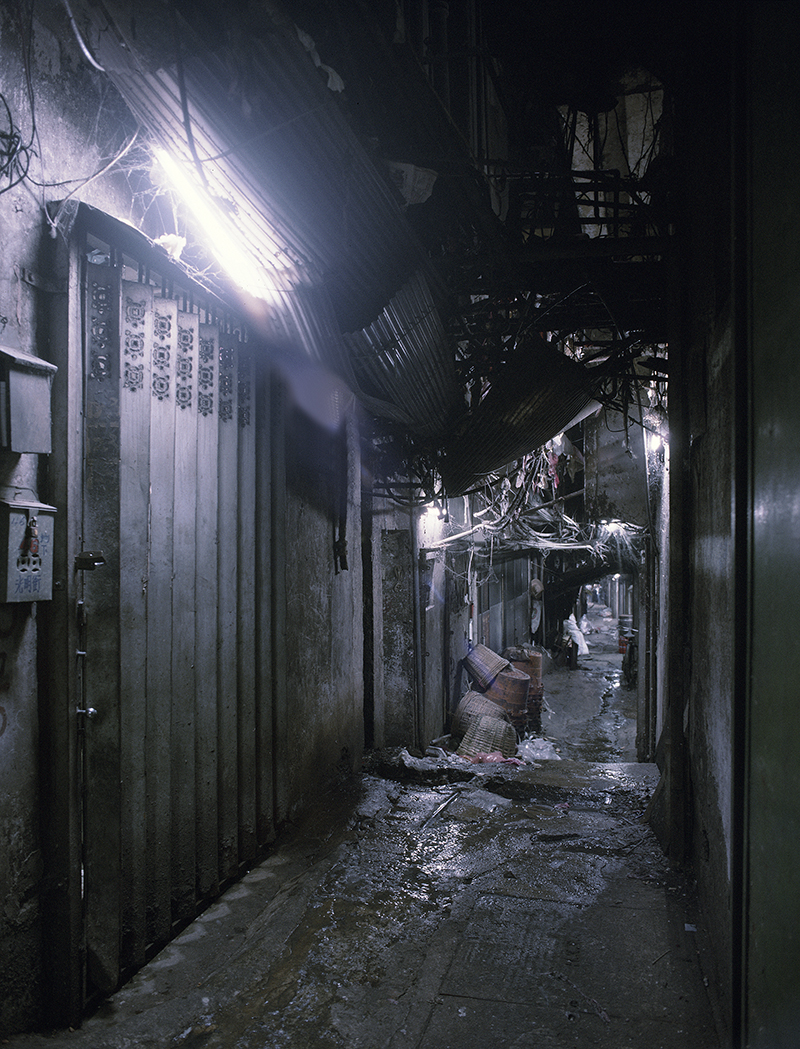
An alley in the City of Darkness. Image: Ian Lambot
You can only really visualise the sheer compaction of people and buildings from outside. In this photo, the city’s boundaries are precisely at the building frontage you see. The buildings continue, packed that close together, the entire depth of the city.
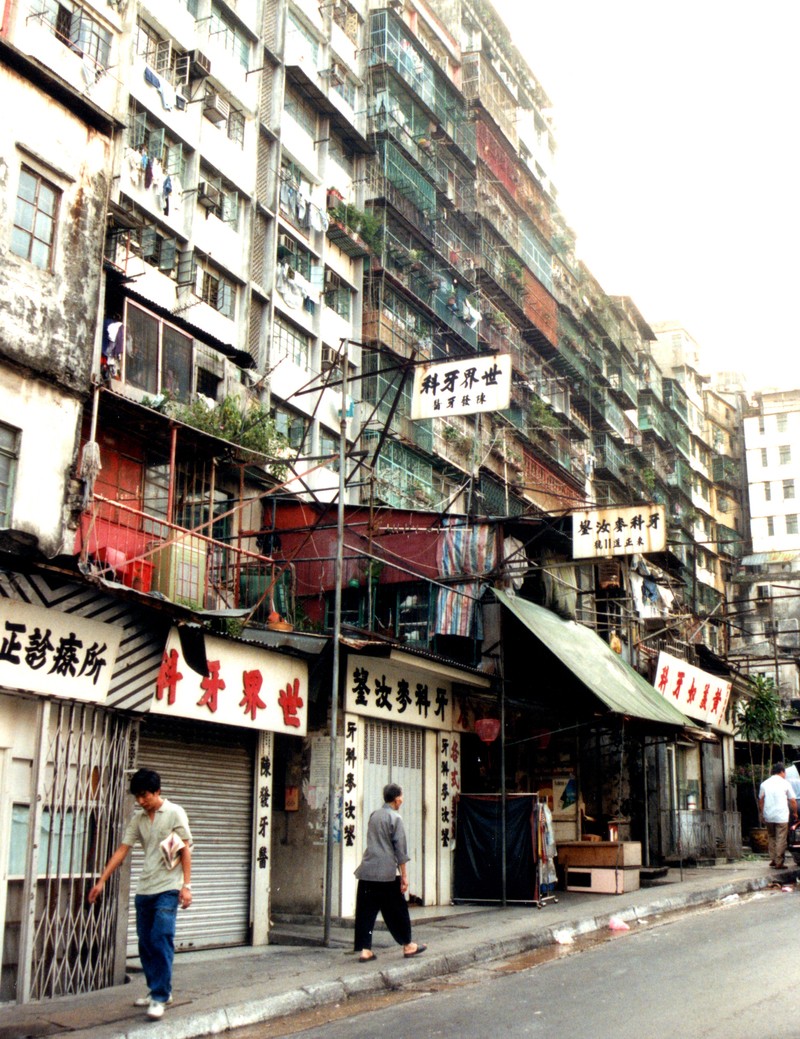
Kowloon Walled City, from outside. Image: Roger Price
It’s a horrifying but fascinating place: you can read more about the Walled City, and see more photos in these articles:
- My New Life in Asia – The City of Darkness
- CityLab – Rare Maps Show Life in Hong Kong’s Vice-Filled ‘Walled City’
- Curbed – Mapping the Horrors of Hong Kong’s ‘Lawless’ Walled City
- Elsewhere Journal – Extract from ‘Fallen Glory’ by James Crawford
- Greg Girard
What could it all mean?
After all that, I think the most important thing to note is that despite the maps and “representative” photos we’ve seen, cities are not actually a uniform density. Most cities have a range of neighbourhoods of different densities.
For residents looking for somewhere to live, this is generally a good thing: those who want to be close to goods and services and jobs and other dense central city perks, and are willing to have a little less space or closer neighbours can do so. On the other hand, there are also options for people who want to have more elbow room at the expense of having longer trips to places of interest.
There are a few cities that expect everyone to live in a similar way, particularly cities in the English-speaking New World that often only offer a certain type of suburban lifestyle. Other cities like Singapore have such extreme space constraints that most people can’t afford anything but a small apartment. But one size never truly fits all.
- About a third the size of London, in reality. ↩
- Auckland is actually less dense than Los Angeles, but Los Angeles, surprisingly, is the densest major metropolitan area in the United States. Think of New York and you think of Manhattan, but the overall metropolitan area of New York is far more dominated by detached houses on large sections in places like Long Island and Westchester County. Los Angeles, on the other hand, has apartments and detached houses on small lots for mile after mile, until stopping dead at the mountains. ↩
- The traditional centre of London is Charing Cross, in Westminster, where road sign distances to London are measured from. This, along with most of the other major central city features, are in Westminster, rather than the geographically small City of London itself. ↩
- Or its “amenity”, if you will. ↩

 Processing...
There is something wrong and a bit shonky about your density figures, in some places. Not sure where you are getting them from, but sorry to say, some of your calculations are way out of whack. Take this:
“It’s slightly denser than Los Angeles (2,700 ppl/sq km) and a little less than the urban area of Amsterdam (3,200 ppl/sq km).”
I just flat out do not believe that is true. LA has massive amounts of roads and parking lots and freeways, and does not really go for any sort of multiple story housing – most people there live in spaced out detached dwelling suburbs. Auckland actually has a lot of infill housing already, but room for more. But Amsterdam is densely packed with numerous people on numerous floors, as well as very thin streets and roads and yes, some skinny canals as well.
If you are taking figures from Wikipedia, involving overall gross metropolitan densities, these are effectively wrong. They include things like parks etc within city boundaries. You need to look at finer grained urban analysis and I think you will then find that the figures are much different.
Sort of proved the point when you said that New York figures included the whole of Long Island etc. If you are talking New York, then common sense would say confine that to Manhattan, Brooklyn, Queens etc, and not the rural hinterland.
I agree, Guy. Of course, it depends what you mean by “Auckland”, or “London”, or “L.A.”. Legal definitions, or the practicality of the built-up areas. The biggest problem in New Zealand is the fact that we have become accustomed to detached houses surrounded by gardens. This is becoming a thing of the past, apartment-living is becoming more accepted, and life too busy to allow us the time to look after extensive gardens.
But the comparison is all of Auckland, including it’s suburbs and satellites. If you are going to compare to just the densely urbanised inner boroughs of New York you’d have to compare to just the densely urbanised inner suburbs of Auckland.
Long Island isn’t rural hinterland, it’s solid suburbia.
“Sort of proved the point when you said that New York figures included the whole of Long Island etc.” The only point that proved is that the post compares cities properly. Long Island is as much a part of New York as Orewa is a part of Auckland.
That figure for Amsterdam is probably a mistake. The figure on Wikipedia for the municipality of Amsterdam is about 5000 people per km². There’s no way the Netherlands will ever build an urban area with a density as low as 3,200 ppl/sq km. Land just isn’t that plentiful over there.
What you often see in Europe are more fractal settlement patterns. The hinterland of a city is usually a smattering of smaller towns and cities. In contrast a New World city like Auckland just spreads out like an ink blob.
This is the municipality of Amsterdam:
→ https://www.google.com/maps/place/Amsterdam,+Netherlands/@52.3391118,4.6261176,30631m/data=!3m1!1e3!4m5!3m4!1s0x47c63fb5949a7755:0x6600fd4cb7c0af8d!8m2!3d52.3702157!4d4.8951679
Look closely and you’ll see that this includes a large seaport and some agricultural land. Zoom out a bit, and you’ll see the difficulty of figuring out just how much land is covered by urban areas.
I’ve included figures for Amsterdam twice: once for the overall urban area (3200) and for the city proper (4900). This goes for most of the cities I’ve included. Everywhere less dense than Singapore is for an entire metropolitan area, to the edge of the built-up area of the city. Everywhere more dense is a particular district within a city, either the city proper, or some other local government boundary.
These figues are from Wikipedia, which at the time I wrote most of this article last year, were similar to OECD and Demographia figures which I also checked (not all cities had both available, hence the choice of Wikipedia as the only source to have comprehensive data).
Los Angeles is a particularly good example of what you can actually learn from density figures. City centres are generally only a small part of the area *and population* of a metro area. The overall density depends far more on the character of the suburbs than the downtown. And Los Angeles may be heavily suburban, but it is relatively dense suburbia: small lot houses, dingbats, low-rise apartments, duplexes and triplexes and four-packs. New York is far more than just Manhattan, and well before you get to the boundaries of New York City the high-rises have stopped and the city turns into very low-density suburbia, which goes on for mile after mile after mile into two different other states, and most of the way up Long Island.
If you think New York’s metro area stops at the end of the five boroughs, you are completely missing the point.
@roeland: density figures are particularly interesting when it comes to Europe, as opposed to cities in the New World or more recently-developed parts of Asia. European cities are often collections of villages, which have somewhat but not entirely grown together, whereas New World cities generally continue uninterrupted to the edge.
This actually makes European cities *less dense* than they would be otherwise, even if they are still denser than New World cities.
The average house is closer to its neighbours, but those fields and woods and other green belt features still space out cities compared to contiguous New World cities. Considered at a regional level, this is a real effect: commutes are longer, public transport catchments are lower, and so on. (I mean, trees are still nice things to have around).
The other effect, yes, is things like seaports and industrial parks. I’ve excluded these from Auckland. In denser cities, these tend to be at the outskirts of metro areas and thus aren’t included anyway. It’s medium-density cities where these will probably throw the figures more, but the only cities in that range (Sydney and Los Angeles) only have a small fraction of their land area as industrial uses.
Density is residents by area. This is why it is useful to look at the average density of a resident, rather than the usual measure of average density of the land.
It depends for what purpose you’re measuring density, really.
Are you suggesting that people in some areas are more dense than people from other areas?
@mfwic: I guess if you put them in water and they sink, they must be pretty dense
And if the float: Witch!
Yes for some purposes looking at the density that the average person lives in is more useful than looking at how many people live on the average square metre of land.
It takes care of the averaging effect where the Rhine-Rhur has lower average-people-per-square-metre density than Los Angeles, because they all live in dense towns and cities separated by pockets fields and forest while LA is evenly spread.
For public transport catchments it really depends. If the entire area is covered in blanket sprawl, you need to serve all of it. If it’s more a collection of villages and towns, high quality PT can still reach a lot of people if it serves a comparatively small amount of more urbanized areas. In case of Amsterdam, towns like Almere provide a much more substantial PT catchment than, say, Papakura or Silverdale in Auckland. The Dutch seem to be especially good at planning that.
And for commute lengths, even though they may be longer you often have options like intercity trains, which are a lot faster than the buses you’d get in lower density areas. Even for buses, the villages with fields in between means they don’t need to stop as often, and that each stop has a better catchment.
If you really want to look at density on a meaningful level, then you should look at projects on an individual level. There is a good series of books on the subject by a+t publishing in Spain, where they examine projects individually, and I wrote a paper on this a couple of years ago, comparing New Zealand projects to European projects. Really hard to get the data, but somewhere like the Scene apartments down by Britomart are actually quite dense – similar in levels of crapness to the new urban slums in Amsterdam (on the outskirts) like Groeneveen and Klein-Kruitberg flats in the Bijlmermeer. Not as dense as Kowloon Walled City of course (I’ve been there – it was fun! Friendly people), but then, not much is. The figures for KWC don’t include anything for roads, of course, as there were none inside – but it was surrounded by roads, and so you would have completely different results if you adjusted the boundaries of your examination area.
I talked a bit more about how density could be defined in a zillion different ways in part 1, linked at the top of the article. How to talk about density really depends on the purpose you’re measuring for. Personally, transport is my area of interest, when density is generally called into question when people ask “is our city dense enough for [particular sort of public transport]?”
‘Sydney is pretty similar to Auckland in most of its form: a few main centres with high-rise towers, and a large suburban area of detached houses. The major difference you would notice is that, especially in the innermost suburbs, you are more likely to find two-storey terraced houses.’
How old is that data? that ‘a few major centres’ has already changed significantly.
For a starting point – http://www.smh.com.au/nsw/how-crowded-is-your-suburb-how-australian-neighbourhoods-compare-to-the-world-20170331-gvaw5g.html
Also out this morning for Sydney-
http://infrastructureaustralia.gov.au/policy-publications/publications/future-cities-sydney-maps.aspx
This data is all from 2013, or as near as I could manage, in order to match the last New Zealand census.
Thanks for the post, Stephen. I appreciate your analysis – it certainly blows away some urban myths while also not surprising me overly. Far better to look at actual numbers and realise the difference between the aesthetics of different cities is not a numbers game.
Interesting article, but I was under the impression that Mong Kok had a population density of 130,000/km2. Also, where _is_ “Kwan Tung”? I’ve not heard of it and the only reference I could find is that it’s a mis-spelling of Kwang Tung, or as it’s now known Guangdong – Which is China, not HK.
Incidentally, for an excellent feel for the Kowloon Walled City check out: http://www.vintag.es/2014/03/amazing-photos-of-daily-life-in-kowloon.html
Not-picking aside, the heat maps in conjunction with the comparisons painted a rather clear message for the nay sayers that insist that we don’t need the CRL or light rail!
Sorry, that must have been a typo: I meant Kwun Tong.
Thanks for the clarification.
FWIW Kwun Tong is the most densely populated administrative district, but district is not synonymous with suburb. If talking suburb, Mong Kok in Ho Man Tin is still the most densely populated… And one of my favourite places, especially at night!
Hong Kong is complicated but awesome 😉
Dunno why I put Mong Kok in Ho Man Tin (a suburb)… Mong Kok is in Yau Tsim Mong District…
I thought the Guiness book of records had Mong Kok in Hong Kong as the most densly populated district in the world.
Interesting post. The main thing I pick up from all this is that Auckland is not very dense.
Depends where you compare Auckland to, as you can see in part 1, linked at the top.
I found this really interesting, thanks Stephen. The main takeaway for me is your well-illustrated point about density alone not explaining much about what a place feels like.
Thank you for reading and for your comment, Will!
The cause of higher density seems the most interesting part. It doesn’t look as if people created high density because the really wanted to live in a high density area. They went dense because of a constraint, whether that was because they were not allowed into a better place or because they are on an island without much developable land or maybe because it was safer to live within a defensive wall like most European cities, it seems like given a choice people go out rather than up.
I think it depends on whether you consider planning regulations to be “people” choosing to go out rather than up. I would say the going out rather than up is more a product of NIMBY planning rule development than any kind of conscious choice about overall development patterns.
What we know in Auckland is most of it is developed about as densely as it can be legally (well not post-unitary plan – time will tell whether the upzoning gets taken up). So at an individual level we are actually choosing to live as densely as we are legally allowed to.
But its no though. We know there is a huge difference between zoned capacity and amount that was taken up in the Isthmus Plan. Dominion Rd was always used as an example by the old Auckland City. The issue was never whether or not you would get consent but whether or not you could build cheaply enough to get a potential development in the money. Apartments have only ever taken off in Auckland when there was surplus land or existing buildings in the CBD once owners realised they would never get an office development to work. Or when the Council prevented out growth and made housing unaffordable. In effect the old Regional Council tried to make Auckland an island using rules. Add to that the rapid population inflow and suddenly apartments were viable.
Of course there were pockets with additional capacity but the bulk of the urban area was built about as densely as legally allowed. There was plenty of more intensive development (e.g. sausage flats etc) that was being built that actually got banned.
Nothing got banned under the old District Plan. Plenty of development was allowed that required a discretionary consent. ie an assessment of effects and a decision. Plenty more beyond that could be done as a non-complying application. That was all ‘legally allowed’ as you put it. The big change is the AUP makes a lot more development permitted so regardless of its effects you can push on and build it. Shades the neighbours living room- go ahead, clogs intersections – go ahead, overloads sewers – go for it.
It’s almost like it recognizes that it’s your neighbour’s job to ensure sunlight if they want it, and almost like it recognizes that traffic congestion is a result of regional planning decisions rather than individual small scale developments.
Whereas it was almost as if the old District Plans recognised that you were supposed to avoid remedy or mitigate your effects. Almost as if your actions could create negative externalities. But hey maybe some people want to live in dark little rotting homes with towers overlooking them and blocking natural light.
If they don’t well the Council will just come up with rules to screw up the alternatives until they get no choice.
Yes, it is almost as if the old district plans ignored the positive externalities of actually building houses and solely focused on the negatives of blocking sunlight to houses built as if they didn’t have neighbours.
Yes it is almost as if they took the view that everyone was subject to a daylight control so that everyone had to consider their neighbours needs rather than building a blank wall at the boundary and then watching as the next neighbour along did the same to them.
Agreed, what a ridiculously backwards rule that was; to say that you had to build a pretty wall that let sunlight into your neighbour’s house because they had designed it poorly. Ridiculous that we ever let a neighbour adversely effect you like that.
Yeah someone had the discretion to let you. They also had the discretion to not let you. Some sites on our road got declined for building apartments on about a decade ago because the council in their wisdom thought Birkenhead needed these sites remain derelict in case anyone ever wanted to put them to some industrial/commercial use. Then a few years ago, all that talk went down the memory hole and now apartments are being built.
SB, mfwic and Matthew: Imagine a south-facing slope. Say that development to two storeys on a small site at the top of the slope would prevent 5 possible units further down from receiving any sunlight during 9 months of the year. Alternatively, clever non-standard design would be possible to capture sun all year round on all the 6 units (eg heavily glazed skylights with insulated shutters).
Is there any development-friendly regulatory system that could prevent that hilltop development and ensure maximum use of the whole slope’s potential?
“Is there any development-friendly regulatory system that could prevent that hilltop development and ensure maximum use of the whole slope’s potential?”
I would argue that the potential is far higher than 6 units. Build a 5 story apartment building at the top of the hill and give the gully to council might get you 15 dwellings in the same space. If land is so steep that it can be blocked for 9 months by a two story building, it is too steep to develop effectively. Council could enable this by specifically enabling this sort of transfer in district plans.
If the dwellings already exist, then the horse has bolted. You’ve already developed something that is completely senseless. Sadly, it’s going to be worthless if we actually develop decent housing.
Yes, that’d be true too. Seems to me Auckland is a rather hilly place, and both damp and at times chilly, so sun is key to a liveable city with quality housing. But look around at the easier to develop sites left on the isthmus – many are on the southern slopes. The example I gave is pretty common, and there’s nothing stopping developers from sticking to what they know – low rise standalones on the remaining, shady slopes.
Intensification will probably improve transport however it is done (although any new greenfields development will be working against that), but basic good design around sun will not happen by itself.
I wonder if that building constructed in homage to a fourth world prison on Hobson / Nelson Streets, Zest, might have density statistics to compete with the former Kowloon Walled City?
KWC is a really interesting case of a semi functioning anarchy.
Very interesting post. Hope it is being read by all our councilors and planners; not that it preaches solutions but it certainly makes you think.
Is there any data on the relationship between density and urban economics? Reading “Economies of agglomeration” on Wikipedia it seems as if Auckland has only a mild advantage over the surrounding smaller towns and rural areas but most of the disadvantages which are listed as:-
1. Strong environmental pressures
2. High land prices
3. Bottlenecks in public goods (e.g. poor/overburdened infrastructure)
4. Corruption
5. High competitive pressure
6. Lack of reserve areas.
There’s another twist to all this density malarky – what system should we measure density in? Eliot Blenkarne and I go into this a bit in our paper on Density – the issue is whether you go for Planned density (as in, how many housing units are drawn up), or Actual density (as in how that dwelling is then physically occupied). As well as whether it is net or gross.
( http://anzasca.net/wp-content/uploads/2015/12/024_Marriage_Blenkarne_ASA2015.pdf ).
At the design stage of city planning, it is easy enough to work out what the planned occupancy is i.e. dwelling units / area (as in du/ha) or how many people are actually there (i.e. pp/ha or pp/km2 – i prefer pp/ha as it is more relatable). There are standard assumed occupancy ratios i.e. a 2 bed unit is assumed to have something like 2.2 people occupying it, but again that can vary with age (a family with young children may have at least 4 people in that same 2 bed unit, whereas an elderly retired person may have an occupancy of just 1 person (and a cat). Also varies considerably when you take socio-economic factors into play as well, i.e. Pacific Islanders will typically have more children than Palangi, so again, the figures of density will change. That’s why I’m more inclined to deal with du/ha as a figure that is more able to be fixed reliably for valid comparisons, than ppl/km2 which will vary so much.
As regards to Mathew’s question about those dense Zest apartments, I can confirm from that paper quoted above, that Scene One apartments (similar to Zest?) has about 728/ppha, giving a ratio of about 68 m2 per person. From memory, in the Walled City, every person got way less than 7.5m2 per person (HK standard is for 7.5m2 per person). So let’s say that Kowloon Walled City was probably still 10 times more crowded than those bad Auckland apartments.
In hong kong, there are old planned districts such as Kwun Tong or Mong Kok. The buildings are usually 20 storeys with no space apart. It is generally noisy, poor ventilation, no sunlight and generally very low liveability.
The new mastered planned satellite cities are much better. For example in Tseung Kwan O, there are 50+ of 50 storeys apartments buildings within 500m radius of each subway station. Population density is much higher but doesn’t feel that way.
The magic is there are well landscaped and tree lined parks and public facilities(library/recreation) between buildings. Also there are bike lanes and tree lined walking tracks connecting building groups.
Buildings are master planned and group together as complex. Underground is subway station. First floor is bus interchange. Second and third floor are shopping malls. Forth to fifth floor is club house (spa, swimming pool, gym, children playroom). Sixth floor is outdoor garden platform with landscaped trees and pools.
Above the platform there are 4-10 50 storeys apartment buildings that are evenly spaced and optimised for maximum sunlight.
People living on the highrise apartments enjoys good views, ventilation and sunlight because they are spaced apart from other building.
They also enjoys private gardens, gym, swiming pool etc. Also they can just take the lift to shopping malls downstairs to buy things. When they need to travel they just take the lift to subway station or bus/taxi interchange.
Between different building groups complex, there are air-conditioned over-bridges that links to the next building group complex. The next complex also host another mulit storeys shopping mall and another 10 buildings above.
Some train stations are mixed use, which means in the core there are private premium residences, premium shopping malls, office, hotels, private schools building. Further away from train station it is surrounded by subsidied government housing, budget shopping malls, public schools, recreation, and sport fields.
It is common for one train station to have four or five shopping malls linked together forming a mega mall. The scale is like 800 shops in each station and about 50 towers above which houses 100,000 people in a 1km2 space.
The scale is something an average kiwi can never imagine. It is extremely efficient and extremely convenient.
My Barbie doll used to live like this too. Certainly better than sitting in a car for hours each day, or not having a house to live in. I wonder if anyone nips out in their pj’s to grab the ripe, dripping figs before the birds get them…?
Interesting reading & comparisons thanks.
Where does a kid in Hong Kong work on his doosra without being embarrassed by others watching?
Kids in Hong Kong aren’t interested in cricket.
In short, Auckland is not very dense yet the traffic is appalling, you can’t swim in the beaches and you can’t walk in the forest.
We’ve been let down by our leaders for 30 ish years.
I think it goes back further than that….
LOL c’mon Auckland could build aplenty upwards and still not even be as densely populated as Paris or London let alone close to Hong Kong.
Yes, and have a whole lot of better quality homes and lifestyle opportunities in the process.