Putting a number of the cost of congestion in Auckland has become something of a perennial sport, with the mayor and business/infrastructure lobbies recently raising inflating it to as high as $3 billion. Those lobby groups wanted to back up their congestion cost claims and yesterday released a report by NZIER that throws a whole set of new numbers into the mix.
We have frequently been highly critical of past studies that try to put a number on this, usually because they have terribly simplistic methodologies and always compare against the crazy counter-factual of 100% free-flow conditions.
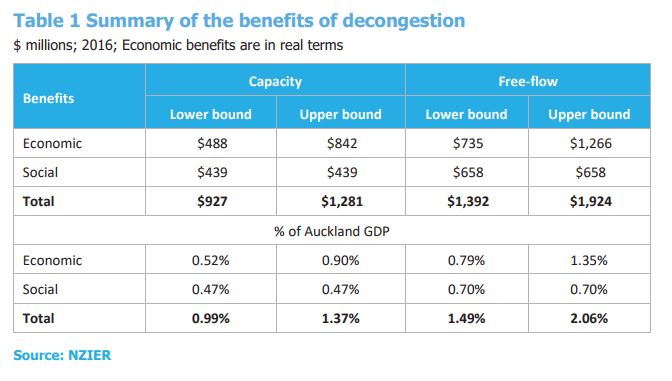
At first glance, this is a much more sophisticated study that typically avoids, or at least recognises, those pitfalls. For example, while the table above shows numbers for comparing current congestion levels against that unrealistic free-flow utopia, it says it would be stupid to aim for that, noting:
Targeting free-flow speeds (i.e. the speed limit) would not be an optimal use of the Auckland network as it would mean an under-utilised network.
To address that, it includes a comparison to a more realistic capacity measure that considers the optimal throughput of our roads. This effectively builds on and updates to current conditions the 2013 NZTA research report by Ian Wallis and David Lupton, which had an excellent methodology and pushed back hard against the crazy idea of using free-flow as a goal. Of course, this ignores that Level of Service (LOS) is a poor metric to use in an urban setting.
The report says that if our roads were operating their capacity during the week, we’d see economic benefits of between $0.9 billion and $1.3 billion. This is estimated at 1-1.4% of Auckland’s GDP which doesn’t seem all that high given the region’s economy has been growing by over 3% per annum for many years now.
Some of the broader economic and social impacts of congestion are calculated in a bit more detail than usually occurs with transport evaluation processes – Peter plans to look at this in a bit more detail in a forthcoming post.
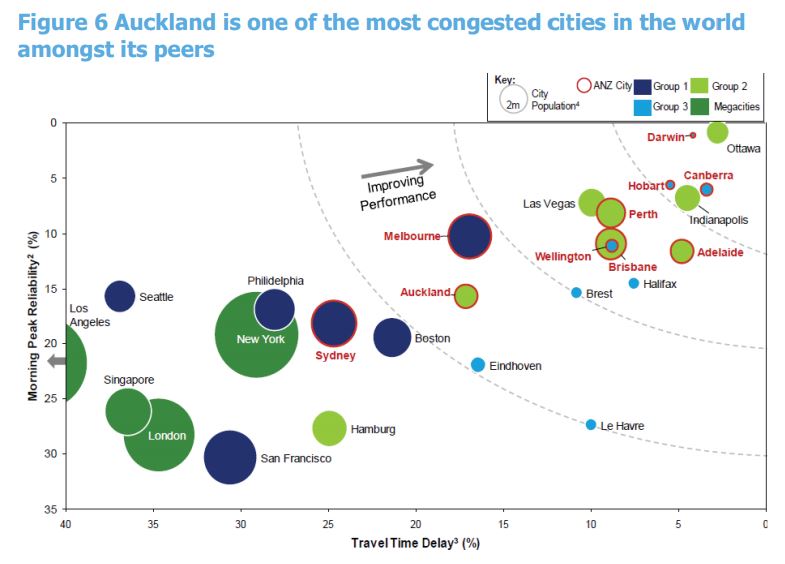
While parts of the methodology appear strong, that doesn’t mean I agree with all the conclusions the report makes. In particular, the argument that congestion has major economic impacts, while seeming logical at a micro-scale, appears to be a long bow to draw when you look at different congestion levels of cities around the world.
If congestion seriously harmed economic performance, you would expect to see the economies of cities in the bottom left of the chart below struggling. But actually the opposite seems true – San Francisco, London, Singapore, Seattle and so on are thriving cities whose main challenge is providing enough housing to meet the needs of all the people that want to live in these places. I’d hardly think of Indianapolis, Adelaide, Canberra, Darwin etc. as being places for Auckland to seek to emulate.
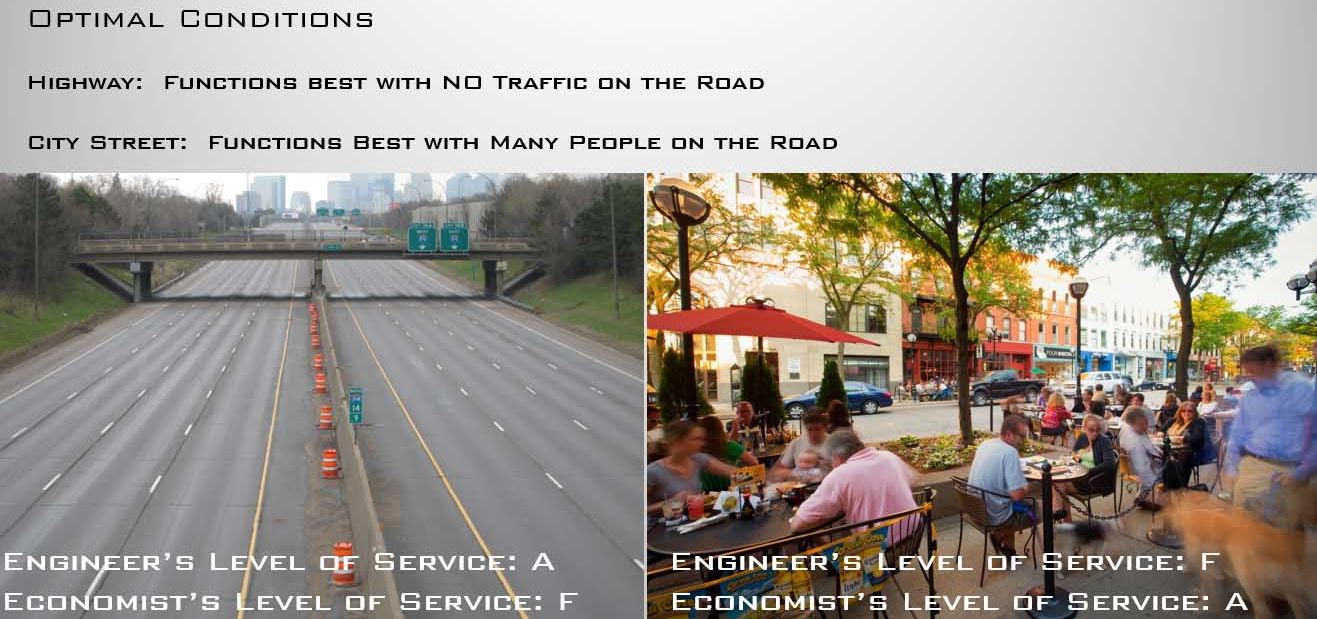
Those bigger cities might be congested but they also have a lot of activity going on that can be achieved or participated in by using modes free from vehicle congestion, reminding me of this image.
The report also occasionally goes off and makes some bizarre statement, such as this on the Quay St cycleway which has had over 280k people use it over the last year.
However, the development of other modes of transports can add to congestion on the roads. For example, the development of cycleways has seen the removal of bus stops including main stops which pick up passengers at key tourism operations such as the ferry terminal where cruise ship passengers alight.
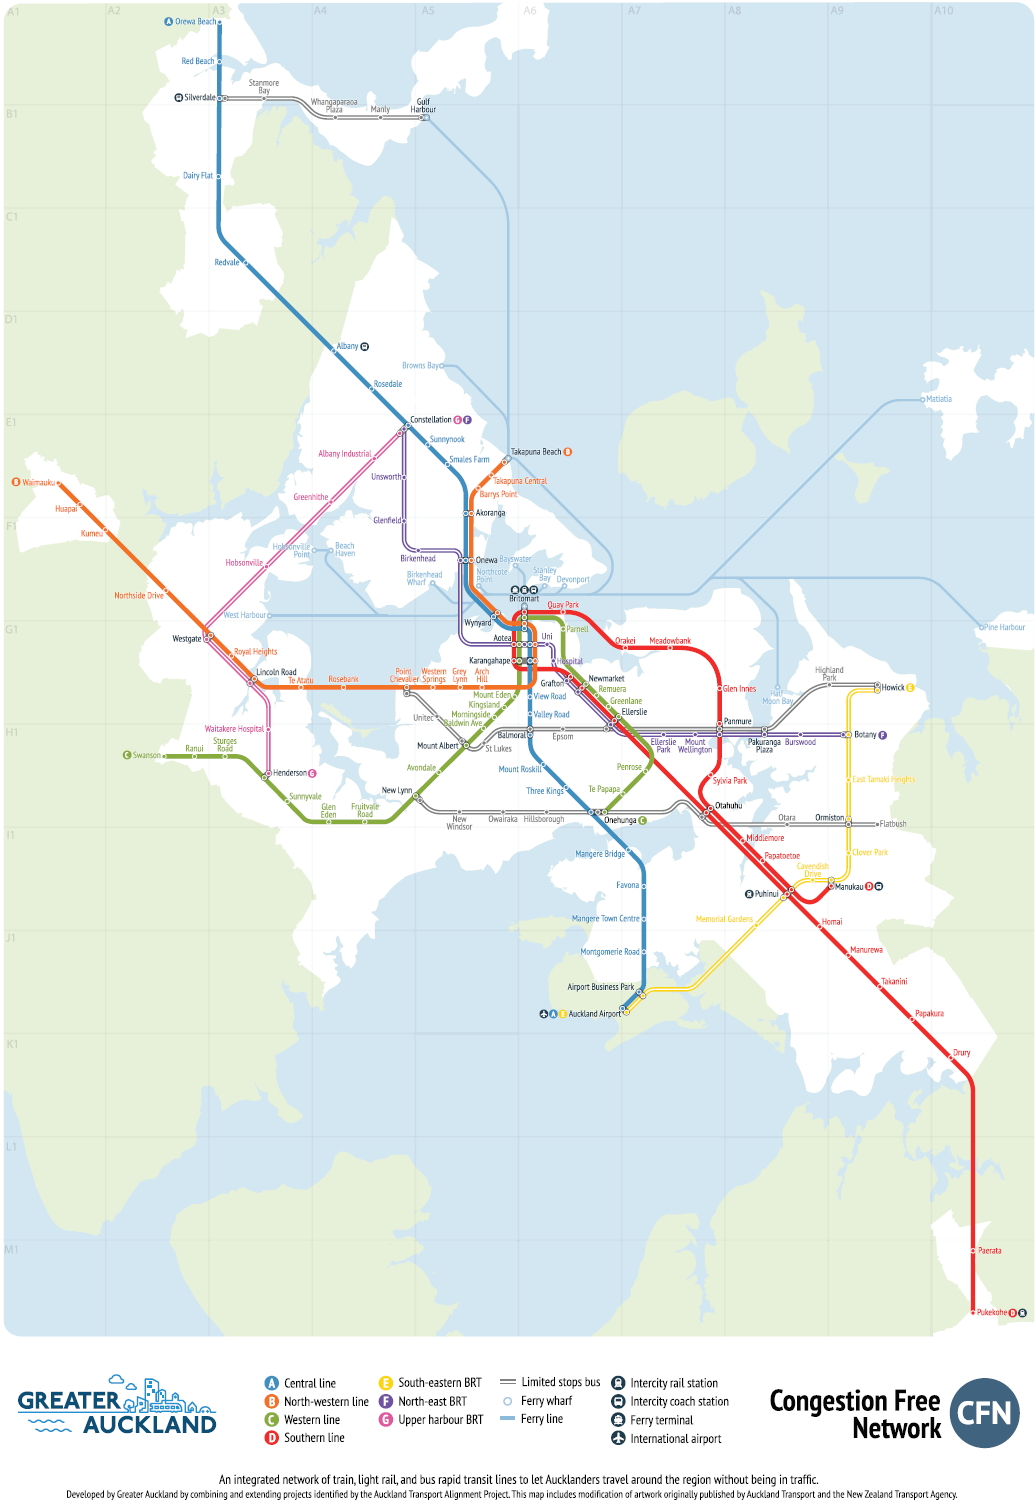
Of course, this isn’t to say we should just ignore congestion, and putting a number on the cost of it isn’t really the key issue. It’s also interesting to note that at around $1 billion per year, this cost is around half of what gets spent in Auckland on transport (which seems to suggest our current approaches to “fixing” congestion aren’t working). The key issue is the best way of doing something about it. Of course this why it’s so important to improve walking and cycling options and the Congestion Free Network, which provides people with a way of avoiding congestion.

 Processing...
Flip that around: What could we deliver by spending $1.9bn on infra projects each year instead? I’d imagine the money you lose in congestion would drop pretty rapidly after year five.
Just one point, Matt: the report only finds that half of the measured costs of congestion are direct economic costs. The remainder are social costs – ie lost time for non-work purposes.
Essentially, NZIER’s number for the economic costs of congestion – 0.5-0.9% of GDP – is considerably smaller than the headline figure of 1-1.4% of GDP. (And I have some questions about a few elements of that.)
Overall, this does not necessarily convince that we need to spend lots more on roads.
And isn’t annual road spending already around 1.2% of GDP, i.e. more than the cost per year of road congestion? If NZTA want to be good economists they should wish to optimise the total of congestion costs and road construction costs. We might save money by accepting a little more road congestion in return for spending less on roads. As you have pointed out, there is little evidence that more road spending increases economic growth. Most of the evidence cited goes back to studies done in the 60s, 70s and 80s, when globalisation and telecommuting were not happening.
“unrealistic free-flow utopia”
Here in Taumarunui the roads are 100% free-flow at all times. So, not unrealistic, provided you don’t make the mistake of allowing development that generates more demand than transport infrastructure can accomodate. That’s just poor planning.
It sure is easy not to have congestion when you have a declining population and economy. Worked well for Detroit too.
I think that is mainly a question of scale. Cities with a population under, say 100,000, will not generate enough traffic to exceed the capacity of a grid of 20m wide roads that can operate as four lanes (2 each way) in the peak. So there is no congestion, and no need for road widening.
The problem occurs when cities get big enough to have traffic volumes that exceed the capacity of the surface road system that was surveyed when they were settled. You then have to either have planned sufficiently far into the future to have set aside land corridors for bigger new roads to be built later, or acquire land to widen existing roads, or build higher capacity PT. Or not grow in population.
Adelaide is worth noting in this regard. Quite apart from having the slowest moving economy of any of the Australian cities mentioned, a colonial architect (Colonel Light) surveyed it with wide road reserves from the start, that would function as grand boulevards into the future. So they have a grid of four lane surface arterial roads with high combined capacity. Most of the city still hasn’t outgrown them. They have never had to build an inner city freeway system, even when PT mode share was low. But that sort of foresight is rare.
Here’s a brief history of Tamaranui: https://en.wikipedia.org/wiki/Taumarunui#1900s
Population peaked in the 1981 Census (6540 people) and declined in every subsequent Census period. In 2013 Tamaranui’s population was 4500, or 31% below its peak.
Also, there’s this interesting note:
1915 – Only a single car in town.
Leaving aside the lost economic opportunities of having no cities of scale, the environmental costs of distributing everyone evenly across NZ in towns the size of Taumarunui would be staggering. No, thank you.
What are the employment prospects like in Taumarunui? I wouldn’t hold it up as something for other towns or cities to strive for.
Auckland PT had an increase in total number of trips from 82.90million from end of June 2016 to 88.42million to the end of June 2017. That is an extra 100 000 trips per week on PT.
Many of those trips would be by people leaving their car at home.
If I assume that if a person makes about 10 trips per week on PT rather than take her car that is effectively taking 1 car off the road per week.
So an extra 100 000 PT trips per week reduces the number of cars on the road by 10 000 per week give or take some.
Please let me know if I am wrong in my logic.
There’s an error of logic here.
Just because a city has growing *financial* performance does not make it *economically thriving* – that would require some sort of analysis of utility generation, and the best proxy of that is probably those “liveable city” surveys.
Also, to criticise Adelaide and Canberra – both cities of immense natural beauty, easy cycling and public transport, and thriving internal financial economies, seems a little on the nose. Adelaide is regarded as Australia’s most beautiful city.
I have lived in Australia and have a lot of Australian friends and I have never heard anyone praise Adelaide or Canberra.
I was recently in Adelaide and I certainly wouldn’t praise it for cycling. There were a few half arsed cycle lanes but mostly just paint. Auckland is far ahead of Adelaide in infrastructure.
Can you back up that “Adelaide is regarded as Australia’s most beautiful city”. I certainly don’t agree.
Aucklander that lived car-free for 2 years in Adelaide here. The cycling infrastructure is far superior to Auckland’s (most rail lines & the light rail line in ADL have adjacent separated cycling infrastructure, plus the new exurban motorways), with the caveat that both cities fail similarly when it comes to designing intersections for cyclists. Also the attitude of ADL motorists in general (very, very few speed > 60kph on arterial boulevards) and attention to cyclists is far more understanding (in 2 years, I probably only had one or two close calls in ADL, while they’re a weekly risk in AKL). Cycling mode share in ADL is far, far higher than Auckland.
The comparison is apt because both have similar metro populations… but what ADL has (perhaps thanks to Colonel Light) is that its CBD is smack in the MIDDLE of the Adelaide plains, meaning the CBD has spatial accessibility from all directions. There are fewer “pinch points” where everyone needs to be using the same transport infrastructure in the same direction. Had Adelaide’s CBD been sited at Port Adelaide, it would probably look more like Auckland with more spatially restricted access.
One thing I don’t see mentioned enough in discussions of Auckland’s urban growth is that Auckland faces distinct geographical restrictions when it comes to growing a large city sited on an isthmus. San Fran, Sydney, Hong Kong, Vancouver, San Diego all share similar geographical restrictions and that’s a who’s who of cities with infrastructure & housing affordability concerns.
I think this is true to an extent, but maybe it’s a narrative we use too often to excuse our current situation.
Most cities have busy centers. The harbours may constrain our current perceptions of transport to narrow corridors with little capacity for “bypassing” the center.
However, even in a flat plain the capacity of cross region links will have limits. In Auckland because cars are really the only choice for many cross-region transport, it now is increasing limiting the choices people can make about where they work, play, eat and sleep.
Further, there is the missed opportunity that the harbours represent. Ferry services seem to work well in places like Sydney. How would the city have developed with these options.
“Ferry services seem to work well in places like Sydney.”
Seem is by far the most important word in that sentence. Ferries in Sydney move a smaller share of PT passengers than in Auckland and fewer trips per capita https://www.greaterauckland.org.nz/2013/09/02/the-opportunities-for-ferries/
I think you all have valid points here. Our geography makes for particular challenges and opportunities. The problem in all cities that have been hijacked by the road lobby is similar – that we’ve created car dependency on a finite landbase. Continuing to build roads to try to solve congestion at this point is destructive in any city given the lack of space for widening of roads and intersections it requires throughout the city. It is also overtly arrogant given the overwhelming research that these roads create traffic and don’t solve congestion in the long term.
The destruction and arrogance is just more obvious in a city on an isthmus. I think a lack of accessibility emerges earlier in a city like ours, but hopefully also an awareness of the need to change tack
Another telling question: if NZTA are a transport authority, and not just a road builder, and we have reports of congestion on buses and trains, is there any attempt to measure the cost of the latter? Given that much of PT congestion relates to commuter trips to the CBD that have high economic value, you would think they would at least measure the cost before putting off RTN projects of r a decade or so.
Final question – what about the cost of zero congestion? Congestion free roads induce behaviours that are costly. Consider development. Land is a finite asset with real value. The faster our roads become, the more our cities sprawl out, consuming land. Likewise car buying, all of them imported. NZ has one of the highest rates of car ownership in the world. How many billion would we save if car ownership were reduced to the level of say, France?
Congestion is expensive so build more trains?
I’m not convinced by that figure.
Stuart – re Brisbane, don’t forget the private investors who took a big loss on some of the roading projects too.
Our perspectives are influenced by what we see every day – Phil Goff (and AT management) should be on public transport frequently to get a more balanced view. I’d be interested to know the (anonymised) commute patterns of AT management for example.
And you’re right that this sort of study doesn’t really help inform decision-making. It feels sadly static and lacking a dynamic aspect. What is needed is a vision of how Auckland could move better given its geographical constraints and current transport system. The likes of Stockholm and Asian cities (especially those of similar size) could teach us a lot.
That Figure 6 is very unconvincing for many reasons.
For example…
1. How did they decide what cities are Auckland’s “peers”?
The selection seems to be unnecessarily slanted towards the Western world. Some of the cities there would seem to have little in common with Auckland, e.g. Indianapolis and Las Vegas – two cities in the middle of plains with room (for better or worse) to sprawl in all directions.
And only one Asian city (Singapore) that I could see.
It speaks to a narrow perspective.
2. Misspelling of “Philadelphia” speaks to a lack of attention to detail.
Anyway as Matt said, the real issue is whether or not people have an alternative to avoid road congestion. If you can take the Tube/MRT/BART etc. etc. quickly and conveniently then what is happening on the roads is essentially irrelevant.
Obsessing about road congestion really does miss the point about how transport networks function.
I would have liked to see cities like Stockholm added, which have road pricing and are a similar size to AKL.
On an isthmus as well
“The report says that if our roads were operating their capacity during the week, we’d see economic benefits of between $0.9 billion and $1.3 billion. This is estimated at 1-1.4% of Auckland’s GDP which doesn’t seem all that high given the region’s economy has been growing by over 3% per annum for many years now.”
I had never thought of it that way! So if we spent billions and billions fixing congestion, all it would do is increase GDP by the same amount that occurs naturally in 4 months.
I suppose the question then becomes: “at what point does congestion start to choke GDP growth?”
I wonder if they have also considered the non-transport costs of building more roads. For example Spaghetti Junction significantly restrains the area of the CBD and increases land and rent costs.
Its quite possible the GDP of Auckland would be a lot higher with less roads!
The more people try to put monetary value on non-monetary things the more assumptions have to be made and the more ridiculous the final output. The assumption of free-flowing traffic is absurd. No city in the world has achieved free-flowing traffic 24-7 and no city would ever want to because you’d have high idle capacity for 21 hours a day.
I will also note the numbers frequently cited by the cycling fraternity are similarly not worth the screen they’re written on.
Agree. So instead of using numbers lets just use comparison cities. Its quite obvious to almost anyone (except maybe yourself) that cities with lots of roads are horrible (e.g. LA), and cities with less roads are nice (e.g. Tokyo). So lets build less roads.
LA is horrible, yet sets the cultural direction for the known world
And you think that is a positive thing? Heroin is a highly addictive drug too. Does that make it a positive thing?
Cycling numbers like the number of people cycling set against the projections of a cycle project are pretty hard numbers though. Numbers you reject because when you stand near a cycle path you can’t see anybody on it.
Cycling is growing and cycling is an integral part of creating a better urban transport system. Those are facts you need to accept. It only needs the political will to make it happen.
We tried building more and more roads and it didn’t work. That is also a fact.
These studies are always pointless. They compare the current transport network and volumes to some world in which everyone makes the exact same journey on exactly the same infrastructure, just with no congestion.
That’s an insane comparison, because it isn’t possible. You could assume that trips don’t happen in order to prevent congestion, but that has an economic cost. You could assume that buildings are demolished to build more surface transport, but that also has an economic cost and increases travelling distances. You could assume that everyone makes shorter journeys by living closer to things, such that the total travel demand at every point is the same, but that ignores the changing spatial distribution of land use.
Surely the only economic costs of congestion are those which are externalized? Everyone chooses to participate in congestion. They could move to Taumaranui and avoid it altogether, they could live closer to work, they could not work, they could walk their children to school. Every person has made an economic decision to lead their current lifestyle. Then the only economic cost must be the pollution and health costs?
This study isn’t quite as bad as that. It admits that free flow conditions aren’t realistic and measures the costs of congestion relative to the full through capacity of the road, which is below free flow. This seems reasonable to me.
The problem is the media which scream out the “cost” relative to free flow.
I am still dubious of the costs relative to capacity though especially as they’ve given a heavy weighting to the “social costs” of congestion as distinct from economic. But I need to read further on how they got those numbers.
Using the 80%, 20% rule.
80% of the roads (mainly secondary) roads are only 20% used .
20% of the roads (mainly highways ) are very busy and used in 80% of trips.
So we have spent enormous amounts of money on roads in suburbs which are used by only a few cars a day. Drivers in far away suburbs mostly want to get to the motorway and cause the congestion.
Yes these studies are nuts really, more general road congestion will push people to alternatives anyway as long as they exist.
This is ultimately why Auckland needs PT now, rather than a focus on projects like EWL.
Without alternatives people can only choice cars. This also effects their decisions about where to live and work, where to play, and similarly for businesses.
More “decisions” to purchase cars, then means more perception that more roads are the needed for people to repay that decision.
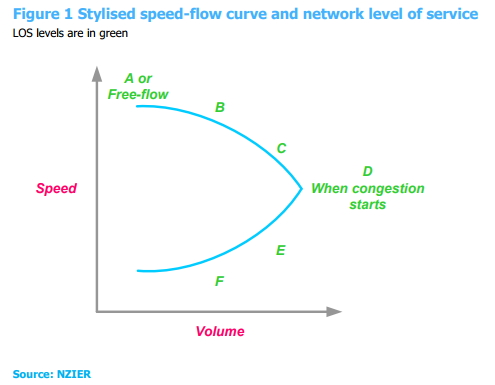
I get grumpy (maybe grumpier) when I see that Figure which is just a load of bollocks. Capacity occurs at the E to F threshold yet that curve says it is at LOS D. The whole nonsense of the bottom half of the curve is based on bullshit. The Highway capacity Manual shows the top half measured in Chicago and it makes logical sense. Speed drops as you approach capacity. The same manual shows the bottom half measured on New York’s parkways (inbound) where there is a downstream bottleneck. FFS you can only get that bottom portion when there is a constraint down stream.
After over ten thousand kilometres of car following surveys around a big NZ city many years ago, I derived a pretty good appreciation of the shape of the volume-speed curve. And its not anything like the traditional one. A series of coordinates on the curve are defined thus (assuming 1800 vph per lane free flow and a 50 km/h speed limit):
Pt 1. Lone car on the road. Eyes everywhere. Travels very close to but above the posted speed limit. Vol 1 vph / Speed 55 km/h.
Pt 2. Two cars on the road. Travels very very close to the posted speed limit because the other car may be The Law. 2 vph / 50 km/h
Pt. 3 Several cars on the road. Lots of eyes out there, and the consensus is that none of them are The Law. 500 vph / 60 km/h.
Pt 4. Hordes of cars, lots and lots of eyes for danger, Intense driving, fast as. 1799 vph / 70 kph.
Pt 5. Lane chocka, somebody flinched. 1801 vph / 71 km/h drops like a stone to 5 km/h. Splat.
Pt 6. Breakdown. Volume past point drops from 1800 vph to very low. Speed low. 200 vph / 20 km/h. Indeterminate wobbling about this strange attractor for a while as upstream clears.
Pt 7. Resumption of sub-1800 vph flow, resumption of 70 km/h travel.
Then in free flow back through Points 4-3-2-1 until everybody is back in bed.
So there you have it. In free flow conditions more traffic leads to higher speeds until it all hits the wall and breaks down into ‘gridlock’ stop start conditions.
‘Speed drops as you approach capacity’ Not quite. Speed increases UNTIL YOU GET TO CAPACITY. Before you get to ‘capacity’ there is no restraint on increased speed (apart from the driver’s fear of a fine). Once you get to capacity then it all goes strange and doesn’t get tidy again until the flow recovers.
Modellers hate this, because the traditional VD curves ensure that as the model is loaded progressively a few cars go onto the most direct (lowest cost) road, then the next load finds that the first road has some traffic, so those new trips get allocated to other roads, and so the network gets loaded up nice and evenly. With the ‘true’ curve all trips get assigned to the most obvious route until breakdown. Only then do alternative routes appear more attractive – which is how it actually works in practice.
One can share the modeller’s pain as computationally it is very difficult to model flows and speeds in the indeterminate breakdown and recovery phases – even tho it is under those conditions that a big proportion of travel on the network happens. But that mathematical difficulty doesn’t avoid the fact that the Volume/Delay (Volume/Speed) relationships are wrong. At best the models get some of the answers right some of the time, but if they do its still for the wrong reasons!
Thus, IMHO, all economic modelling of traffic flows is basically flawed and the outputs should be regarded with the utmost suspicion.
That’s alright. The transport models that predict traffic flows are utterly flawed too. I imagine that the cities that are removing freeways and reallocating road space are doing it on the basis of just walking away from the models, because they fail to produce designs that lead to a liveable city.
I actually look at empirical data on this regularly as part of my job, and at least on rural roads and expressways/motorways, that isn’t even close to true. Traffic speeds are highest below 100vph and then progressively get lower as they fall to the lowest common denominator, then side friction plays a role as people slow down to allow merges and as people leave smaller gaps pulling out of side roads.
Mfwic is right though, we only see flow failure due to downstream capacity.
Actually people often don’t travel at the speed limit even on low vph/empty roads. SH20 at 10am often has the slow car in the fast lane problem.
Then as Sailor says there is the wave effect of lane changes.
It’s been over 20 years since I’m thought about stochastic and networking processes. I’ve wondered with the computing power we have now if anyone has come up with more interesting modelling systems.
Like this one thought I had recent while struck in traffic about combining finite element method with standard queuing theory network analysis models. Hook them all together like some neural network.
What we waste our time on while waiting in traffic. 😉
“If congestion seriously harmed economic performance, you would expect to see the economies of cities in the bottom left of the chart below struggling. But actually the opposite seems true… ”
Obviously congestion can also be a result of economic growth. So it’s not really a statistic you can use for this type of analysis, without drawing out other variables.
Like maybe number of truck hours per ton of delivered goods, or vehicles hours per office sqm.
A pointless exercise when coupled with building roads to ease congestion. Over the long term roads do no such thing, they just increase car dependency and congestion in the local roads. The reason it’s not safe for so many of our kids to walk or cycle to school is precisely because of this. ‘The Impact of Road Projects in England’ report by CPRE that came out this year makes excellent reading for the reasons why roads have failed to deliver the many claimed economic benefits. One example:
‘Where a road scheme was justified on the basis that it was needed to cater for current and
future traffic in a ‘pressure cooker’ area with a buoyant economy, it was common for the
scheme to be followed by much development in car-dependent locations, causing rapid
traffic growth and congestion on both the road scheme and the pre-existing road network.’
Suggest we start a worldwide movement to redefine LOS as:
Current LOS A = LOS 0% – the road is almost empty and a major waste of resources
Current LOS B = LOS 33% – the road is partly empty and a waste of resources
Current LOS C = LOS 66% – the road is being under used
Current LOS D = LOS 100% – this is the economically optimum where the road is fully utilized but not congested
Current LOS E = LOS 66% – we have flow breakdown sometimes
Current LOS F = LOS 33% – we’re at capacity
Current LOS F+ (>1.0) = LOS 0% – we’re over capacity
Speaking of congestion, i heard that traffic heading west on the SH16 was backed up today at 4:20 from Waterview back past Western Springs. Anyone know if whatever problem caused it was cleared before the main peak hour?
there was a nose to tail and a number of cops running a rolling block to get the cars out of the right/fast lane and onto the left hand shoulder