Every week we read more than we can write about on the blog. To avoid letting good commentary and research fall by the wayside, we’re going to publish weekly excerpts from what we’ve been reading.
Joel Leider, “House price-to-rent ratios in major US markets: a data visualization case study“:
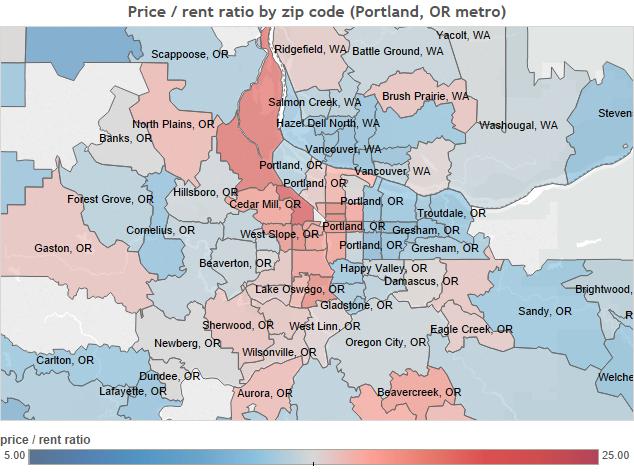
My wife and I are buying (and selling) a house, and the metric I always return to is price-to-rent ratio. Sure, the real estate agent will show you comps for similar homes in the area. And all your friends, family, in-laws will chime in as to what they think a proper price. But price-to-rent ratio has the beauty of simplicity. It’s like a stock’s p/e ratio, and gives us a contingency plan. If you keep your price-to-rent ratio –price / (rent * 12)– below 20, at today’s interest rates you could rent out your house and still pay your mortgage plus tax. […]
Let’s look at price-to-rent ratios for some major markets. Below are the ratios for the Portland, OR metro area. In the city center, as well as some desirable suburbs, the ratio is getting high. In my situation, my wife and I are moving from Sherwood to Beaverton (ratio goes from 16 to 14). Sherwood is pink, but pretty far from the city center. With its amazing schools, it attracts the kind of people willing to pay somewhat of a premium to own over renting.
And, hey presto, some people have compiled a similar set of figures for Auckland’s suburbs:
Peter Nunns, Hadyn Hitchins and Paul Owen, “To buy or not to buy? A spatial analysis of house prices and rents in Auckland, 2001-2013” (pdf), Auckland Council technical publication:
We observe significant geographical variations in the relationship between rents and prices. Indicative rental yields are significantly lower in some areas than others, indicating that prices are high relative to rents.
Broadly speaking, the city centre fringe areas, along with beach-side suburbs in east Auckland and the North Shore, tend to have lower rental yields. These geographic variations remained relatively constant over time – i.e. the areas with the lowest indicative rental yields in 2001 tended to also have the lowest yields in 2013.
These persistently low yields present a conundrum for interpretation. They highlight an important feature of the housing market: that dwellings are both simultaneously investment and consumption goods (Henderson & Ioannides, 1987). Low yields could be interpreted as an indication that buyers in some areas are investing in the expectation that prices will rise rapidly in the future. On the other hand, buyers may not be seeking investment, but rather placing a premium on the high amenity values in these areas. This is supported by the fact that owner-occupation in area units with less than 3 per cent rental yield is higher (68%) than those areas with a higher yield (58%).

Adele Peters, “7 Cities That Are Starting To Go Car-Free“, FastCoexist:
After over a hundred years of living with cars, some cities are slowly starting to realize that the automobile doesn’t make a lot of sense in the urban context. It isn’t just the smog or the traffic deaths; in a city, cars aren’t even a convenient way to get around.
Traffic in London today moves slower than an average cyclist (or a horse-drawn carriage). Commuters in L.A. spend 90 hours a year stuck in traffic. A U.K. study found that drivers spend 106 days of their lives looking for parking spots.
[…]
Forty years ago, traffic was as bad in Copenhagen as any other large city. Now, over half of the city’s population bikes to work every day—nine times more bike commuters than in Portland, Oregon, the city with the most bike commuters in the U.S.
Copenhagen started introducing pedestrian zones in the 1960s in the city center, and car-free zones slowly spread over the next few decades. The city now has over 200 miles of bike lanes, with new bike superhighways under development to reach surrounding suburbs. The city has one of the lowest rates of car ownership in Europe.
Carlton Reid, “The demise and rebirth of cycling in Britain“, The Guardian:
In car-centric Britain planners assumed that cycling was teetering on the edge of extinction, and by omission they would do all they could to hasten this demise. Civil engineer and planner Professor Colin Buchanan wrote a highly-influential 1963 transport report for the government which recommended that nothing be done at all to encourage urban cycling. Buchanan’s Traffic in Towns was used by town planners to bulldoze motorways through British cities.
Dave Hansford, “The Agony of Vanuatu and the New Climate Colonialism“, Public Address:
Aotearoa has become a pariah at climate talks, not least because it leads a camp seeking “opt-in, opt-out” provisions, and a ban on any legally-enforceable penalties should national targets be missed. It also seeks to have the warming effect of methane – one of New Zealand’s most voluminous pollutants – redefined so as to lessen our total emissions.
[…]
It insists that, given our preponderance of hydro power, there’s little more we can do to curtail energy emissions, as though our almost entirely fossil-fuelled land transport and industrial energy sectors were not, in fact, the fastest-growing sources of new emissions. As though this Government hadn’t borrowed billions for an orgy of motorway building. As though it hadn’t slashed spending on public transport, walking and cycling, even as it woed oil and gas companies with $8m of enticements last year.
Frederick Melo, “The Green Line at 6 months: How’s it doing?“, Twin Cities Pioneer Press:
Metro Transit’s Green Line debuted six months ago, promising a comfortable, modern light-rail connection between downtown St. Paul and Minneapolis.
Fans and foes instantly squared off, foreseeing a big boost to economic development along University Avenue or the demise of longstanding businesses.
Six months in, one thing is clear: Ridership has nearly surpassed projections for the year 2030. From June 14 through the end of November, about 5.6 million passengers rode the line, averaging more than 1 million rides per month. The state’s first light-rail project, the Hiawatha Line, or Blue Line, debuted in June 2004 and took more than two years to reach that level.
Emily Badger, “Why parking spaces shouldn’t be wasted on cars“, Wonkblog:
For the last few years, Philadelphia has converted a handful of parking spots in front of neighborhood businesses into temporary “parklets” no bigger than the space that might fit one or two cars (these tiny interventions are now popular in a lot of cities). Records from adjacent businesses show sales went up about 20 percent immediately after the parks were installed, relative to right beforehand.
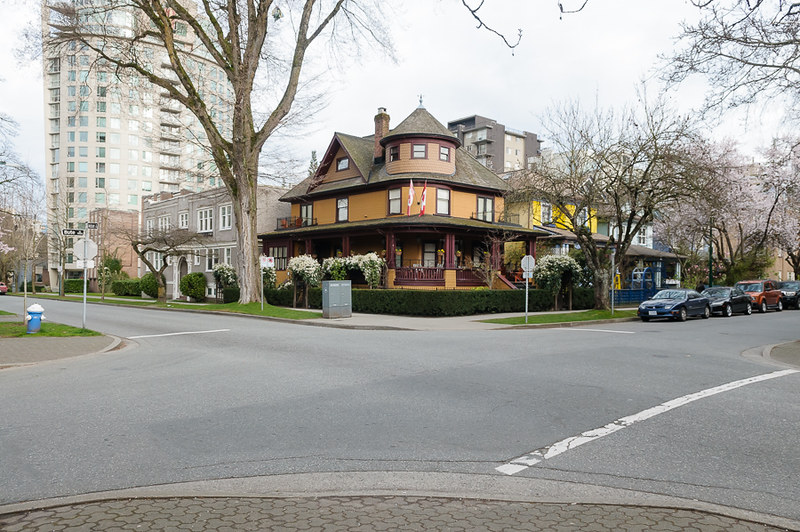
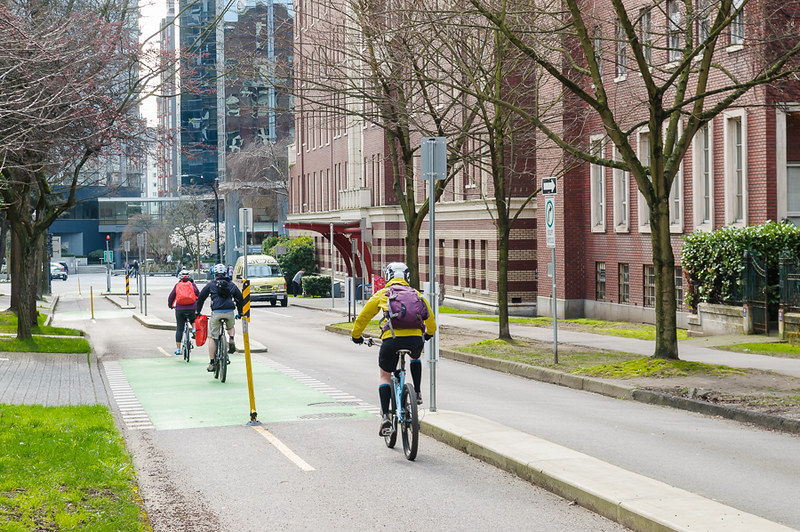
David Roos, “Cycling to Work in Vancouver“: A nice little photo-essay that shows the city from a bike’s-eye view. It does a good job of highlighting Vancouver’s built form and partially-completed cycle network:
I live on a designated quiet street (Haro) on the edge of the West End in Vancouver and work Downtown on the corner of Hornby and Dunsmuir Streets – the two best downtown cycleways – making me a good candidate for cycling to work. Walking takes around 15 minutes. Cycling takes a variable amount of time, depending on how much excitement I want in my life.
Helmets are required by law. I see about 70/30 (helmets/no helmets). I’ve not yet been fined.
Josie Pagani, “Process, not pork the problem for National”, Pundit:
There’s nothing wrong with building bridges in Northland or roads in Tauranga, or even politicians promising to do these things in by-elections. Investing in infrastructure – roads, rail, energy – stimulates the economy when it is otherwise starved of capital.
The problem is process. You have to weight up the cost of spending $69 million on bridges up North against building bridges somewhere else, or building a new school or a hospital. You need a mechanism for deciding if a project is fully funded by government or costs are shared with private capital.
Sean Hollister, “Elon Musk describes the future of self-driving cars“, Gizmodo:
We’re a very long way from that, because there’s always going to be some—for a very long time there will be some legacy cars on the road.
And it is important to just appreciate the size of the automotive industrial base. It’s not as though when somebody makes an autonomous car, that suddenly all the cars will be autonomous. There’s two billion of them. The total number of cars and trucks on the road is two billion and climbing… The capacity of car/truck production is about 100 million a year.
So if tomorrow all cars were autonomous, it would take 20 years to replace the fleet, assuming the fleet stayed the same size. Arguably it could get smaller if things were autonomous, but still it’s maybe 15 years or something and it’s not all going to transition immediately. It’s going to take quite a while. And it’s the same for electrification of cars. Changing that industrial base to be electric — if all cars tomorrow produced were electric, it would still take 20 years to replace the fleet. And right now it’s 1 percent.
Adam Hengels, “Urban[ism] Legend: The Free Market Can’t Provide Affordable Housing“, Market Urbanism:
“Relaxing” won’t do the trick in a city where prices are high enough to justify skyscrapers with four to ten times the density currently allowed. When considering a supply cap that only allows a fraction of what the market demands, one can not reasonably conclude “Unlimited FAR” (building density) would merely result in a bit more development here and there. A radically liberalized land-use regime would deliver numbers of units several times what is permitted under current regulation.
Ms. Cort correctly concludes that because of today’s construction costs, new construction would not provide housing at prices affordable to low income people. This will certainly be the case in the most expensive areas where developers would be allowed to meet market demands by building 60 story skyscrapers. Advocates of land-use liberalization who understand the costs of construction would not claim that dense new construction will house the poor. But if enough supply is allowed to come to market today, today’s new construction will become tomorrow’s affordable housing.

 Processing...
What is reasonably anymore in regards to rental?. When you are renting a five bedroom property $900 per week, and you purchase this property in a red zone for say $650k. Total Annual Rent Income:$468k. Annual Water & Land Rates;$11,700.00. But most private rental doesn’t include water rates in the rent, where a tenant pays for used water only, but landlord demands their tenants to pay for the water bill. By two years the Land owner has paid his mortgage off, and now can afford to take out another mortgage to buy another investment property. What is fair in this scenario?. Landlords always prey on those who do not understand the Law, especially those who are not educated enough to read the fine print.
You’re a factor of 10 out on the rental there Sina. 900 * 52 is only 46,800. Thus 2 years becomes 20. Makes a little more sense now!
Except you forgot the interest too. To pay off a $650k mortgage in 20 years requires payments of $1,140 a week. Then add those land and water rates and that’s an extra $225 a week. So in that scenario the landlord would need to pay an extra four or five hundred a week over what the get in rent. That still might make sense depending on expected capital gains, but they certainly wouldn’t be ripping off the tenant.
Last time I checked water rates in Auckland had two components, usage and waste water, with waste calculated as a percentage of usage, so if water is a utility, similar to power and arguably internet, why aren’t tenants paying for all of it? Where’s the fairness in that?
Actually three components: water, wastewater and fixed charges for wastewater. The landlord can choose to pass on the variable charges, but not the fixed charges (ditto for rates). So water, wastewater, electricity, gas and comms are all up to the tenant, although landlords may choose to include some or all of these in the rent, eg for a basement flat where it may be difficult to separate those items out.
As for value/rent ratios, residential rents are set by the market, not by property value, and in general yield reduces as value rises. Granted, landlords probably anticipate recovering some of that loss ultimately via capital gain, which is a bit of a myth in reality as property values generally rise and fall in sync. However, if there were to be a significant downwards correction in values then rents would need to rise.
Good work in the price/rent study!
For me it underlines that the most price-impacting “restrictions on development” are at work in the favoured inner suburbs and coastal edges, more than at the fringes. It’s pretty clear who is creating and benefiting from protectionist planning control. I hope you’re reading this stuff, National.
I don’t understand your logic here Tim. Are not “restrictions on development” more a consequence of council constraints (eg the RUB) than government regulation? The hue of the government of the day has no bearing on this. Or are you castigating National for failing to simplify RMA rules? You could have a point there!
For more good Sunday reading, see https://www.transportxtra.com/magazines/local_transport_today/news/?id=40752 by John Dales, chair of the Transport Planning Society in the UK.
Sample quote:
Firstly: Transport. While this is plainly about the movement of people and goods, the danger of such a description is that it makes transport sound like a dry, technical exercise. Transport is, in fact, about how people go about their lives, commerce goes about its business, and the relationship between the two. I need transport to get me to and from places; and I also need transport to get stuff to and from me. Viewed this way, transport is rightly seen as a means to an end. When it’s seen as an end in itself, we lose sight of the vital connection between transport and quality of life. And we start to make mistakes.
At root, these mistakes stem from a top-down approach to transport, when the right approach is bottom-up. So, for example, we destroy parts of cities in order to implement ‘transport solutions’; having lost sight of the fact that the purpose of transport is to support city life, not harm it. We’re humans, not sharks: transport isn’t about keeping moving, whatever the cost. So, if we’re going to break some eggs, we need to be really sure that an omelette is what we need. Transport should be a blessing, not a curse.
I agree.
Just using Price to Rent ratios misses a really important point when buying. You are trying to figure out where prices are going to rise (which implies a lower current rent but higher future rent) and these areas will often already have high price to rent ratios. If you are never going to sell then you might search out a high yield (low price to rent) but if capital gain matters to you then you might not. The same goes with shares and PE ratios. A low PE means the market expects higher future earnings from growth like say Xero while low PE might be good for a retired person looking for income and not gain.
As discussed in the paper, we should interpret lower rental yields (or high ratios of prices to rents) as an indication that either:
1. Buyers have a lower cost of capital – i.e. they are paying low interest rates
2. Buyers expect house prices to appreciate more rapidly in the future – i.e. more capital gains.
Incidentally, one of the ways in which property owners can increase the rents they earn is to intensify – i.e. add dwellings to a site.
Yes those would be causes. But the point I wanted to make is that knowing the ratios is only one part of any investment. The more important part is knowing why you will either use them or ignore them. In hindsight rather than buying one rental in Sunnynook before the busway we should have bought every house within a 1km radius. Even though the rental yield was low. Alternatively you can still find yields of 12% in Wellington but the buildings are going to need a fortune spent on them within 15 years.