While browsing the Auckland Transport website recently looking for some information, I stumbled across the results of a survey by Gravitas Research and Strategy on how students travel to and from university campuses It consists of a report (2.6MB) and a giant 81-page presentation (3.8MB) of the results.
In total, 2,157 students from a range of campuses were randomly selected and interviewed earlier this year on a range of transport related questions and follows on from similar research in 2014 and 2016. Below are the campuses and the number of respondents who completed the survey. You’ll know there’s a wide range of campuses here, UoA and AUT in the city out to the fringe suburbs.
- AUT City (214)
- Massey Albany (227)
- AUT South (158)
- MIT Mankuau (190)
- AUT Akoranga (213)
- MIT Ōtara (208)
- University of Auckland City (232)
- MAINZ (105)
- University of Auckland Newmarket (143)
- Unitec Mt Albert (231)
- University of Auckland Grafton (236)
Given the size of the presentation, I’m only going to scratch the surface of the data. On to the results.
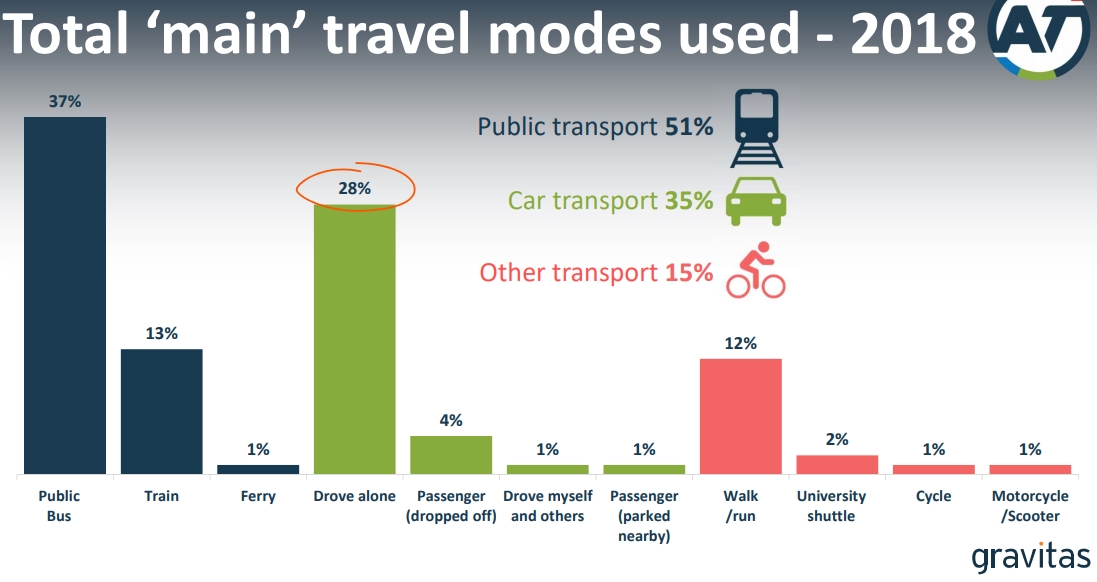
Around two thirds of all students get to their campuses by not driving with unsurprisingly bus being the single biggest mode. If we could get that kind of modeshare across all of Auckland then road congestion would be pretty much non-existent.
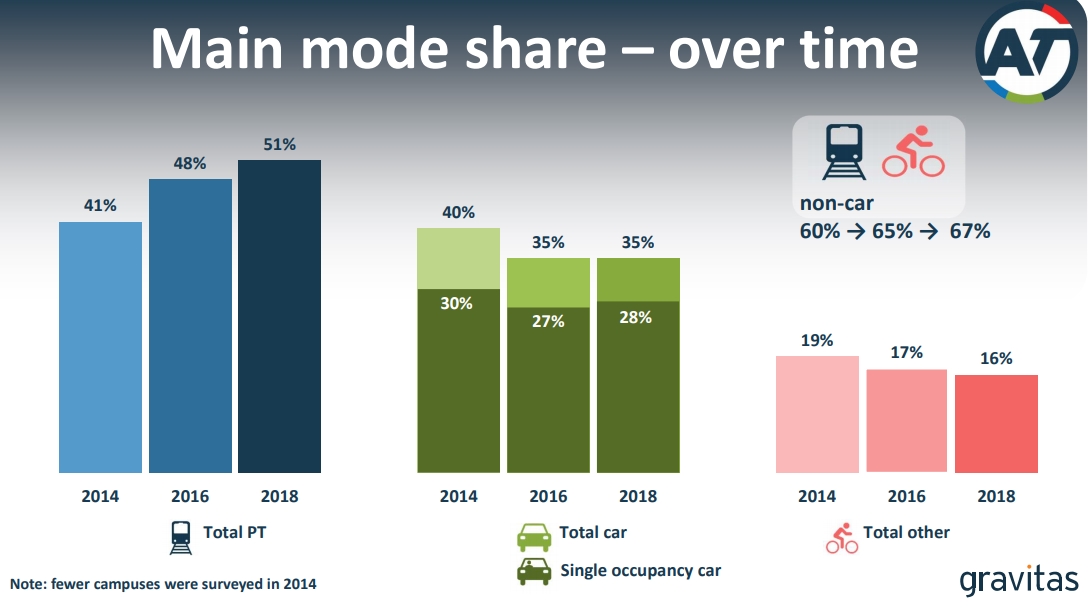
You can then see how this has changed over the last two surveys. It’s not entirely clear why the active modes have fallen.
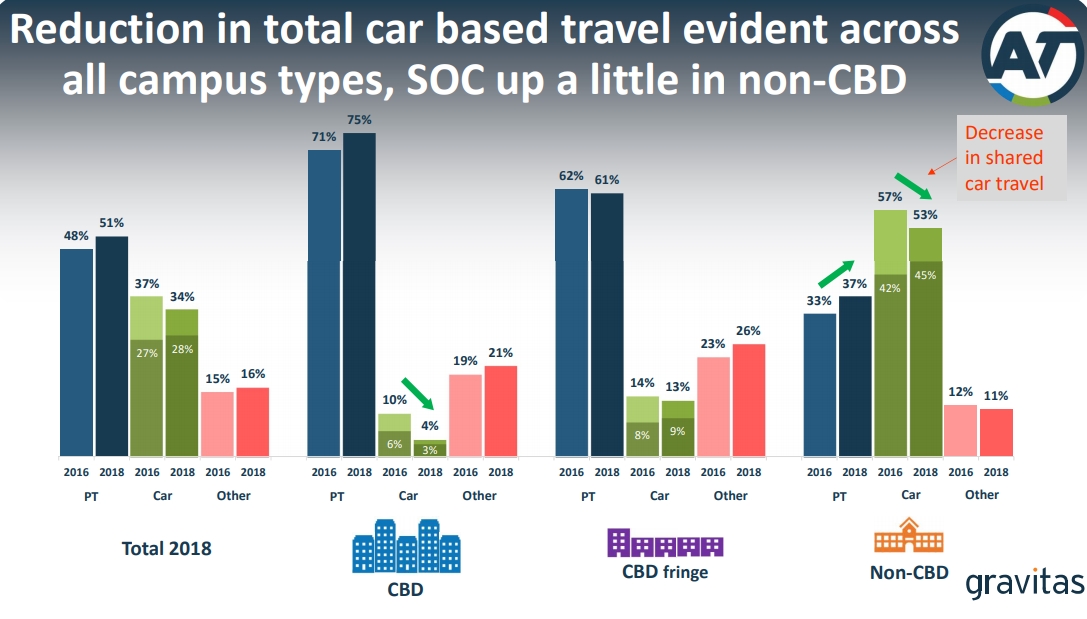
The various campuses have been split up into one of three categories based on where they’re located.
- CBD – University of Auckland – City, AUT – City, MAINZ
- CBD fringe campuses – University of Auckland – Grafton, University of Auckland – Newmarket
- Non-CBD campuses – AUT – Akoranga, AUT – South, Massey – Albany, Unitec – Mt Albert, MIT – Manukau, MIT – Ōtara
As you’d expect, PT use the highest the city and drops as you got further out.
For those interested, there are some specific graphs on mode use by campus.
Another fascinating insight is when students are travelling and that those attending campuses further from the city tend to travel in the peak more.
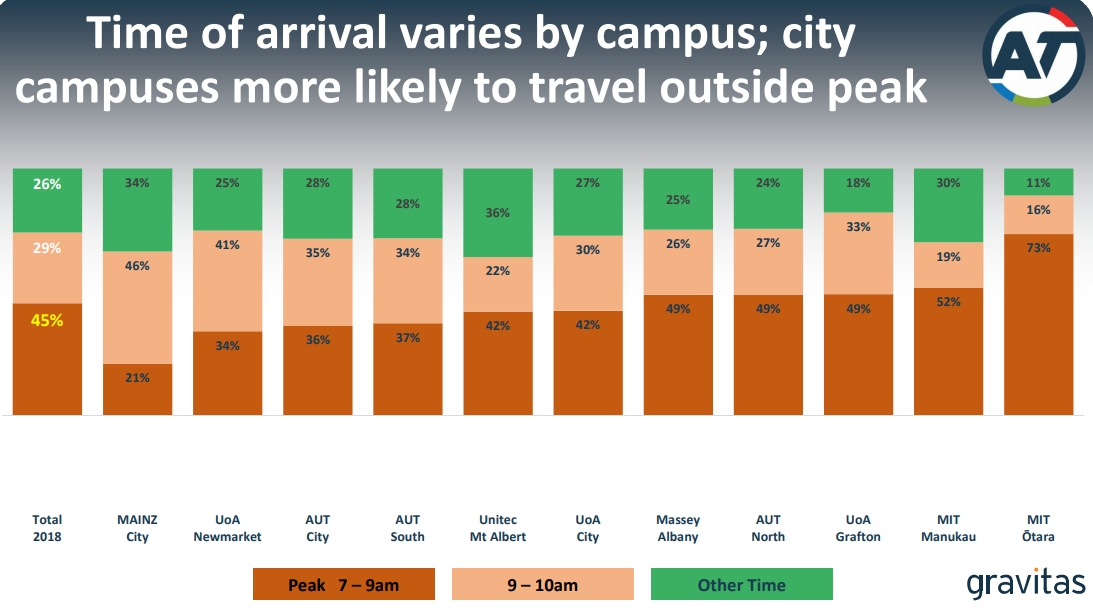
I wonder if that’s related in part to PT frequencies not supporting non-city travel as well. Another question asks about the ease of taking PT and as you’d expect, that declines the further from the city you get with Massey’s Albany campus rating the worst.
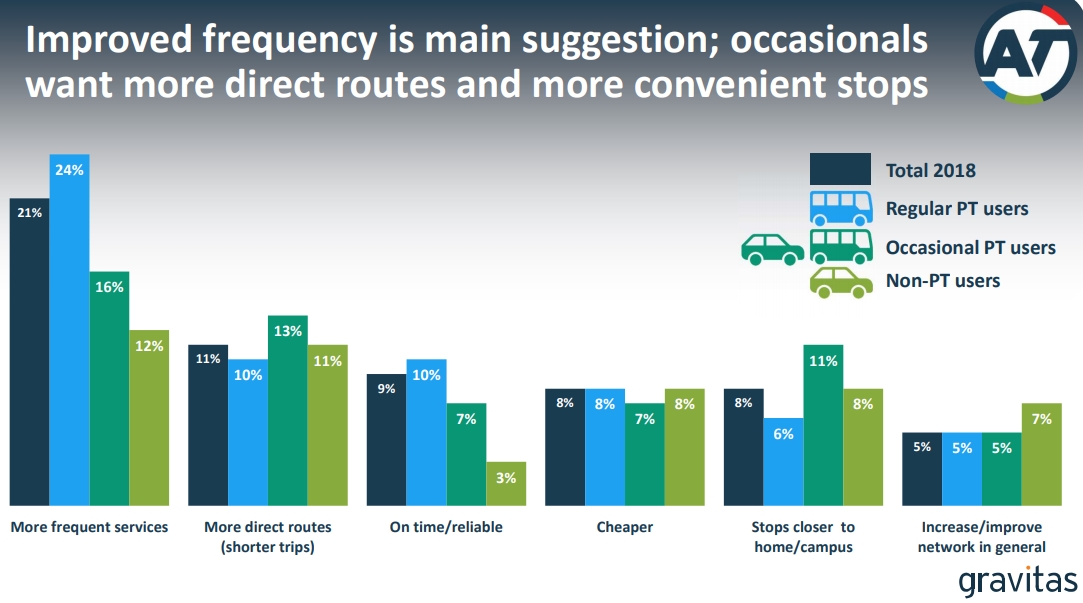
When asked for suggestions for improvements to PT, more frequent services are clearly the most important – as they are in most surveys.
 As mentioned, there is a lot more information in the report and the presentation but there’s some interesting insights included.

 Processing...
Interesting stuff, Matt, thanks. I notice that overall cycling mode share is 1%, and as you’d expect, it varies wildly with location. But I wouldn’t have picked which locations have highest cycling mode share:
UoA Newmarket has 9% (Why? What’s so connected about Newmarket? Is it even labelled correctly?)
UoA City 1%
AUT City 3%
The last two beg the question: Why is cycling mode at AUT 3 times that of UoA? If anything, UoA is slightly better connected to the cycling network. Are cycling facilities at AUT better than at UoA? Is there a cultural difference? Why is UoA only sitting at the regional average when it’s in the middle of the best cycling infrastructure?
I have some answers, thanks! The 9% cycling mode share at UoA Newmarket is not a mislabelling. Here are some potential reasons suggested by the researchers. They all make good sense to me, except perhaps for access to cycle lanes and trains.
The campus is used more by post-graduate students (73% of students surveyed were post-graduate) who are more likely to hold regular hours/be at the campus regularly (76% are there every day – significantly higher than all campuses)
Higher number of male students (75%) likely reflecting the main faculty at this new campus to date, is Engineering and Science
Older students – significantly higher share aged 25-39 (32%) or 30-39 (22%)
Have been at the campus for longer than those at other campuses, possibly meaning they have had more of a chance to explore different transport options
More access to cycle lanes/bus lanes in the area and less direct access to buses than the CBD campus, as well as less easy access trains on lines other than the Western line.
Significantly more likely to say they could cycle (35%) or walk (38%) when compared with students from all campuses.
Proximity to the campus. The table below shows suburbs with more than 2% of Newmarket students, all of which are potentially within cycling distance (Note: Auckland Council’s geo-coding could give a more accurate picture of distance).
Suburb CBD 17%; Mt Eden 7%; Grafton 6%; Parnell 6%; Mt Roskill 4%; Epsom 3%; Mt Albert 3%; Remuera 3%
Also, I misread the colours for AUT City. Instead of 3% mode share, cycling doesn’t even figure. The 3% is motorcycles and scooters. Here is a replacement graph with better colours (thanks, guys!): https://i.imgur.com/kvqYKRV.jpg
So UoA is not trailing AUT in the city; the opposite is true. Which makes you wonder about cycling amenity at AUT, but of course, there will also be demographic differences.
I would love to see a comparison of students and staff at these campuses.
I agree. There is very little student parking in the CBD campuses but there is some staff parking so it would be interesting to compare. To me this result highlights how important parking policy is as well as PT and active transport infrastructure provision. There is a great opportunity to reduce CBD parking when the LRT is opened.
Also considering the sheer numbers, I cant help thinking that in the long term:
– the LRT extension to Albany along the north shore busway would be good for students in more easily conecting the various campuses together.
– a second city line along Symonds Street and then Manukau Road out to Onehunga would probably get a lot of patronage.
As for CBD after hours numbers, do they run more night classes with workers studying part time after work?
While car use stayed the same or dropped at every other campus, between 2016 and 2018, car use at MIT Otara increased by 4%age points, including a whopping 12% increase in students driving alone. What’s going on at MIT Otara? Or let me see, is this mode shift happening because of the easing up of traffic on the SH1 since the Waterview Connection?
At a guess for MIT Otara – Location, it is terribly connected to anything other than the motorway. Mass amounts of parking (was free last time I checked).
It is served by the ’31’ frequent southern service, so bus patronage may change?
But it’s the huge change, from 45% to 57% of travellers driving alone. That’s huge in 2 years. The 31 looks good, but connection to the south isn’t so good.
It’s a small sample size at the campus level, non-representative results are to be expected in some measures when you are doing lots of comparisons.
Lots of free parking. First come, first serve.
Cheaper fuel & car rego costs I’d say have a lot to do with it. Interesting as the new southern network has been out since end Oct 2016.
New network out south only useful if you want to get to the train station to go into the city. Otherwise it is much quicker to take a car. They removed some useful routes direct to Manukau city centre. Now you have to go to the train. No thanks. I’ll just drive.
Really? That’s your take on the NN in the south?
IMO the South had the largest expansion in frequent coverage, which now connects most major centres. Travel within the sub-region is generally much easier now.
Which may be why the NN has generated so much patronage growth! Approximately +10% last time I looked. Not all those people are travelling to the city!
Yeah I think thats a poor take. Manukau central has fifteen bus routes leading to it from practically a suburbs of south auckland. The idea that you now have to take the train to get to Manukau is baffling to me.
And the idea that its only for getting a train to the city? South AUckland now has a grid of five frequent crosstown routes linking practically every local destination. I’d say getting to the city is now perhaps harder, to make getting around locally vastly easier.
It can be a bit of a false economy with all these various routes.
The last time they took the trains offline without rail replacements on a day when I needed to catch a train (so several months ago) I was confronted by a choice (this was unexpected news so I didn’t know the timings) of two busses to Manukau. I opted for the earlier one but as we were at stuck at some traffic lights I spied the 33 which was the later bus. I took this as evidence what I was on was slower so changed busses.
There was probably something else to this story. I had timetables on me so why didn’t I check? And I think the trains actually started working again while we were en route (too late for me) and I believe it was not a scheduled break in the trains.
I would say the NN has made it a massive pain in the arse to get to the City if you can’t catch a train. Especially when it’s a weekend. Low resilience/redundancy (forget the jargon). Why isn’t there something like the 33 that runs from town to Otahuhu? The best next bus is the weekday only 321 (pretty sure it’s still weekday only).
In fairness one of the main purposes of the NN was to make rapid transit the main way to get to the CBD where there are corridors. If there are buses with enough capacity to take people when there are issues on the rail network then they are carrying around a lot of air on days that the rail network is running fine.
Whirlsler’s resiliency point is important, none-the-less. If there are parallel bus routes into the city, perhaps working as feeders to each of the train stations along the way, then there is a service that can be beefed up with extra buses if the Southern Line is down. These spare buses should be used when maintenance is required on any of the lines, plus be in standby for unexpected issues, and even to solve bus bunching problems when there is no problem with the train lines.
If we choose not to have buses that are spare in this way, then we must factor in maintenance on the train lines that only happens in the wee hours of the morning, and invest in a way to minimise faults. Either way, it involves a cost, but it’s the sort of investment that increases reliability and therefore really works to bring about mode shift.
Yes, pretty much. It is way way way quicker to drive everywhere if you live out south and are going to locations out south. Taking a cross town bus is so slow. Plus so much free parking everywhere. Sure, it may be more frequent, but totally disagree that travel is easier, what with so many more transfers you have to do. It’s probably fine if you are old and get free buses.
The only bus that is on my street goes to the train station. I don’t want to take a bus in the wrong direction to the train station to get to where I’m going. Otherwise I have to get off at some random location and cross the road and catch a different route going in another direction. I used to have a regular bus on my street going there, now I have to walk over a km to another road to catch another less frequent bus to get there directly or take two different buses to get there. I used to have a direct bus to the CBD, now I have to go to the train station which takes much longer than before. Not to mention you always seem to miss the train and end up waiting an extra 10 minutes.
Sure, it may be better for some, but it is worse for others, like everyone on my street who works in Manukau City.
I know transfers are up a million % which is to be expected, but I wonder how it has affected actual bus usage out south and how much of that growth was going to occur anyway regardless of the new network change. Rising tide, all boats and what not.
Interesting more people are travelling to CBD during off peak.
Do it means the PT to CBD during peak has room for improvements?
Also MIT may need to have improves its PT infrastructure.
Probably more a reflection of when their timetables run.
This is completely unrelated to the article and I know we’ve spoken about the benefits of LRT vs other technologies but have we specifically considered trackless trams? There is some excellent high level info about them in this conversation article (link below). Does anyone have more in depth knowledge? Or know if this is being considered during the Light Rail investigation phase by NZTA? Or do the GA team think we should look into this?
Article found here: https://theconversation.com/why-trackless-trams-are-ready-to-replace-light-rail-103690
I know you’ve previously made the point we shouldn’t delay LRT in favour of some yet to be realised future technology that may not prove itself, but this article makes trackless trams seem much more advanced than that. Feels like trackless trams could be ideal for our new rapid transit corridors, I mean, we have so much damn roading already!
Matt, this is brilliant. GA team must definately try push for this. We can use the billions to provide ART accross Auckland given the millions saved per kilometer.
This ART technology looks like a great contender for Auckland. No rails in ground and no overhead wiring, just some road paint. I really hope AT or NZTA is evaluating this.
I don’t think that article can really be taken seriously. It makes no mention of needing to strengthen the road bed, something that is often done for bus lanes. Autonomous vehicles would likely follow the same wheel tracks so would require further strengthening. The cost associated with LR is not the tracks, it’s moving the services to strengthen the road, the same will likely apply for trackless trams.
Yes they have looked at this and are specifically considering this system. All I can say is these sorts of articles are high level ‘hype’, the devil is in the detail and in practice they are never as much of a silver bullet as you think, not for all corridors at least.
I am only familiar with UoA and UoA Newmarket but the survey misses a couple big differences between these campuses. It doesn’t capture well the difference in use between the campuses.They only look at students, and the student mix is far more post grad focused in Newmarket than it is in the city. Travel is also quite likely between the Newmarket and City campuses which favours buses and bikes, although I did walk back this morning.
Yes – and there are more males at Newmarket. There will be other important differences between the different campuses (eg is teacher training at Epsom older, and more female? Actually, where is the Epsom campus in this research?)
Interesting (table 9.5) that 36% of students who moved did so because transport costs are lower (e.g. fewer stages
travelled on public transport).
That’s quite a wake-up call when considering issues of fare equity. If fare differences between public transport users are so great that it forces people to relocate, then that tells me we have differences in pricing that are far too large, and inevitably tilted against students from outside central Auckland. I know well from talking to Uni lecturers that many students miss classes because of the cost of transport, an issue also reinforced by the findings in this report.
This price-sensitive market is giving us good data indicating that public transport pricing is too high, and that price disparities are causing major problems that need not exist. It would be really good to see lower fares (like in Vienna) and especially to see the fare structure equalised.
I don’t think it’s a startling revelation that people base where they live on travel costs to their place of employment or study.
There are many students in NZ that pay extra living costs because there is not a university in their city, are you suggesting this inequality needs to be balanced as well?
People who can afford to or have the flexibility to move closer to where they work or study do. Others simply wear the cost in Auckland despite our many institutions.
I think it is absolutely startling that students are having to move out of their homes because of transport cost differences within Auckland. 36% is huge!
If cost of living differences introduced by AT are forcing students out of homes then we have a real problem with our fare zones, Within Auckland the difference that fare zones make should be zero, or at least trivial. I think it;s terrible that so many people are impacted by artificial zone-based cost impositions that a full 36% of students have to move,
This is real evidence to me that we have to change things, and start thinking about equity in PT fares. We;re not doing it now, but other cities are and we can too,
How is a higher charge for a longer trip inequitable? The trip costs more to provide, it is quite reasonable to charge more for it.
Because it’s intricately related to the inequitable housing situation. The two have evolved together through the same policies. So while the purist would say that we can’t try to mitigate the inequitable housing situation with a flat fare structure, that’s actually ignoring that the cause of both problems are the same policies. The time PT takes prevents a flat fare structure from incentivising people to live on the outskirts. As a temporary measure during a housing crisis, it has merit.
The inequitable housing situation applies across the city, not just in the outer suburbs. Housing on the isthmus is seriously expensive and I would imagine there is travel cost stress in this area as well.
Moving in one zone is likely to save a student between $10 and $13 a week if they travel twice a day, I’d be very surprised if they are actually making this move due to cost pressures as the rent difference is likely to be more than that. Sounds more like people are using the survey to complain about the fact they have to pay for PT.
The wish for more frequent services is marked; especially compared to a wish for general network improvements, which is quite low. I wonder what the response would have been if they’d asked about services later at night / into the morning?
Something I haven’t seen mentioned above is the University buses which run between the campuses. I don’t know when they were introduced, but if it was recent, have they taken patronage from normal bus boardings? Are they even included in this article’s PT figures or are they not counted as public transport?
Yes, they are included: https://i.imgur.com/1sEtO7G.png
I have a better copy now. https://i.imgur.com/kvqYKRV.jpg
There’s a traffic survey for students being undertaken at my local highschool. Can anyone confirm if that’s a city-wide survey or likely to just be for the individual school?
They should do a survey on the number of school children travelling across Auckland to go to school in the city. Having kids go to their local schools will add significant capacity to the public transport network.
Yes. Also, someone needs to be bold to tackle the problem of parents dropping their kids off even when they are in zone, and it’s close.
In my suburb, if all the roads were 30 km/hr, and some extra pedestrian crossings were added, the walking environment would be much safer. Parents could let their primary age children walk to school, saving significant time by not having to do the drop off, meaning they can possibly start and leave work earlier, giving them more time with their kids at the end of the day. More adults would feel comfortable cycling to work, too. There would be much less congestion as a result of less school drop off traffic, so everyone’s trip would be faster, despite the lower speed limit. And those who need to drive their kids to school for reasons of disability or particular stress would benefit too, with less congestion and parking hassle.