This is the last post I’ll be writing on Greater Auckland, at least for the foreseeable future. Over the last nine months I’ve gotten short on time and short on new ideas – the sad consequence of a busy schedule of work and study. However, I remain thankful for the opportunity to push out some ideas on the blog, and discuss them with our many engaged and thoughtful readers.
As this is my swan song on the blog, I thought that it would be good to wrap up by returning to the key themes that I have highlighted during my time writing here.
The first theme is change. A successful city – or economy – embodies change. The things that worked yesterday may fail us tomorrow… so how can we be ready to adapt?
As it was, the city’s layout was bungled from the start, the main roads following ridges and gullies, and the others making the shortest and therefore the steepest cross-connections.
The 1902 introduction of electric trams—which did 6 to 8 mph uphill—and the power of the motor car finally broke the tyranny of Auckland’s encircling ridges.
It could have been worse. We could have got Felton Mathew’s original plan, which put the hub of Auckland (which he called Trafalgar Circus) up on Albert Park, with terraced quadrants (of which only Waterloo survives) striping the hillside. It was Mathew who gave Queen Street its name and location (see fold-out).
The fact is, streets are abstractions, shafts of space defined by an absence of obstruction, and are easily created and destroyed—as can be seen by the invention of our entire motorway network. Streets can die, like Little Queen Street, just west of the big one, which was buried under the downtown development. New streets are made: Mayoral Drive is an example.
Yet Queen Street had an unwavering destiny, rising from the mud to become Auckland’s most noble thoroughfare. Old photographs show better than any words the speed, vigour and untidiness of this process. So much was happening so swiftly as the margins of the town pushed out into the sea that it must have been as much a marvel to the people caught up in it as it is to us today. So much excavation and upheaval, mud and wreckage. So much sawn timber, so many new structures, so many boats. And all the time Queen Street was gaining stature as the town’s main social and emotional centre.
Poring over the old photographs, I get an extraordinary sense of fraternity with the people in them. Our history is short enough for there still to be considerable overlap in time and place and memory. Someone like myself, born in the early 1930s, grew up amid the crumbling, rusting detritus of the 19th century—and with people who were adult before this century began. Long-vanished Queen Street buildings were, and are, clearly remembered. I know how people in the photographs feel as they walk pensively in a busy throng, seek the shade on a hot day, crane for a view of a parade or run for a tram. Petty preoccupations can be adduced. I have been there too.
Jack Ross, 85, lives next door, having moved there in 1954, a few years before Tarr. He has lived in Henderson since 1936.
As a child he recalled walking to school in bare feet.
“Not now, you don’t walk to school, you get driven.”
He described a sense of freedom being able to walk outside, not having to look either way for cars as a child dashing across the then-gravel path.
The sense of community was also stronger – or at least more out in the open.
“You knew everybody too, now you go down there and you won’t know anybody.”
Meeting people is a challenge when most are simply passing through in cars, trucks, buses and vans.
Outside his window cars passing are a more common sight than people; any foot traffic at the surrounding stores were also unlikely to linger as most seemed intent on filling their shopping bags or petrol tanks before departing.
Despite what seemed like cars hurtling past at a constant pace with barely a sideways glance, Hazel Tarr, who is still driving, said it did not bother her.
“In fact, I quite enjoy it, I know what time it is by the traffic.”
“They all stop for me, I just go out, front-first into the traffic and they all stop and make way.”
Change will continue!
So why do we have a 30kmh zone in the Christchurch CBD? Well 17% fewer crashes & 22% fewer injuries in the first 18 mths isn't a bad reason (rest of CBD saw +29% crashes & +3% injuries at the same time) #LowerSpeedIsAboutSafety
Ask most Americans what they know about coal in central Appalachia, and they’ll tell you it’s a dying industry—one that US president Donald Trump famously vowed to revive during the 2016 election. “We’re going to put those miners back to work. We’re going to get those mines open … I see over here a sign, it says ‘Trump digs coal.’ It’s true. I do,” he told a rally in Charleston, West Virginia, in May 2016. “You’re going to be working your asses off.”
But the idea that the region’s coal industry is dying is not quite true. For much of the hundred-plus years of its existence, the industry has been on a kind of artificial life support, as state and federal governments have, directly and indirectly, subsidized coal companies to keep the industry afloat.
The costs of this subsidy aren’t tallied on corporate or government balance sheets. The destruction of central Appalachia’s economy, environment, social fabric and, ultimately, its people’s health is, in a sense, hidden. But they’re plain enough to see on a map. It could be lung cancer deaths you’re looking at, or diabetes mortality. Or try opioid overdoses. Poverty. Welfare dependency. Chart virtually any measure of human struggle, and there it will be, just right of center on a map of the US—a distinct blotch. This odd cluster is consistently one of America’s worst pockets of affliction.
At the root of these problems lies the ironic insight that struck Nick Mullins as he mined coal deep in the earth his family once owned. The extreme imbalance of land ownership in central Appalachia shifted the power over where and how Appalachians lived to corporations. The political and economic impotence of Appalachian residents that resulted has permitted a deeply cynical capitalist experiment to take place, in which coal companies are kept profitable by passing on the costs they incur to the public. The many ways in which politicians and coal barons have kept coal artificially cheap has, over the course of generations, devoured the potential of the area’s residents, and that of their economy.
Central Appalachia’s problems stem from its distinctive history. But the pattern of its struggles is not unique. Across America, obscure clusters of misery are growing in number and concentration—as people get sicker, poorer, and more isolated than they were just a few decades ago. Thus untangling the knotty problems of central Appalachia holds lessons for the rest of the country about how imbalances of wealth and power, created generations ago, can trap places and their people in the past.
It’s a long article but well worth reading in full. As an aside, this is why I’ve always been quite suspicious of economic development strategies that rely on mineral extraction. It is far too easy for the benefits to be concentrated, and the costs socialised. And even where that doesn’t happen, it can create a set of perverse and damaging incentives for the people involved.
I wrote the fifth paper last year for a postgraduate econometrics class. The aim of the paper was to investigate housing supply dynamics in New Zealand regions. In short: When house prices rise (indicating growing demand for a place to live) do people respond by building more homes? How many homes do they build? And what factors increase or decrease the size of the response?
Technically, it’s considerably more sophisticated than previous research papers I’ve written. This is mainly due to the fact that the data is a lot more complex, with more potential for statistical problems that may invalidate the conclusions of a naive analysis. So I did a few moderately tricky things to deal with those problems, finding that:
Higher house prices (relative to construction costs) cause an increase in home building at a regional level
This effect is smaller in regions where there are more delays in processing consents / building permits
It’s also smaller in regions that have more geographic constraints on developable land and where that land is more ‘built out’.
None of this is surprising; it all accords with intuition. What was intriguing was that all of New Zealand fast-growing cities have below-average predicted housing supply responses, as they tend to have above-average regulatory delay, above-average geographic constraints, or both. This means that when these cities grow, they are likely to have trouble building enough homes to keep up.
Without getting polemical, this is a problem: not one that becomes apparent immediately, but one that slowly, steadily adds up. New Zealand’s housing market has come gradually unstuck over the last generation.
What can be done to change that? That’s the tricky part.
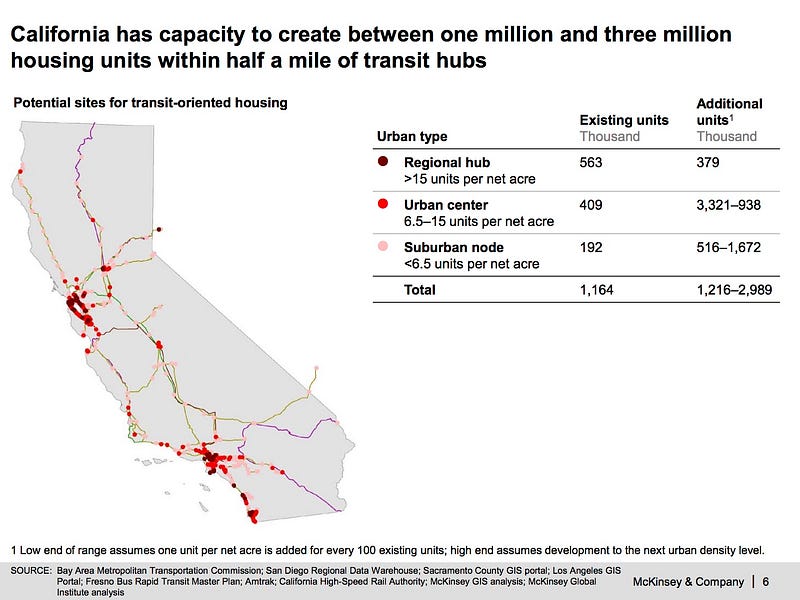
SB 827— Mandating Denser & Taller Zoning Near Transit
California has a number of communities with strong access to transit, and we continue to invest in public transportation. Too often, however, the areas around transit lines and stops are zoned at very low densities, even limiting housing to single family homes around major transit hubs like BART, Caltrain, Muni, and LA Metro stations.
Mandating low-density housing around transit makes no sense. It pushes more people to drive by leading to sprawl, thus undermining our economy and environment. It also leads to significant inequities, as limited density around transit spikes the prices of transit-accessible housing, meaning lower income and working class people struggle to live there and are pushed out into non-transit areas.
Transit-rich areas are *exactly* where we should be putting dense housing. We must build more housing near transit so that we can reduce reliance on cars and so that more people can access the benefits of transit.
SB 827 creates density and height zoning minimums near transit. Under SB 827, parcels within a half-mile of high-connectivity transit hub — like BART, Muni, Caltrain, and LA Metro stations — will be required to have no density maximums (such as single family home mandates), no parking minimums, and a minimum height limit of between 45 and 85 feet, depending on various factors, such as whether the parcel is on a larger corridor and whether it is immediately adjacent to the station. A local ordinance can increase that height but not go below it. SB 827 allows for many more smaller apartment buildings, described as the “missing middle” between high-rise steel construction and single family homes.
First, though we should be cautious in interpreting national level data, despite the number of homes being built exceeding Australia’s population increase, house prices have increased. Between September 2011 and March 2017 the number of residential properties in Australia rose by 9.5 per cent, outpacing Australia’s population increase of 8.2 per cent from 2011 to the end of 2016.
The numbers indicate that there is a supply side problem for low-income households in that the private housing market is simply unable to deliver housing that is affordable to those on lower (and, increasingly, moderate) incomes because there is a minimum cost of delivering housing that meets community standards. These costs are made up of the land price, taxes and other government charges, the physical construction costs of the dwelling and the profit required for taking on the development risk.
This is an interesting conundrum. I think their findings are partly due to the use of national data, which can be misleading. If you drilled down, I suspect you’d discover that some individual cities were quite a bit more constrained than the national picture indicates. And individual cities can exert a strong impact on aggregate outcomes.
Anyway, this leads on to a related problem that a lot of cities face: the barrier to building more affordable housing is fundamentally about cost. Joe Cortright reports on the issue in CityLab:
“We’ve got to bring down the cost structure of housing and not just find ways to subsidize it,” [California Governor Jerry] Brown said in his budget speech.
And the costs are substantial. In San Francisco, one of the largest all-affordable housing projects, 1950 Mission Street, clocks in at more than $600,000 per unit. That number isn’t getting any lower: new units in that city’s Candlestick Point development will cost nearly $825,000 each, according to recent press reports. Brown’s point is that at that cost per unit, it’s simply beyond the fiscal reach of California or any state to be able to afford to build housing for all of the rent-burdened households. And while the problem is extreme in San Francisco, it crops up elsewhere. In St. Paul, affordable housing—mostly one bedroom units—in a renovated downtown building cost $665,000 per unit.
More broadly, the case has been made that much publicly subsidized affordable housing costs much more to build than market rate housing. Private developers are able to build new multi-family housing at far lower costs. One local builder has constructed new one-bedroom apartments in Portland at cost of less than $100,000 a unit, albeit with fewer amenities and in less central locations than most publicly supported projects. In Portland, local private developer Rob Justus has proposed to build 300 apartments and sell them to the city for $100,000 each on a turn-key basis to be operated as affordable housing. Another possible cost savings measure: off-site construction. The University of California, Berkeley’s Terner Center has a report that explores the possibility for pre-fabricated, off-site construction to reduce construction costs.
[…]
Perhaps the central problem of housing affordability is one of scale: the number of units that we’re able to provide is too small. That’s true whether we’re talking about Section 8 vouchers (that go to only about 1 in 5 eligible households), or through inclusionary zoning requirements (which provide only handfuls of units in most cities). The very high per-unit construction costs of affordable housing only make the problem more vexing: the pressure to make any project that gets constructed as distinctive, amenity-rich and environmentally friendly as possible, means that the limited number of public dollars end up building fewer units. And too few units—scale—is the real problem here.
Leveraging new data tracking individuals’ migration, we find rent control increased renters’ probabilities of staying at their addresses by nearly 20%. Landlords treated by rent control reduced rental housing supply by 15%, causing a 5.1% city-wide rent increase. Using a dynamic, neighborhood choice model, we find rent control offered large benefits to covered tenants. Welfare losses from decreased housing supply could be mitigated if insurance against rent increases were provided as government social insurance, instead of a regulated landlord mandate.
A third theme I’ve continually come back to is is transport choices. It’s important for any reasonably-sized city to have a decent variety of public transport, walking, and cycling, in addition to the option to drive. Variety’s good for people and good for the economy.
John Darnley, from the Kāpiti Coast north of Wellington, helped create a modified e-bike that allowed him to hitch up his wife to the handlebars and enjoy the great outdoors.
They were married for 44 years – Avis living with Parkinson’s for the last 11.
JOEL MAXWELL/STUFF
The bike built to allow John and Avis Darnley to cycle together at Waikanae Beach.
John said the idea came after he started trying to think of ways to get some exercise, and free Avis from the house.
Inspired by the old icecream and butchers’ bikes, he he came up with the idea of the modified three-wheeler. Instead of a chiller box on the front, he has Avis and her wheelchair.
He took the idea to Southend Cycles in Levin, which modified an electric three-wheeler with a frame that would hold the chair.
KEVIN STENT/STUFF
Waikanae Beach’s John and Avis Darnley on an e-bike that allows the couple to cycle together. (File photo)
By December, John said a combination of intense early summer heat and a lingering flu for him meant they had not got out as much as they would have liked.
But they have still taken plenty of rides up and down the coast, having lunch together at the beach.
The reaction to the story from the Kāpiti community, and around the world, had left them amazed.
#OTD 10th Jan, in 1863, London’s first true Underground Railway opened: the Metropolitan. So tonight I’ve been to have a look. Behold! Baker Street then (1863) vs Baker Street now (2018, tonight) pic.twitter.com/OE8IMm5KQS
Boris Johnson splurged hundreds of millions to create an unreliable new double-decker for London. Most seriously of all, David Cameron’s government slashed grants to operators and funding to councils, leading to the widespread disappearance of local bus services across the country.
In London, buses are regulated by an authority and fares have been frozen. Elsewhere, services are being pared back and prices are rising. Passenger journeys have fallen to their lowest level in a decade: dipping under 5 billion annually across Britain, and to 4.4 billion in England – half of which are in the capital.
Yet an unlikely concession by a former Conservative chancellor has given transport authorities reason to hope. The Bus Services Act 2017, pinned to the regional devolution championed by George Osborne, could allow more areas to take back control and run routes and services as they see fit.
Manchester is likely to be the first to press ahead. Andy Burnham, the mayor, is blunt about his city’s bus system: “It’s confusing, it’s overpriced, a system where the private interest dominates over the public interest.”
More than 30 companies now run services in Greater Manchester, deciding their own routes, timetables and fares. Deregulation opened local markets to all comers and the result has been confusion and poor service, according to Burnham. Speaking to the Observer, he says: “We have ludicrous situations where people are told they can’t get on because the driver has no change. We don’t have audiovisual announcements, or real-time information.” Operators do track services, but Manchester lacks the comprehensive information other cities enjoy, he says. “What we want is a system that integrates with the rest of the transport system, is affordable, and has modern vehicles with ramps so people aren’t left at the bus stop.”
Lots of people underestimate the importance of the humble bus. My advice is: Don’t.
To conclude, I’m going to go way back and look at an earlier mode of transport: the wheelbarrow. An article in Low-Tech Magazine (which, ironically, is published online) considers the history and economic importance of the wheelbarrow in China:
In the characteristic Chinese design a much larger wheel was (and is) placed in the middle of the wheelbarrow, so that it takes the full weight of the burden with the human operator only guiding the vehicle. In fact, in this design the wheel substitutes for a pack animal. In other words, when the load is 100 kg, the operator of a European wheelbarrow carries a load of 50 kg while the operator of a Chinese wheelbarrow carries nothing. He (or she) only has to push or pull, and steer.
The result was an extremely powerful and agile vehicle. In 1176 AD, the Chinese writer Tsêng Min-Hsing noted enthusiastically:
“The device is so efficient that it can take the place of three men; moreover, it is safe and steady when passing along dangerous places (cliff paths, etcetera). Ways which are as winding as the bowels of a sheep will not defeat it.”
[…]
The importance of the Chinese wheelbarrow can only be understood in the context of the Chinese transportation network. Prior to the third century AD, China had an extensive and well-maintained road network suited for animal powered carts and wagons. It was only surpassed in length by the Ancient Roman road network. The Chinese road infrastructure attained a total length of about 25,000 miles (40,000 km), compared to almost 50,000 miles (80,000 km) for the Roman system.
The Chinese and Roman road systems were built (independently) over the course of five centuries during the same period in history. Curiously, due to (unrelated) political reasons, both systems also started to disintegrate side by side from the third century AD onwards, and herein lies the explanation for the success of the Chinese wheelbarrow. As we have seen, the one-wheeled vehicle appeared during this period, and this is no coincidence. Increasingly, it was the only vehicle that could be operated on the deteriorating road network. As F.H. King observed: “For adaptability to the worst road conditions no vehicle equals the wheelbarrow, progressing by one wheel and two feet”.
[…]
Joseph Needham tells a more positive story, noting that the network of wide roads was gradually replaced by an informal, low-tech infrastructure that was not less ingenious than the wheelbarrows that operated on it (see his pictures on the right and below). The Chinese answer to a decaying road infrastructure went much further than the adaptation of their vehicles:
“In many periods the government was interested primarily, and sometimes exclusively, in those roads and water-ways which were significant for tax-grain transportation and the conveyance of official messages. The upkeep of a multitude of local roads and paved pathways devolved, therefore, upon the people themselves, acting in their co-operative capacity under village elders and small-town worthies. In this context, religious associations, such as the Taoists Yellow Turbans about 180 AD, later so politically important, or the Buddhist fraternities afterwards, played a significant part. Making good roads was nothing less than a pious duty.”
“Thus in the course of time, quite apart from the Ancient and medieval imperial highways, China’s landscape became shot through with millions of miles of well-paved paths, suitable chiefly for pedestrians, porters with carrying poles, pushers of wheelbarrows, and men carrying litters. Rough unpaved cart-tracks predominated only in the Eastern plains. Those who, like the author, have followed these paved ways past woods and rice-fields for many a mile cannot think of them without intense nostalgia. There was a long tradition of such privately initiated roads going back to the Han or even earlier, and their total mileage far outstripped that of the government main roads as the ages passed.”
Interestingly, the modern, twentieth-century road network that appeared in China, and that Hommel was alluding to in 1937, did not immediately gave way to the automobile, but to another low-tech vehicle that is a worthy competitor for the wheelbarrow: the bicycle, a product of the Industrial Revolution that is even more efficient.
That’s it for me! Have a great weekend!
Share this
38 comments
Thanks for all your efforts! Sorry this was your last contribution; they were always thought-provoking.
Thanks David, Warren, and others! The conversations the blog’s started and the people who have contributed to the discussion are the best part about it, in my view!
Thank you Peter for all your hard work and insights. You have been one of the best writers for this website.
I don’t know if you have read the Richard Rothstein book “The Color of Law”. It details excellently (after a slow start) how race has impacted on housing and urban development in the US. For me the interesting aspect of the book is it was written from a race reconciliation perspective -yet it gave so many insights into housing and urban planning in the US.
In 1970 George Romney (Mitt Romney’s father) tried to do nationally -under Nixon as his Secretary for Housing and Urban Development -what Scott Wiener is attempting to do in California, by allowing more affordable, higher density housing in urban areas to counteract previous government acts which had created exclusive segregated communities. He famously failed.
Ultimately it was politics which stopped the US Federal government in the 1970s from correcting the mistakes it had made in urban form, segregation and making housing unaffordable to some segments of the community from the 1930s. Nixon cared more about the Republican Party pivoting towards racism (remember President Lincoln was a Republican) to capture Southern States votes, following the Democrats supporting the Civil Rights movement.
Brendon: I wonder if the underlying dynamic is class not race. The wealthy want to live in wealthy suburbs with wealthy neighbours and posh schools. When a race has a wealth distribution similar to the main population (say Dutch or Jews or Gujaratis) then segregated communities do not arise. Note in Auckland we have our own racial semi-segregation based around school zones despite the valiant efforts of our politicians (of all parties) and what is generally accepted to be the least racist population in the world.
The book I have read -The Color of Law. Quite conclusively proved that in the US, last century, various levels of government used the institutions of the state to increase segregation. Including preventing middle class blacks from entering white neighbourhoods.
Whether that was encouraging and enforcing private covenants which forbade the sale of housing to non-caucasians, to the compulsory acquisition of housing in black neighbourhoods for motorway projects (motorways were politically sold as a method for creating proper ‘homogenous’ communities), to preventing black applicants from gaining low cost government backed loans. The Federal housing authority in fact had mapped (Red Lined) ever single community in the US and if the community was integrated it was denied the government backed low cost housing loans on the pretext that in these neighbourhoods, house values were more likely to fall.
The list is quite sickening.
Bob going further back in US history. It has long been a tactic in US politics for some from the conservative, wealthier side of politics to prevent the progressive, poorer side from uniting behind progressive issues by exacerbating racial differences.
Brendon: certainly not disagreeing with your description of race and housing in the USA and the deliberate political policies that enforced it. However I was thinking of when I lived in Tower Hamlets, East London over 20 years ago. The local population was over 90% Bengali (very decent people BTW – good neighbours for me) living in council housing. It was the left wing politics [not the wealthy conservatives] that had enabled this semi-ghetto to come into being because they had made it impossible to inherit state housing – the heavily Jewish population had disappeared in a single generation as the children did well academically or were successful in business; according to the traders in the Spitalfield market they wanted to stay with their families but the absence of non-state housing at an affordable price had pushed them to the outer suburbs. Meanwhile Bengali’s arrived and their families followed and they either lived on benefits or making leather good or running restaurants (great food, great price) so with their children and non-working wives they qualified for the state housing. Local schools 96% Bengali (the remainder Somali). The racial housing in that area was not the will of the then politicians but the nature of the ethnic group involved and most significantly their poverty. BTW it is interesting to note that since I left the local council now comprising Bengali’s have changed the rules for inheriting state housing. American racial politics is an embarrassment they will carry forever. It is pleasing to contemplate that Louis Armstrong will be remembered and appreciated when the USA is long forgotten – as per J.S. Bach and Brandenburg.
I think you will find that virtually all Republican senators supported the Civil Rights Act and associated legislation. Nixon (from California) desegregated more schools than Kennedy or LBJ – kind of an odd thing to do if he is racist as you alleged.What was new at that time was that for the first time ever Democrats were supporting the legislation. The so-called “Southern Strategy” is a myth. It was not until the mid-1990s that the South went all Republican. But you don’t have to trust my word all the voting records are there – google them.
The point I was clumsily making is that historically the Democrats were the racist party. The Southern Democrats supported the racist Jim Crow laws that attempted to continue slavery type conditions ‘by other means’ (which was one of factors leading to the great African american migrations in the 20th century). It was the Federal government which had to apply the US Constitution -protection of citizen/minority rights -to prevent this from happening. From the 1960’s on there was a switch in US politics where increasingly it was Democrats not Republicans which led on this. Housing, transport and urban planning in the US being a key issue in this switch.
Still not 100% agree with you. But I think it’s important not to label groups too quickly. It’s just intellectually lazy.
Labelling whole groups with a stereotype is as you say intellectually lazy. But so is tip toeing around issues. If only Trump types can use strong language and confronting ideas, while everyone else is too afraid to offend, then where does that end? More Trumps?
The US is the champion of the motorway led sprawl of single family homes. These ideas spread around the world. They certainly influenced NZ. It is important to understand that the US had such an extreme version of this urbanisation system, in part due to racial reasons. To the point that now 70-80 years later a moderate reform (it wouldn’t be controversial in Europe or Asia) of allowing high density lower cost housing which is within easy walking distance of rapid transit is considered an aggressive political move in 2018 California.
Although almost all the over 800 distinct tribes of PNG lived in villages with some variation (semi-hunter gatherers had temporary villages and some tribes had separate large communal ens houses) there is one exception. The populous Western Highlands had separate single houses with large gardens. Probably had this way before mankind reach the Americas. I admit the the concept is more likely to have spread from Hollywood than from Mt Hagen.
Bob I am not against single family homes, it is the lopsided urban environments which systematically favours them at the expense of other options which I disagree with.
In the US about 120 years ago there was quite dense urban cores to most US cities which were integrated mixed race communities. A lot of this was affordable housing, but also poor quality, overcrowded and disease prone -although conditions were improving with better sanitation from sewerage and fresh water infrastructures.
There was probably always going to be some movement away from these overcrowded conditions, but these ‘slums’ could have been improve upon -to be attractive open communities. That is what places like Tokyo did.
Instead white americans were systematically encouraged to flee to suburbs, while black americans were prevented from doing the same, creating a greater degree of segregation than originally existed.
In the US, inner city areas were unfairly demonised for much of last century, causing a lopsided urban form that has been hard to fix.
NZ has not nearly been as bad, but there is some echoes for us.
P.S I have Huguenot ancestors who spent a generation in Spitalfields well before the more recent Bengali immigrant wave.
Huguenot then Irish weavers then East European Jews mainly escaping from Russia and finally Bengalis. Up to the 1970’s it was predominately Jewish but when I arrived in 1990 they had just about all left except for a rare pensioner. Well worth a visit – not far from Tower Bridge.
Thanks Brendon – I’ll track down that book; it sounds excellent.
Having grown up in the US, I’m quite aware of the role that race has played in housing policy (and everything, really). As Bob says, there’s often a class element overlaid on it.
And, unfortunately, America’s racial divisions – the long legacy of slavery – make it incredibly difficult to solve problems that are otherwise fairly straightforward. Like, say, building more homes in more places. New Zealand seems very different by comparison – not perfect by any means, but a lot less poisonous.
Adding to the chorus: many thanks for your posts. It was one of your posts a year ago that got me interested in this website.
“” A successful city – or economy – embodies change. “” Sounds OK until you think about it. My grandson’s great-grandmother died last week; she was the widow of a chief in the Highlands of PNG and probably her childhood was the same as her ancestors for the previous 60,000 years; same valley, same villages, same customs/culture, same economy and without overdoing Rousseau’s ‘noble savage’ maybe a good life until quite recently. Of course with no change this website would have little purpose and there would be little reason to study town-planning.
The Chinese have a curse ‘may you live in interesting times’ which is a synonym for change. The trouble with ‘change’ is it is not always for the better. So from my limited perspective I can like the Hop card, think well of the Northern Busway, like the extra buses added in recent years but still regret the increasing congestion. Certainly their is a noticeable slow change of mood from ‘smile at a stranger’ village atmosphere to the ‘do not meet their eyes’ city lifestyle of my own local shopping districts and that is rather sad.
So suggested rewrite: “”A successful city – or economy – must be resilient to change””.
Thanks Bob – really appreciate all the discussions with you! And yes, I think that “resilient to change” is a good edit. Especially if we define “resilient” to include “maximising the upside from change”.
I was rather pushing a debatable point – I’m sure everyone knows change is almost as certain in the future as it has been for the last 180 years (for me the future started with railways – the first time the majority of the population could move around).
I’m more scared of the future than you so I would stick to the definition “resilient: able to withstand or recover quickly from difficult conditions”. That is why I have expressed preference for network to star shaped city design and also worries about the high-end predictions for sea-level change – say plus 2 metres – what would we save and what would we abandon? It is also why I worry about earthquakes and apartment buildings – Christchurch taught us a lesson not to be too trusting of modern architects and civil engineers. My single story weatherboard house on low concrete piles is far more likely to be semi-inhabitable. And maybe someone can write an article about how our tunnels and the harbour bridge would survive a serious shake or 9m metre tidal wave. Now my mind is worrying about volcanic ash – maybe a decent apartment would be a better proposition than my 1960’s weatherboard home.
As a civil engineer by training (but never specialised in structures) I have to declare an interest but, given that all but TWO buildings in Christchurch survived earthquake accelerations that were DOUBLE what the design standard was, I’m relatively trusting of engineers actually. Sure, hundreds were subsequently pulled down to be rebuilt, but they did exactly what they were designed to do – stay up and save lives while the quake actually happened.
P.S: My thanks too, Peter for your great contributions here; keep in touch!
Thanks Glen. I think I may have pushed that point too far. I’m just distrustful by nature. I’m told given a bad enough earthquake nothing will stand – even the beehive. At least my PNG friends just pick up the pieces and are back to normal after a few days. Their earthquakes often being far worse than Christchurch. You are right we have to have standards and then just hold the professionals to those standards. Double is significant. Choice of standard is interesting – the UK has flooding standard of once a 100 years whereas the Dutch with good reason have a standard of once a thousand years.
Yes, it was interesting how many questioned the earthquake standards when they couldn’t just get straight back into their buildings afterwards and resume living/working/etc. You could of course specify such a design standard (and we often do for critical buildings like hospitals), but for general use buildings it would be rather expensive. Is society prepared to pay that?
thanks for your effort over the last nine months to assemble these articles 🙂
Thanks for the contribution, and all your thoughtful posts. Good luck with work and study.
The historical view is interesting. As a kid I recall walking to school past paddocks with cows. Now it is all housing. I hope we do not sprawl too much more.
I agree with the need for denser housing near transit. I would love to see medium density (3-4 story) along the LRT.
Thatcher killed the buses? Well the Guardian would say that (they talk of her as parents used to frighten children with Napoleon is coming to eat you 80 years after he died). And of course it may well be true but what is definitely true is London Buses pre-Thatcher were not great. I lived in Walthamstow and worked in Southgate and the bus was every 20 minutes round the North Circular. Not a bad service when it worked but if a conductor did not turn up for work the bus did not run and you waited another 20 minutes for a full bus to drive by and then a further 20 minutes for an overcrowded bus. Thus arriving for work half an hour late and often soaking wet and cold. After experiencing this once too often I bought my first car.
“The 100-year capitalist experiment that keeps Appalachia poor, sick, and stuck on coal” is an epic read and certainly supports my suspicions that those communities, not unheard of in the US, are where they are economically and kept where they are because of naked capitalism and pure greed.
The part where the dismal lives lived, of the towns inhabitants in that area are simply blamed on the individuals bad choices made me think, where have I heard that before? That was prior to remembering such lazy dismissive thinking is a go- to staple for Newstalk ZB and the likes of Bill English and his colleagues.
Peter I’ve really enjoyed your contributions here over the years! I hope that you will still pop in once in a while to pass along links to some fascinating reading.
Having worked with redlining maps in Los Angeles, I can confirm the primary source documents themselves include explicitly racist reasoning for the ratings of various neighborhoods. Not just blacks, but any decent number of non-white “subversive racial elements” would contribute to the redlining assessment. Here’s the neighborhood description from 1939 for one of LA’s densest historic neighborhoods outside of downtown. https://dsl.richmond.edu/panorama/redlining/#loc=15/34.0490/-118.2740&opacity=0.8&city=los-angeles-ca&sort=16&area=D36&adimage=3/42/-120
California SB-827 is silent on its relationship with California Environmental Quality Act (CEQA). I think that this will hinder it from making any kind of sweeping progress, should it be passed. Matters such as air quality, noise, traffic, biodiversity, and heritage are covered by CEQA, and while there’s no reason an applicant couldn’t argue that this “matter of statewide importance” is an overriding consideration to any real or perceived adverse effect under CEQA, such a route is very time consuming, expensive, and uncertain. Count on even the moderately savvy antagonists of density in their neighborhood to know how to bring a CEQA lawsuit against a development they dislike. And conversely, it potentially means that such overriding considerations could inadvertently harm the resources CEQA is supposed to protect, like actual historic districts and endangered species, particularly where nobody has the will or resources to fight it.
Some interesting analysis on housing supply increases. Seems unlikely that increasing supply wouldn’t result in lower prices than if supply hadn’t been increased. I think the type of demand is often underestimated. We hear about Houston being cheap due to cheap sprawl land. But I also think the demand is mainly from people who want to live there because it is cheap. When prices inch up the demand drops. But in Auckland and many other popular cities we have the weird situation where demand increases when prices increase.
Thanks Peter for all your contributions over the years, and it will be sad not to have you writing articles – you bring a uniquely Nunns approach to the blog. Hopefully you will still be commenting at times?
Re the bus deregulations – I’m surprised they are still bothering to deregulate the bus services in the UK as I thought they had given up on that as a complete bloody disaster many years ago. But it is an interesting story – it all makes sense on paper, the pro-free-market people said to themselves, “Why do we only have one bus operator, why can’t someone else put a bus service together too, it will be better for the public, it will be cheaper as well, and some lucky entrepreneur will make a packet from it”. Only the last sentence came true.
The reality of bus deregulation is quite different from the theory. In practice, if you have an existing service with buses at 9.00 and 9.30 and 10.00 etc, then a competing bus service might offer seats at 9.15, 9.45, 10.15 etc. Sounds great! But then each service only gets 50% of the customers, and can’t break even. Disaster! So, the answer is, the second service arrives at one minute to 9, etc, to steal all the customers, so, A) you’re no better off, and B) the original service now goes bust. Another disaster! The only way for the original service to survive now, is that it plans its service to be 2 minutes before it’s advertised time. Neither of them can afford to pay the drivers the full wage, and neither of them can afford to pay for a proper bus depot, and as they are all trying to stop at the same bus stop, the streets are crowded and the traffic is munted, no one gets to work on time, the buses are old imported diesels that belch smoke everywhere…
Moral of the story is that sometimes the best system is a well-organised, benevolent monopoly.
Thanks for signing up for news from Greater Auckland! Keep an eye on your inbox for regular updates.
Processing...
STAY IN TOUCH
We love being able to keep you in the loop - it means we know theres a community of like-minded people who are keen on making Auckland better on bikes. Sign up for updates about what's happening, and how you can be part of it.
Source: Housing supply responsiveness in Australia: distribution, drivers and institutional settings (AHURI Final Report 281).


 Processing...
Thanks for all your efforts! Sorry this was your last contribution; they were always thought-provoking.
+1 Yes, always appreciated.
Thanks David, Warren, and others! The conversations the blog’s started and the people who have contributed to the discussion are the best part about it, in my view!
The then and now pictures of Baker Street are remarkable. Moral: infrastructure decisions can have long lasting consequences.
Thank you Peter for all your hard work and insights. You have been one of the best writers for this website.
I don’t know if you have read the Richard Rothstein book “The Color of Law”. It details excellently (after a slow start) how race has impacted on housing and urban development in the US. For me the interesting aspect of the book is it was written from a race reconciliation perspective -yet it gave so many insights into housing and urban planning in the US.
In 1970 George Romney (Mitt Romney’s father) tried to do nationally -under Nixon as his Secretary for Housing and Urban Development -what Scott Wiener is attempting to do in California, by allowing more affordable, higher density housing in urban areas to counteract previous government acts which had created exclusive segregated communities. He famously failed.
https://www.propublica.org/article/living-apart-how-the-government-betrayed-a-landmark-civil-rights-law
Ultimately it was politics which stopped the US Federal government in the 1970s from correcting the mistakes it had made in urban form, segregation and making housing unaffordable to some segments of the community from the 1930s. Nixon cared more about the Republican Party pivoting towards racism (remember President Lincoln was a Republican) to capture Southern States votes, following the Democrats supporting the Civil Rights movement.
Brendon: I wonder if the underlying dynamic is class not race. The wealthy want to live in wealthy suburbs with wealthy neighbours and posh schools. When a race has a wealth distribution similar to the main population (say Dutch or Jews or Gujaratis) then segregated communities do not arise. Note in Auckland we have our own racial semi-segregation based around school zones despite the valiant efforts of our politicians (of all parties) and what is generally accepted to be the least racist population in the world.
The book I have read -The Color of Law. Quite conclusively proved that in the US, last century, various levels of government used the institutions of the state to increase segregation. Including preventing middle class blacks from entering white neighbourhoods.
Whether that was encouraging and enforcing private covenants which forbade the sale of housing to non-caucasians, to the compulsory acquisition of housing in black neighbourhoods for motorway projects (motorways were politically sold as a method for creating proper ‘homogenous’ communities), to preventing black applicants from gaining low cost government backed loans. The Federal housing authority in fact had mapped (Red Lined) ever single community in the US and if the community was integrated it was denied the government backed low cost housing loans on the pretext that in these neighbourhoods, house values were more likely to fall.
The list is quite sickening.
Bob going further back in US history. It has long been a tactic in US politics for some from the conservative, wealthier side of politics to prevent the progressive, poorer side from uniting behind progressive issues by exacerbating racial differences.
Brendon: certainly not disagreeing with your description of race and housing in the USA and the deliberate political policies that enforced it.
However I was thinking of when I lived in Tower Hamlets, East London over 20 years ago. The local population was over 90% Bengali (very decent people BTW – good neighbours for me) living in council housing. It was the left wing politics [not the wealthy conservatives] that had enabled this semi-ghetto to come into being because they had made it impossible to inherit state housing – the heavily Jewish population had disappeared in a single generation as the children did well academically or were successful in business; according to the traders in the Spitalfield market they wanted to stay with their families but the absence of non-state housing at an affordable price had pushed them to the outer suburbs. Meanwhile Bengali’s arrived and their families followed and they either lived on benefits or making leather good or running restaurants (great food, great price) so with their children and non-working wives they qualified for the state housing. Local schools 96% Bengali (the remainder Somali). The racial housing in that area was not the will of the then politicians but the nature of the ethnic group involved and most significantly their poverty. BTW it is interesting to note that since I left the local council now comprising Bengali’s have changed the rules for inheriting state housing.
American racial politics is an embarrassment they will carry forever. It is pleasing to contemplate that Louis Armstrong will be remembered and appreciated when the USA is long forgotten – as per J.S. Bach and Brandenburg.
I think you will find that virtually all Republican senators supported the Civil Rights Act and associated legislation. Nixon (from California) desegregated more schools than Kennedy or LBJ – kind of an odd thing to do if he is racist as you alleged.What was new at that time was that for the first time ever Democrats were supporting the legislation. The so-called “Southern Strategy” is a myth. It was not until the mid-1990s that the South went all Republican. But you don’t have to trust my word all the voting records are there – google them.
The point I was clumsily making is that historically the Democrats were the racist party. The Southern Democrats supported the racist Jim Crow laws that attempted to continue slavery type conditions ‘by other means’ (which was one of factors leading to the great African american migrations in the 20th century). It was the Federal government which had to apply the US Constitution -protection of citizen/minority rights -to prevent this from happening. From the 1960’s on there was a switch in US politics where increasingly it was Democrats not Republicans which led on this. Housing, transport and urban planning in the US being a key issue in this switch.
Still not 100% agree with you. But I think it’s important not to label groups too quickly. It’s just intellectually lazy.
Labelling whole groups with a stereotype is as you say intellectually lazy. But so is tip toeing around issues. If only Trump types can use strong language and confronting ideas, while everyone else is too afraid to offend, then where does that end? More Trumps?
The US is the champion of the motorway led sprawl of single family homes. These ideas spread around the world. They certainly influenced NZ. It is important to understand that the US had such an extreme version of this urbanisation system, in part due to racial reasons. To the point that now 70-80 years later a moderate reform (it wouldn’t be controversial in Europe or Asia) of allowing high density lower cost housing which is within easy walking distance of rapid transit is considered an aggressive political move in 2018 California.
Although almost all the over 800 distinct tribes of PNG lived in villages with some variation (semi-hunter gatherers had temporary villages and some tribes had separate large communal ens houses) there is one exception. The populous Western Highlands had separate single houses with large gardens. Probably had this way before mankind reach the Americas. I admit the the concept is more likely to have spread from Hollywood than from Mt Hagen.
Bob I am not against single family homes, it is the lopsided urban environments which systematically favours them at the expense of other options which I disagree with.
In the US about 120 years ago there was quite dense urban cores to most US cities which were integrated mixed race communities. A lot of this was affordable housing, but also poor quality, overcrowded and disease prone -although conditions were improving with better sanitation from sewerage and fresh water infrastructures.
There was probably always going to be some movement away from these overcrowded conditions, but these ‘slums’ could have been improve upon -to be attractive open communities. That is what places like Tokyo did.
Instead white americans were systematically encouraged to flee to suburbs, while black americans were prevented from doing the same, creating a greater degree of segregation than originally existed.
In the US, inner city areas were unfairly demonised for much of last century, causing a lopsided urban form that has been hard to fix.
NZ has not nearly been as bad, but there is some echoes for us.
P.S I have Huguenot ancestors who spent a generation in Spitalfields well before the more recent Bengali immigrant wave.
Huguenot then Irish weavers then East European Jews mainly escaping from Russia and finally Bengalis. Up to the 1970’s it was predominately Jewish but when I arrived in 1990 they had just about all left except for a rare pensioner. Well worth a visit – not far from Tower Bridge.
Thanks Brendon – I’ll track down that book; it sounds excellent.
Having grown up in the US, I’m quite aware of the role that race has played in housing policy (and everything, really). As Bob says, there’s often a class element overlaid on it.
And, unfortunately, America’s racial divisions – the long legacy of slavery – make it incredibly difficult to solve problems that are otherwise fairly straightforward. Like, say, building more homes in more places. New Zealand seems very different by comparison – not perfect by any means, but a lot less poisonous.
I have a story which developed after the rent control leading to gentrification article went up on the net. It is a discussion about Supply and Demand and ultimately about how to make rent cheaper.
https://medium.com/land-buildings-identity-and-values/how-to-make-rent-cheaper-da55b4bfe99a
Adding to the chorus: many thanks for your posts. It was one of your posts a year ago that got me interested in this website.
“” A successful city – or economy – embodies change. “” Sounds OK until you think about it. My grandson’s great-grandmother died last week; she was the widow of a chief in the Highlands of PNG and probably her childhood was the same as her ancestors for the previous 60,000 years; same valley, same villages, same customs/culture, same economy and without overdoing Rousseau’s ‘noble savage’ maybe a good life until quite recently. Of course with no change this website would have little purpose and there would be little reason to study town-planning.
The Chinese have a curse ‘may you live in interesting times’ which is a synonym for change. The trouble with ‘change’ is it is not always for the better. So from my limited perspective I can like the Hop card, think well of the Northern Busway, like the extra buses added in recent years but still regret the increasing congestion. Certainly their is a noticeable slow change of mood from ‘smile at a stranger’ village atmosphere to the ‘do not meet their eyes’ city lifestyle of my own local shopping districts and that is rather sad.
So suggested rewrite: “”A successful city – or economy – must be resilient to change””.
Thanks Bob – really appreciate all the discussions with you! And yes, I think that “resilient to change” is a good edit. Especially if we define “resilient” to include “maximising the upside from change”.
I was rather pushing a debatable point – I’m sure everyone knows change is almost as certain in the future as it has been for the last 180 years (for me the future started with railways – the first time the majority of the population could move around).
I’m more scared of the future than you so I would stick to the definition “resilient: able to withstand or recover quickly from difficult conditions”. That is why I have expressed preference for network to star shaped city design and also worries about the high-end predictions for sea-level change – say plus 2 metres – what would we save and what would we abandon?
It is also why I worry about earthquakes and apartment buildings – Christchurch taught us a lesson not to be too trusting of modern architects and civil engineers. My single story weatherboard house on low concrete piles is far more likely to be semi-inhabitable. And maybe someone can write an article about how our tunnels and the harbour bridge would survive a serious shake or 9m metre tidal wave. Now my mind is worrying about volcanic ash – maybe a decent apartment would be a better proposition than my 1960’s weatherboard home.
As a civil engineer by training (but never specialised in structures) I have to declare an interest but, given that all but TWO buildings in Christchurch survived earthquake accelerations that were DOUBLE what the design standard was, I’m relatively trusting of engineers actually. Sure, hundreds were subsequently pulled down to be rebuilt, but they did exactly what they were designed to do – stay up and save lives while the quake actually happened.
P.S: My thanks too, Peter for your great contributions here; keep in touch!
Thanks Glen. I think I may have pushed that point too far. I’m just distrustful by nature. I’m told given a bad enough earthquake nothing will stand – even the beehive. At least my PNG friends just pick up the pieces and are back to normal after a few days. Their earthquakes often being far worse than Christchurch.
You are right we have to have standards and then just hold the professionals to those standards. Double is significant. Choice of standard is interesting – the UK has flooding standard of once a 100 years whereas the Dutch with good reason have a standard of once a thousand years.
Yes, it was interesting how many questioned the earthquake standards when they couldn’t just get straight back into their buildings afterwards and resume living/working/etc. You could of course specify such a design standard (and we often do for critical buildings like hospitals), but for general use buildings it would be rather expensive. Is society prepared to pay that?
thanks for your effort over the last nine months to assemble these articles 🙂
Thanks SB – keep up the good work yourself!
What’s a double ped crossing phase?
It’s a Barnes Dance that runs twice every full signal cycle – ie after the north/south traffic phase and then again after the east/west phase.
Peter
Thanks for the contribution, and all your thoughtful posts. Good luck with work and study.
The historical view is interesting. As a kid I recall walking to school past paddocks with cows. Now it is all housing. I hope we do not sprawl too much more.
I agree with the need for denser housing near transit. I would love to see medium density (3-4 story) along the LRT.
Thatcher killed the buses? Well the Guardian would say that (they talk of her as parents used to frighten children with Napoleon is coming to eat you 80 years after he died). And of course it may well be true but what is definitely true is London Buses pre-Thatcher were not great. I lived in Walthamstow and worked in Southgate and the bus was every 20 minutes round the North Circular. Not a bad service when it worked but if a conductor did not turn up for work the bus did not run and you waited another 20 minutes for a full bus to drive by and then a further 20 minutes for an overcrowded bus. Thus arriving for work half an hour late and often soaking wet and cold. After experiencing this once too often I bought my first car.
“The 100-year capitalist experiment that keeps Appalachia poor, sick, and stuck on coal” is an epic read and certainly supports my suspicions that those communities, not unheard of in the US, are where they are economically and kept where they are because of naked capitalism and pure greed.
The part where the dismal lives lived, of the towns inhabitants in that area are simply blamed on the individuals bad choices made me think, where have I heard that before? That was prior to remembering such lazy dismissive thinking is a go- to staple for Newstalk ZB and the likes of Bill English and his colleagues.
Thanks for the reference and your input.
Peter I’ve really enjoyed your contributions here over the years! I hope that you will still pop in once in a while to pass along links to some fascinating reading.
Having worked with redlining maps in Los Angeles, I can confirm the primary source documents themselves include explicitly racist reasoning for the ratings of various neighborhoods. Not just blacks, but any decent number of non-white “subversive racial elements” would contribute to the redlining assessment. Here’s the neighborhood description from 1939 for one of LA’s densest historic neighborhoods outside of downtown. https://dsl.richmond.edu/panorama/redlining/#loc=15/34.0490/-118.2740&opacity=0.8&city=los-angeles-ca&sort=16&area=D36&adimage=3/42/-120
California SB-827 is silent on its relationship with California Environmental Quality Act (CEQA). I think that this will hinder it from making any kind of sweeping progress, should it be passed. Matters such as air quality, noise, traffic, biodiversity, and heritage are covered by CEQA, and while there’s no reason an applicant couldn’t argue that this “matter of statewide importance” is an overriding consideration to any real or perceived adverse effect under CEQA, such a route is very time consuming, expensive, and uncertain. Count on even the moderately savvy antagonists of density in their neighborhood to know how to bring a CEQA lawsuit against a development they dislike. And conversely, it potentially means that such overriding considerations could inadvertently harm the resources CEQA is supposed to protect, like actual historic districts and endangered species, particularly where nobody has the will or resources to fight it.
Thanks for the feedback on redlining Norma. It will be interesting to watch how California and the US progress with housing and urbanisation issues.
Some interesting analysis on housing supply increases. Seems unlikely that increasing supply wouldn’t result in lower prices than if supply hadn’t been increased.
I think the type of demand is often underestimated. We hear about Houston being cheap due to cheap sprawl land. But I also think the demand is mainly from people who want to live there because it is cheap. When prices inch up the demand drops. But in Auckland and many other popular cities we have the weird situation where demand increases when prices increase.
Shame to see the end of these interesting series of posts from Peter Nunns.
Perhaps a new regular contribution could be invited from someone like Mike Lee?
Thanks Peter for all your contributions over the years, and it will be sad not to have you writing articles – you bring a uniquely Nunns approach to the blog. Hopefully you will still be commenting at times?
Re the bus deregulations – I’m surprised they are still bothering to deregulate the bus services in the UK as I thought they had given up on that as a complete bloody disaster many years ago. But it is an interesting story – it all makes sense on paper, the pro-free-market people said to themselves, “Why do we only have one bus operator, why can’t someone else put a bus service together too, it will be better for the public, it will be cheaper as well, and some lucky entrepreneur will make a packet from it”. Only the last sentence came true.
The reality of bus deregulation is quite different from the theory. In practice, if you have an existing service with buses at 9.00 and 9.30 and 10.00 etc, then a competing bus service might offer seats at 9.15, 9.45, 10.15 etc. Sounds great! But then each service only gets 50% of the customers, and can’t break even. Disaster! So, the answer is, the second service arrives at one minute to 9, etc, to steal all the customers, so, A) you’re no better off, and B) the original service now goes bust. Another disaster! The only way for the original service to survive now, is that it plans its service to be 2 minutes before it’s advertised time. Neither of them can afford to pay the drivers the full wage, and neither of them can afford to pay for a proper bus depot, and as they are all trying to stop at the same bus stop, the streets are crowded and the traffic is munted, no one gets to work on time, the buses are old imported diesels that belch smoke everywhere…
Moral of the story is that sometimes the best system is a well-organised, benevolent monopoly.