Last year, 292 people died unnecessarily on our roads. That is the lowest result in over a decade and only the fourth time in the last 70 years we’ve seen fewer than 300 deaths in a calendar year. Yet, while it is 292 people too many, with each death being a tragedy for the family and friends of those lost, in terms of fatalities this is also arguably the best (least worst) year on the roads that New Zealand has yet seen.
The last time we saw fewer than 300 deaths in a calendar year was in 2014, with 293 deaths; and the lowest ever was a year earlier, with 2013 seeing 253 people die on our roads.
That’s a far cry from the mid-80’s, when nearly 800 people died on our roads annually. Between then and 2013, with a small amount of annual variation, there has been a consistent downward trajectory for road deaths as vehicles, roads and education, enforcement all improved.
But from 2014 onwards, road deaths increased again for a sustained period, and even months of COVID restrictions of travel to essential journeys only weren’t enough to bring deaths back below 300.
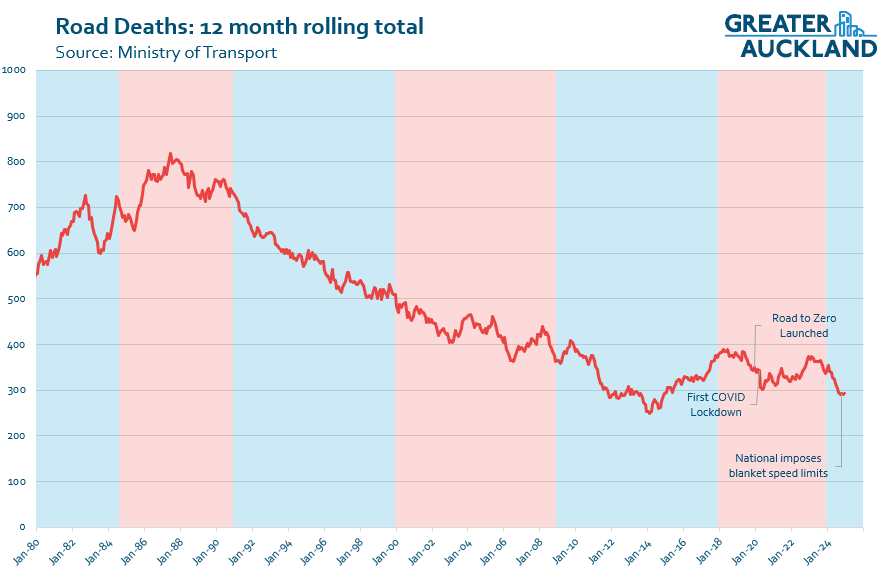
In 2024, after a bad January, for much of the year we were on track to get close to that 2013 record with monthly results at or below those 2013 levels. Then a stark rise in the last few months of the year put paid to that. Notably, October was when the government announced they were going to impose blanket speed limits on the country (while claiming the opposite). Their aim is to raise speed limits in towns, cities, and on the open road, to improve “productivity”, in contravention of all available evidence and the wishes of many communities.

Adjusting for population and travel
Of course, there is one big difference between the numbers in previous years and now, and that is population.
In 1987, when there were almost 800 deaths on our roads, the country had a population of 3.3 million – which is two million fewer people than we have now. Even between 2013 and now, our population has increased by over 900,000 people.
The number of deaths per 100,000 people is a common metric used internationally to compare the road safety performance of different areas, and on that basis 2024 was arguably our best ever year. Our population increase means that last year saw 5.5 deaths per 100,000 people, slightly below the 5.7 of 2013 and well below the 23.8 of 1987.
However, it is worth remembering that this figure is still much higher than many of the countries we like to compare ourselves to. Australia is around 4.5 per 100,000 people, and parts of Europe are even lower. Norway, with a population only slightly higher than New Zealand – and with a more difficult geography and climate – had just 90 traffic deaths last year, which is just 1.6 per 100,000 people. Many other countries in Europe are in the 2-4 range.
There have also been some suggestions that last year’s low result is just because of the economy – but these claims don’t stack up. Despite the current government-induced recession we’re in now, vehicle kilometres travelled are the highest they’ve ever been: over 49.2 billion km travelled in the 12 months to the end of September, with trucks making up over 818 million km of that.
By comparison, in 2013, the vehicle fleet travelled just under 40.3 billion km with trucks making up almost 637 million km. Likewise, the 2013 result was after the country had largely recovered from the Global Financial Crisis.
Road deaths measured per 1 billion km travelled is another common metric: on that basis, for 2024 New Zealand is sitting at around 5.8. Again, this is the lowest it’s been, with 2013 sitting at 6.3 deaths. For comparison purposes, Australia is at around 4.9 under this metric, and Norway about 2.
Both the per capita and per km travelled metrics are shown below. As you can see, theyfollow a very similar path. Note that in both cases the data is only available up until September 2024, but the trend is clear.

Who is it that dies on our roads?
These charts are based on some quick breakdowns by the Ministry of Transport, and show where the change in the last few years has come from.
By Mode
As you can see below, deaths in 2024 (orange) were down for most of the ways people use the roads.

The 2024 numbers are yet to be finalised, but so far it looks like last year will be the lowest for pedestrian deaths (at least in the last 40 years). Perhaps those raised table crossings are actually working?

By Age and Gender
The MOT data for road deaths by age uses inconsistent age banding, which distorts the picture somewhat. However, on a per capita basis it’s clear that young drivers (15-24) have the most deaths per 100,000 people, compared to other age groups.

Despite coming down significantly in the last few years, almost twice as many men die on our roads compared to women.

By Road Type
We can see that deaths decreased more on local roads than on state highways over the last few years.

Close-up on Auckland
Finally, there were 36 deaths on Auckland’s roads in 2024. That’s down from 47 in 2023, but not the lowest we’ve ever seen.

Post-script: these two MoT charts I came across while preparing this post tell a grim story about pedestrian deaths, regarding who’s most likely to be injured by a vehicle, and when: children and young people, on the way home from school.


 Processing...
My brother was one of the 292. The crash happened 500m south of where a wire rope barrier finished for no apparent reason. Out of nowhere a Police car arrives and a police officer asks if you are the brother of and tells you what happened. She then asks you to attend the morgue the next day where you look at you big brother and say yes that is him. His dog had 4 week old puppies so together with one of the Miss mfwics you buy a crate and cart 10 dogs home to reside in your kitchen. Then comes a funeral and cleaning out his house and shed. Only after all that is done do you really appreciate how much you relied on him to help with things or for advice when the chainsaw wont start etc.
292 deaths is 292 too many. We cant stop them all, that is bullshit. But we can try harder and spend more on treatments we know work.
Makes the current Transport Minister’s attitude even harder to take
So sorry to hear that miffy. A sad reminder about the wider impacts from every single road death.
Sorry to hear that Miffy and your last paragraph is correct, we won’t be able to prevent every death but by aiming for it we’ll do a lot better than just hoping things will change. There’s so much more we could be doing.
So sorry for your loss Miffy.
Im angry. For all the avoidable deaths on our roads.
” 500m south of where the wire rope stopped for no apparent reason.”
There is a very generic reason, and its NZTA not delivering on the funding provided for median barrier protection. I dont know your brothers details, or the actual reason for lack of median barrier protection, but many of the 292 🙁 would be alive if we had median barriers in place, and NZTA leaning in to safety initiatives.
I was very sad to read of your brother’s death. So many other deaths could be prevented by taking Vision Zero seriously. “Everything that works, all at once” is the only moral choice for road safety. BCR can be used to choose between options for the greatest benefit for however much money can be assigned to safety, but never “Don’t bother to do that, we’ll do this instead. “
Sorry you are going through that, mfwic. I would feel so bereft.
Maybe the annotation ‘National imposes blanket speed limits’ should be a more meaning ‘National drops blanket speed limits’, or ‘National increases speed limits’ or ‘National prioritises road speed’.
There were no blanket speed limits but Simeon’s change means there are now. A classic case of blaming/accusing your opponent of doing what you’re doing yourself
Yes I think the term limit makes people think something is lessening. So what we are seeing is “National imposes blanket speed increases” ( with no regard to safety )
I still think ‘National increases speed limits’ would be more meaningful. Have a look at how it was covered in news articles.
Even keeping to the posted speed limits angers some drivers. Several sections of the route I took through town on the weekend were 30km/h and 40km/h as we went through local suburban villages on the way to Sumner Beach. Then as soon as we hit a 50km/h area the car, driven by a middle aged woman, that had been right up my @?$& the whole way overtook me going 70km/h – perhaps annoyed I’d been going the speed limit.
Simeon Brown’s blanket speed limits have given permission to ignore safety (and current legal speeds) and drive like loons.
The saddest thing is all the commentary of confused reporters asking “It’s a mystery why deaths have dropped. No one knows why roads are safer. Maybe it’s newer safer cars?”
It’s speed reductions, raised tables, cycleways, and improved intersections. It’s too soon to say, but I fear what is going to happen when road speeds have blanket speed increases without concern for local community desires.
It could be we are getting the best of both worlds at the moment. Lower speed limits and safety interventions while having an increased focus on enforcement especially of drugs and alcohol. It will be interesting to see how stats play out as speed limits increase and safety measures are wound back. The government has exposed itself to a lot of risk.
It might be worth comparing the figures from your article with the demographic outlines of NZ.
The aging of our population means the 15-19 and 20-24 cohorts – the two prime accident groups – are a smaller proportion of our population that ten or twenty years ago.
Also the declining birthrate from say the year 2000 might be showing an absolute decline in the numbers- the high school and university recruiters will know this.
Has the number of general (non-fatal) injury accidents dropped as well?
Likewise non-injury accidents. There might be a link here with the improved safety features (airbags etc) in vehicles- survival rates are better.
Just posting here because it may be useful to someone.
From a coroners report 2021 found the following summary of the funding for the Road to zero activity class and its intentions. im reviewing the outcomes, but im not there yet. My interest is in the lack of suitable median barriers, and non-delivery in this area, and driving delivery in this space – far faster than the vision zero non-goal of 40% dsi reduction by 2030
copy/paste follows –
Waka Kotahi NZ Transport Agency (“Waka Kotahi”) recently released their National Land Transport Programme for 2021-2024.[1] Waka Kotahi have developed a new activity class titled ‘Road to Zero’. Examination of the nationwide Road to Zero class and the Waikato Regional Summary in the 2021-2024 programme confirms significant investment and improvements are intended and/or underway. Some extracts from Waka Kotahi’s programme are as follows:
Road to Zero is a new activity class in the 2021–24 National Land Transport Programme (NLTP). It is dedicated to investment in safe system responses to risk on our roads.
Over the next three years, $2.9 billion will be invested in Road to Zero activities throughout New Zealand. A priority in this period is to continue an infrastructure and speed improvements programme that will reduce deaths and serious injuries. These are on state highways and local roads that carry the highest risk to road users and the most traffic.
In 2021–24, we intend to install approximately 183kms of median barriers, 75 roundabouts and make speed changes on 16,500kms of local roads and state highways to prevent an estimated 213 deaths and serious injuries.
On state highways, we have work planned on 17 high risk corridors throughout New Zealand. This includes 51 intersection improvements, 25 new roundabouts, and 164kms of median barriers.
On local roads, working with local government, we plan to invest in more than 1074 projects. This includes 50 roundabouts, 19km of median barriers, and speed changes on 13,500kms.
In 2021–24 we’ll be investing $1.24 billion in the Road Safety Partnership Programme to provide road policing activities approved by the minister which will maintain 1,070 dedicated road policing staff and about 20% of non-dedicated police staff time undertaking these activities. These activities are focused on restraints, impairment, distraction and speed (RIDS) and include almost doubling enforcement of speed and drunk driving.
We’ll be investing about $197 million in national, regional and local road safety promotion and education campaigns supporting Road to Zero programmes. This includes a campaign to raise public awareness of Road to Zero.
Road safety remains a significant issue in the Waikato, with more than 20% of New Zealand’s annual deaths and serious injuries occurring in the region. During the 2021–24 NLTP, we’ll be focusing on speed management and infrastructure improvements to make journeys safer across the region.
Throughout Waikato during the next three years, we will invest to improve safety across 15 high-risk corridors to significantly reduce annual deaths and serious injuries in the region.
Work continues to improve safety along the existing length of SH1 between Cambridge and Piarere. We’re installing flexible median barriers to reduce the number of crashes along this section of highway. More than 2.4kms of median barriers have already been installed and work continues finalising designs to extend this work to Maungatautari Road. This NLTP we’ll invest $35 million to address safety along 26.3kms of the corridor.
On 12km of the East Tāupo Arterial, $13 million is being spent widening the roadside shoulders, and installing flexible median safety barriers and safety barriers where hazards cannot be removed.
Speed management reviews are already underway for Hamilton City (SH1, SH3 and SH26), West Waikato (SH23, SH31 and SH39) and Mangatarata to Katikati (SH2–SH25), with a number of additional routes planned for review during this NLTP period.
More than $2 million is being spent improving safety at six high-risk areas in central and eastern Waikato, with rumble strips, better roadside signage and long-life line markings. These areas are: SH5 Waiohotu Road to Oturoa Road; SH5 Webster Road to Waiohotu Road; SH25 Waitakaruru to Kōpū; SH27; SH 26 Tatuanui to Waharoa; SH2 Mackaytown to Waikino; and SH29 Matamata–Piako boundary to SH28.
I have found a little RtZ reporting – but delivey on median-barriers yet to be located. The reporting is about the reporting, not the delivery it seems.
https://www.transport.govt.nz//assets/Uploads/MOT-4163-Road-to-Zero-Monitoring-Report-2021-P8_V1.pdf
13km of new median-barrier were added in 2021/2 not on track for the goal of 400km by 2024
About a year ago, the New York Times reported on an increase in night-time pedestrian deaths in America:
https://www.nytimes.com/interactive/2023/12/11/upshot/nighttime-deaths.html
They also noted a big increase in pedestrians aged 18-64 being killed, while other ages were down.
“October was when the government announced they were going to impose blanket speed limits on the country (while claiming the opposite)”
Evidence as to where they claimed the opposite? Or is this just another classic claim that isn’t true but sounds good for the blog. Simeon has claimed many times to be getting rid of blanket DECREASES he never said he wouldn’t take a blanket approach to increasing. I get you’re upset the speeds are going up because it might make a drivers trip faster but maybe use the truth and not a whole bunch of lies to get the point across. Will be interesting to see if the road toll remains stable or decreases when the economy improves.
“when the economy improves”
HAHAHAHAHAHAHAHAHAHAHAHAHAHAHAHA *inhale* HAHAHAHAHAHAHAHAHAHA
“Simeon has claimed many times to be getting rid of blanket DECREASES he never said he wouldn’t take a blanket approach to increasing”
He never said he would either. He campaigned on localism though:
https://www.interest.co.nz/public-policy/126380/local-government-minister-simeon-brown-advocates-localism-parliamentary
“Councils know what is needed for their communities and should not be forced or mandated to take a one-size-fits-all approach..”
Until, it seems, that relates to communities wanting speed restrictions.
There’s a good reason why speed limits aren’t completely decided by councils there will always be govt oversight. If a majority of people in the Waikato supported 120kmh on many of their roads (likely given the voting base) would you accept that being implemented? Or one of the councillors who is anti car decided they want a 5K speed limit would that be accepted for the economy? No. Speed limits should be a nationwide agreed standard 40 for pedestrian areas/ smaller urban streets 60 for arterials much like Australia where the road toll is significantly lower. A majority of NZers want the faster speeds even if they are blanket especially in Auckland where the National party got a higher % of the vote than anywhere else in the country. Given it isn’t just the locals using the roads and we all collectively contribute to the NLTF it should be a nationwide vote on what the standard is. Tell anyone who complains to suck it up and move on wait for the next election. Some local areas have major roads passing through them of course those few houses will want a slower speed limit so people use “some other road” but it’s reality they have to live with it just like people living near the airport or living near Eden park we tell them to suck it up it’s part of where you live. Also if you support local decision making I assume you want all roads lowered from 60 to 50 put back to 60? As almost all of them had a majority against it.
AT has by stealth accidentally acknowledged 60 is a safe and appropriate speed for an urban environment and gone against their own mantra “small increases in speed limits don’t save time” I was riding along the eastern busway because YES I do use PT regularly and noticed the speed limit increases to 60K on the busway… funny that you’d think based off all ATs evidence that would make an insignificant time saving wonder why they would then lower the speeds of the surrounding roads to 50? Unless of course safety was never a concern and it was all an anti car culture war. That 60K busway stretch shows AT themselves think that small increase in speed saves a lot of time because well… it does. Even a 10 second time saving to some is huge and to AT that really matters. So yes when the speeds are reversed back to 60 just remember AT never actually had a safety justification to lower them in the first place it was mostly “for consistency” and also remember that almost all major roads in AUS are 60+ and the road toll is much lower oh and no speed tables or raised crossings either so let’s figure that one out.
“Also if you support local decision making I assume you want all roads lowered from 60 to 50 put back to 60? As almost all of them had a majority against it.”
Citation needed.
If speeds are increased on a relatively unobstructed road like a busway or an expressway, the time savings will be more significant.
If you increase speed limits on Ponsonby Road, Onewa Road or on Broadway, most trips will not be affected as you will sit in traffic anyway and the next set of traffic lights comes up soon.
If you increase speed limits on roads with a lot of other users, such as children walking or people (children or not) riding bikes, it has the potential to increase their risk significantly.
If the increased speed limit is generally too high, it will create a higher risk of vehicle crashes even if nobody outside of a car is involved.
So yes, it can make sense to raise speed limits on busways where there are limited interactions with other road users that are not specially trained drivers while still promoting lower speeds where a lot of normal drivers and untrained road-users (e.g. children) are about, e.g. around schools.
” I was riding along the eastern busway because YES I do use PT regularly and noticed the speed limit increases to 60K on the busway”
Yes this was like this from once it was opened and work sites cleared. It’s a tiny bit of road with good protection for pedestrians, barrier to cars on other side and no intersections from memory so perfectly fine.
Hi Sasha I’d love to provide some citation for this. Please see the link to when at first had the idea to drop a major arterial (Aviemore Dr) most submissions were against this proposal. Now id love to show more evidence but AT has covered up much of the Phase 3 speed limit information originally available even the interactive map has been made private. https://at.govt.nz/media/1988541/feedback-report-local-board-howick.pdf
Going to need a fact check on this one “Simeon has claimed many times to be getting rid of blanket DECREASES he never said he wouldn’t take a blanket approach to increasing”
Actually the national part policy position going into the election as quoted from their “accelerate NZ” document was “National will change the rules that set speed limits so that economic impacts – including travel times – and the views of road users and local communities count, alongside safety. This will mean many state highways going back to 100 km/h speed limits and many local roads going back to 50 km/h, except where that would be unsafe.”
The except where it would be unsafe bit got dropped post election and replaced with blanket changes when he got expert advice and realized most of what he was wanting to do was unsafe.
“Me want no speed restrictions!”
Thanks Auckland Trains. Got it.
When will AT announce what roads are being reversed back to the old speeds? How are other councils like Ashburton already on this and AT we don’t even know which roads are being reversed…??? I don’t get how they can use the excuse it would take lots of time given how quickly they implemented the reductions?
https://www.rnz.co.nz/news/national/538969/ashburton-loses-turtle-town-title-with-speed-changes
When will AT announce what roads are being reversed back to the old speeds? How are other councils like Ashburton already on this and AT we don’t even know which roads are being reversed…??? I don’t get how they can use the excuse it would take lots of time given how quickly they implemented the reductions? https://www.rnz.co.nz/news/national/538969/ashburton-loses-turtle-town-title-with-speed-changes
AT will drag it out until Simeon loses the portfolio for another role. As no point spending millions to achieve something locals and AT disagree with, when there are plenty of other things that cost millions that locals and AT want.
Can they be forced to do it? If they have no budget to do it, it can’t get done.
Yes they have to do it. If they claim they don’t have the money that’s total rubbish they simply use the funds they were going to use to lower the speeds to reverse them they don’t even need consultation on this saving further $. AT was extremely disingenuous in the media saying things like it’ll cost $25M yes that might be true but a huge chunk of that is electronic sinage that AT was going to purchase for Katoa Ka Ora anyway. And the other 7M would’ve been mostly spent lowering limits so yes the money is there they just have to be dragged kicking and screaming to do it.
I don’t think any council should be paying for it. If Central Government (whatever shade) wants to enforce the change, they should be footing the bill, no?
What should actually happen and it’s the fair way to do it is councils like Ashburton who were forced to introduce a blanket permanent 30K near the schools when the council and residents wanted a variable speed zone deserve to have their new signs/installs funded. It wasn’t their fault Labour forced them to introduce a permanent speed. The same should apply to anywhere they can prove people actually wanted the slower speeds (will be rare but some of the roads reduced to 40 probably had a bit of support). Obviously AT doesn’t deserve a dime as they couldn’t have more arrogantly ignored public feedback at every stage of the speed reductions although I guess that’s not the ratepayers fault either (the sooner they go the better). Going forward I hope speeds are just set with how the general public wants them urban roads probably ranged from 40-60 and rural roads 70-100. Every submission and opinion is taken into account and taken seriously. If we keep going back and forth with our speeds we are not making roads any safer and we are not listening to our people which is a tragedy. Govt should be for the people by the people not for a vocal minority or a group of experts. I know it’s not easy to say that but it experts said building a 4 lane highway from Cape Reinga to Bluff was the only way to get close to “zero deaths” we would be against that and rightfully so. We the people are the experts let’s not get bullied by people who claim to be smarter than us everyone is an expert when it comes to a healthy democracy.
I’m sorry, but uneducated Larry Farmer with lead poisoning screwing up his brain is in no way comparable to someone who has studied urban planning and transport for years. opinions aren’t equal when it comes to objective things like that.
You lot banging your “democracy” drum are just pissy carheads sad you don’t get your way 100% of the time. Your lot already are happily leading humanity to societal collapse and environmental destruction because “the majority want consumerist capitalism and private vehicles”.
The sums up the government perfectly that they are now allowed to have variable speed limits around schools without having electronic signs to alert drivers to this.
That may be a fair criticism, but the variable speed limit and electronic signage works perfectly well over this side of the ditch (I’m in Sydney). In fact the degree of compliance with the 40kph limit during the school times is great to see.
How are driveway pedestrian accidents counted? It seems that there isn’t a month that goes by without hearing of at least one if not more young children being killed in their own driveways.
On the one hand it’s easy enough to imagine how it can/could happen, but on the other it’s shocking that it still happens with such regularity!
With more and more townhouses going in (don’t have a problem with higher density) and less areas to play, driveway accidents are only going to increase unless we do something about it. Perhaps the government should look at assistance for people to put in fencing etc (similar to pool fencing), or make it compulsory for cars to have reversing cameras.
See the first paragraph on this page for commentary on what is and isn’t included in the road toll statistics.
https://www.transport.govt.nz/statistics-and-insights/safety-road-deaths
The fault is, to a large degree, poor driving skills, not a lack of fencing.
Do they assess the loss of lives vs the loss of time? It reminds me of Covid in a way, where we took millions of hours of time away from the general population in the form of lockdowns to prevent significantly less hours of life being taken away due to death.
When I was driving to Napier the other weekend, the 80kmh speed limit cost the 4 people in our car about 15 minutes each, or 1 hour in total. Multiply that by the thousands that use that road each day, it is a lot of time taken away from people’s lives. I am not saying it isn’t worth it, it definitely felt a lot safer, but there does need to be some kind of balance. Maybe 90kmh speed limit could have achieved most of the positive with only half of the negative for example.
The time taken away from people’s lives on your car trip was still only 15 minutes per life. You can not simply multiply that by 4 and say ‘we’ lost an hour. You spent it with 3 people you cared enough about to drive them to Napier.
The time taken away from those 292 lives was much more.
The time taken away from relatives, friends, colleagues of those 292 lives also was much more – see Miffy’s comment.
I believe that is already taken into account and is the reason that we don’t have a 30kmh speed limit on the open road.
Interestingly, most cost-benefit evaluations of travel time vs crashes / veh.operating costs / emissions when rural limits are lowered result in a good BCR for the change – ~80km/h is actually the “optimal” speed limit on most undivided rolling rural highways.
Regarding SH5 between Napier – Taupō; before the 80km/h speed limit was introduced, there used to be over 10 deaths & serious injuries a year along that section – now it’s not even 5 DSIs/yr…
Some people above may need to read this – especially the simple graphic:
https://at.govt.nz/projects-initiatives/region-wide-auckland-projects-and-initiatives/vision-zero-for-the-greater-good/safe-speeds-programme/safe-speeds-the-reasons
So, in Auckland, 36 deaths on a population of appx. 1.5 million is like 2.5 per 100,000. That is a lot less than the national average.
Because Auckland is largely urban, and speed limits in most rural areas there have been reduced (with good results). Rural fatality rates are always higher than urban ones for the simple reason of speed and physics – not surprisingly therefore that most people in NZ die on rural roads.
Road deaths per capita and distance travelled reduced in a somewhat linear fashion from 1991 to 2013. Since then they have gone up and down, but not changed to the same extent.
Much of this earlier reduction must be due to:
-progressively improved vehicle safety, crumple zones, abs brakes, airbags, etc.
-speed cameras and resulting general reduction in open road speed.
-drink driving becoming less acceptable.
-increased volume of traffic and acceptance that overtaking isn’t particularly worthwhile.
-construction of seperated straighter state highways
-road improvements and removal of black spots.
I would say that since that time there haven’t been improvements to the same extent.
There are always those that take risks, make mistakes and behave poorly that must result in a baseline death rate.
I was amazed to see several articles about this over the summer, none of them did any analysis, only some reckons from various people, and not one mentioned lower speed limits.
Vision zero needs to be communicated better, the arguments against it always seem to be we’ll never achieve zero so there’s no point trying. Targets don’t work like that though. If youre kicking a goals, you know you might not get 100%, but it doesn’t stop you aiming for that! Anyone saying we can’t get zero so we shouldn’t try basically has a loser mindset. I’m a big believer in aiming for perfection even if you know you’ll have to keep improving and may never attain it, the definition always shifts the closer you get anyway. I’ve seen vision zero work in industrial environments where the old mindset was always that there will be accidents, and we turned it around to not accept that. And those companies stay in business and people want to work for them, because they get that improvement mindset and it flows to other areas of the business.
Yeah, I heard some bizarre reckons like people were not buying fancy expensive sports cars and m’bikes at the moment and that was explaining the drop. Traffic volumes (aka “exposure”) are a big determinant in crash numbers and even Matt noted that it actually hadn’t gone down in 2024, despite the supposed economic conditions.
I’d agree that lower speeds introduced over the past few years are bearing some fruit, as are other Safe System treatments like raised platforms/crossings and median/roadside barriers. You only have to look at the relative success of recent lower speeds in Auckland, Christchurch, Invercargill and on sections of highways like SH6, SH5, SH75, etc. Let’s not forget the steeped up enforcement efforts of NZ Police over the past two years – “Operation Open Roads” has certainly seen a decent drop in rural casualties.
Vision Zero is a tricky one to get through to people when they think “but you can’t eliminate 300-odd deaths just like that!”. I prefer to think about breaking the problem into manageable chunks. Only 9 cyclist deaths last year? How do we get that closer to zero? Only 10 kids under 15 years old killed? Only 7 people in Christchurch? etc, etc. If you don’t think that Vision Zero is ever possible, I would note that Upper Hutt City, Ashburton District, and Horowhenua District had NO road deaths last year…
A nice analysis Matt of what is a good news story at the fatality level at least (I really wish the media and others would stop calling a “toll” though, as if it’s just a price we have to pay…).
Still, it’s important to appreciate that the difference between a fatality and “just” a serious injury is often the slim hand of fate – and for many people, a serious injury is actually a life-changing experience. In NZ we categorise things like broken bones and major burns under “serious injury”, but it also includes things like losing a limb or requiring 24/7 ongoing care for the rest of your life. Again, I wish we would also pay attention to what the stats tell us about deaths AND serious injuries…
And in that respect, 2024 wasn’t brilliant regarding changes in serious injury numbers – a little over 2430 recorded last year, with virtually no change from 2023 figures (although they are down on pre-2020 numbers). Reported minor injuries are also down about 5% to a little over 10,700 a year. The reality is too, based on hospital admission stats, that these road injury numbers are under-reported – you can more than double those numbers to get a better idea of serious injury stats each year.