The other day I wrote about the need to fix the Symonds St on-ramp. In the post I included a graph looking at average daily traffic volumes on it over the last 15 years. While pulling the data together for the graph I thought it would be useful to compare it to other city centre ramps. It also struck me that while I’ve looked at motorway volumes in the past, I’d never really looked at motorway ramp volumes before. In taking a look at them I found some fascinating results.
First, here are the ramps I included in this analysis. It includes all ramps that enter or exit near the city centre. I’ve included Khyber Pass and Newton Rd in this due to their proximity to the city.
 Just to confirm, the ramps included in this post are:
- Fanshawe St – On and Off ramps
- Cook St – Off-Ramp
- Wellington St – On-Ramp
- Nelson St – Off-Ramps, separately for both SH1 and SH16
- Hobson St – On-Ramps, separately for both SH1 and SH16
- Symonds St – On and Off ramps
- Wellesley St – On and Off ramps, separately for both SH1 and SH16
- Stanley St – for traffic between Alten Rd and Grafton Rd, excluding those using the ramps to Grafton Rd
- Khyber Pass – On and Off ramps
- Newton Rd – On and Off ramps
Flat traffic
First up, let’s look at the totals of all of the on and off ramps combined. What you can see is, particularly over the last decade, surprisingly little change. Volumes in 2016 are slightly lower than they were in 2001. That’s notable because the city has changed tremendously over the last 10-15 years. Since 2001 the number of jobs in the city centre has increased by close to 40% (almost 30,000) to around 110,000, more in the wider area served by some of those ramps. Education has almost certainly become a larger contributor to the city and of course there are many more people coming to the city for retail and entertainment. Of course, there are also many more people living in the city.
One aspect I’m not clear on is why the on-ramps have consistently more traffic than the off-ramps. Is it that people are driving to the city on local roads then driving home via the motorways?
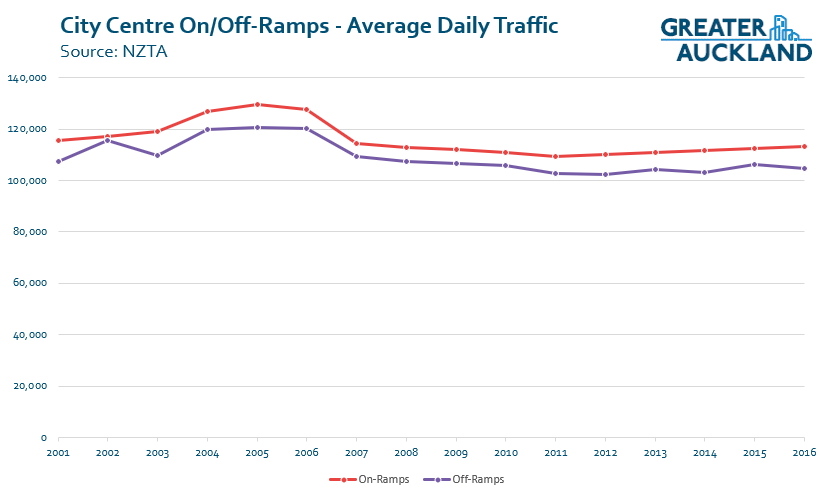
Notably the view that traffic remains largely the same, or slightly down is also seen in other statistics, such as AM peak trips to the city. The one transport thing we do know has changed considerably over that time is the number of people using public transport (walking and cycling are also increasing).
SH16-SH1 changes
While the overall volumes have been relatively flat, there has been considerable change at an individual ramp level. One of the most noticeable of these is the significant changes to the Wellington St and Hobson St (to SH16) on-ramps and also to the Cook St and Nelson St off-ramps. This occurred in 2007 when the direct motorway to motorway connections were made, saving drivers from having to pass through the southwest of the city centre which is also responsible for the overall dip in the graph above. To highlight this, the graph below looks at the volumes for just the Wellington St and Hobson St to SH16 on-ramps. The same pattern exists for the corresponding off-ramps.
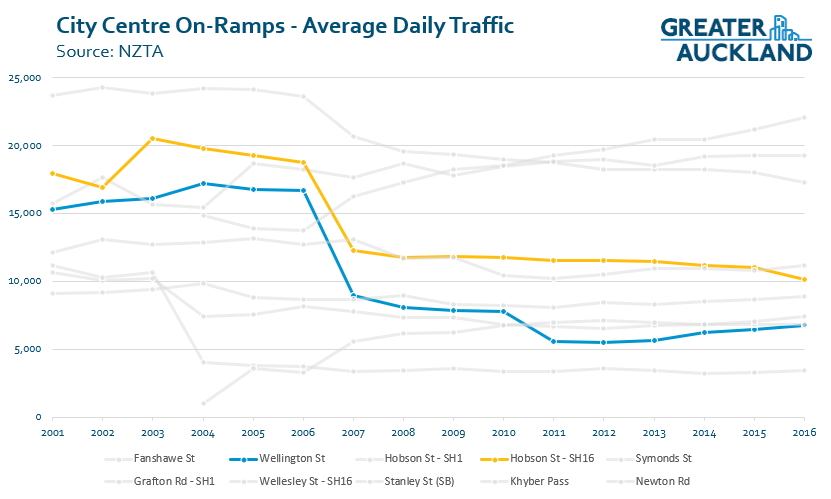
Overall it represents 10-15 thousand fewer trips passing through the southwest of the city centre. That’s an area currently undergoing significant redevelopment to apartments and so we need to be looking at how we can take advantage of that freed up road capacity
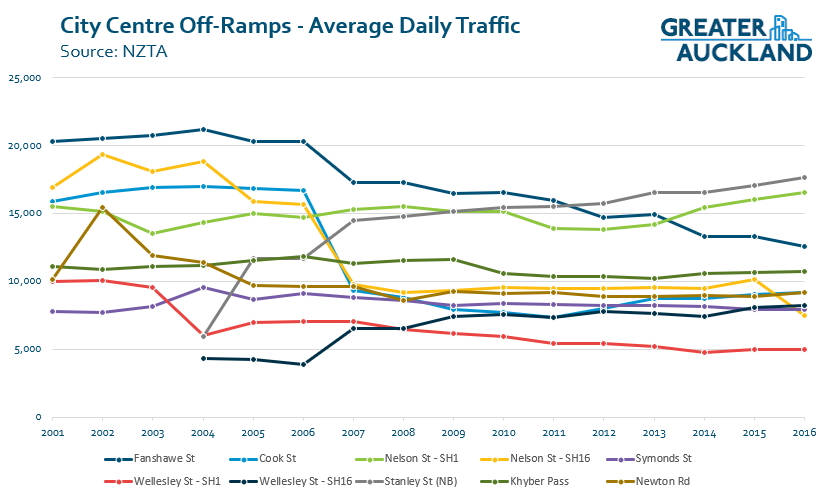
Fanshawe St
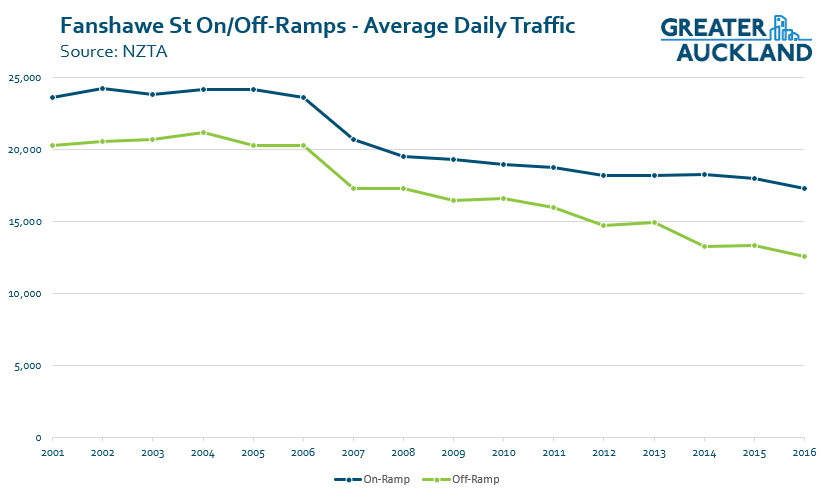
Another trend I noticed was the decline in traffic on the Fanshawe St ramps. Some of this will have been due to the motorway works mentioned above providing access from the North Shore to Grafton Gully, spreading some of that traffic out. However, those links have been in place for over a decade and you can see, volumes have continued to decline over time.
One aspect that has changed on Fanshawe St over this time frame has been the introduction and continued growth of the Northern Busway and other bus services from the shore. I wonder how much of a role that’s played in in these changes.
On-Ramps
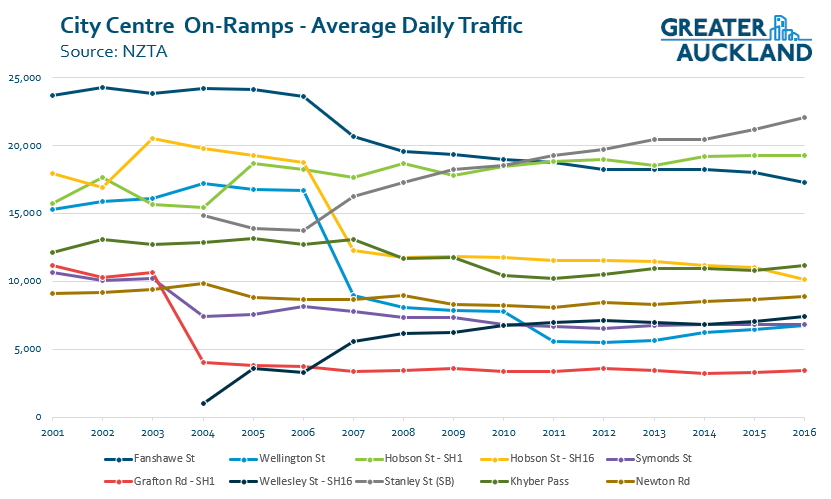
The graph below shows the results for all of the motorway on-ramps. As well as the changes mentioned above, the other two most significant changes have been in Grafton Gully with both Stanley St and Wellesley St growing over time since those connections were built in the early 2000s.
Off-Ramps
The overall trend looks very similar to the on-ramps graph. A couple of other changes include the growth of traffic on Nelson St from SH1 but that seems to have offset traffic from SH16 – although I wonder if the 2016 number is the result of a data error given its sharp drop.
What do you make of the numbers?

 Processing...
Random thought as to why onramps are consistently less than offramps – traffic loops (I assume that’s where your data is from). Offramp loops are positioned at the limit lines of the offramp meaning vehicles are pretty consistent travelling over them – meaning more accurate registering. Onramps are 2/3 down the ramp – sometimes more – meaning lateral position of vehicles is more variable and more likely to not register over the loop. It’s accepted that loops consistently under-report vehicle numbers but I’m unsure if any research has been done into if certain ramp types or loop locations are better or worse than others. Also unsure if this anomaly would be enough to generate the differential shown in your data.
It’s actually the onramp volumes that are higher. Wouldn’t that imply people going home via the motorway, but arriving in the CBD by local? That does seem odd. I could try some esoteric explanation, like that people who go out of town almost never would come back straight to work, but they often leave town straight from work so if someone lives close enough to take local roads, they’d come in on locals and leave via the motorway, but I’d doubt that could be enough to make such a noticeable difference.
If it were the other way around, I’d attribute it to people making secondary trips after work to nearby neighbourhoods.
Maybe something to do with commercial vehicles like couriers and other delivery vehicles? local roads for deliveries then return to base or warehouse via motorway?
Maybe people are more relaxed in the morning and take the “scenic” route, but just want to GTFO in the afternoon, heh. Seriously though, it could be because everything is less congested in the morning, so people take the “stroll” down the local road, but those are all congested with local errand traffic in the afternoon so it’s just better to be in traffic on the motorway than hitting every light on the local.
It’s probably a sum of many discrete reasons. Additional possibilities that probably wouldn’t make a difference on their own, but could add up.
– Delivery routing
– People who work in the field driving to work from nearby, then hopping on the motorway to go to far flung sales calls/field visits, etc.
– Disparities of ease of access between off/on both in the CBD and in nearby neighbourhoods (i.e. it may just be easier to get to/from the motorway in the outbound direction)
– Construction and closure schedules favour outbound motorway usage over inbound
– Dropping off or picking up kids at school (one parent drops them off while the other picks up, which makes a difference on routing)
– Simple caprice
Dale, thats probably true. Limitations of sensors. Also they can’t the difference between a long vehicle and several cars following each other closely. The onramps are always blocked up at peak times which could lead to under counting.
As for Nelson St, what do you expect when you take a lane out to build a cycle way? Less cars fit there, so people find other routes or switch to PT or whatever. What is more likely is that a similar number of cars are there, but the traffic lights are set up to favour SH1 at the cost of SH16. This would lead to more slow moving queues coming off SH16 and thus lead to under-counting which could give a really big under count as seen in the graph. It could just be a data error though, because that is a big drop.
Well i just noticed on-ramps are higher, so my theory is reversed. Coming off the motorway the vehicles must be more closely packed than getting onto the motorway.
So the cycleway, you’re talking about the drop from 2015 to 2016? Why would westies find it unbearable to come off the motorway and be next to a cycleway, and so find a different route, yet SH1 drivers carry on with no change?
I don’t think anyone cares about being next to a cycleway. But it is clear that Nelson St traffic flow has been severely effected by the loss of lanes and turning restrictions due to the cycleway.
As for the difference between SH1 and SH16, westies have more viable options for going via city streets part or all of the way and have typically shorter trips so a few minutes saved is a higher proportion of travel. SH1 offramp also has the slip lane heading towards Freemans bay which hasn’t been affected by lost lanes.
If you’re coming from the West you can get off in Newton if Nelson St is so bad. If you are coming from the South you can get off at Symonds (or Grafton).
I’m interested in the comments here that nelson st is clearly worse for motorised traffic since the cycleway has gone in. I haven’t noticed it getting any more backed up than it did. Was that much traffic really turning left into cook st?
“But it is clear that Nelson St traffic flow has been severely effected by the loss of lanes and turning restrictions due to the cycleway.”
No, it isn’t.
Especially given that the CRL and the Convention centre both started in the same year
Is this data 7 or 5 day average?
It is a really interesting anomaly. The loss of the lane has reduced capacity (for only a certain part of the day). This just limits how many cars you can get through at any one time, but I would think that would just time-shift when people drive into the city. It shouldn’t affect the total daily volume unless people.
Perhaps there is no noticeable increase in congestion because people are choosing to take other routes. But I guess we can wait for the 2017 data to see if it was just a data error due to the limitations of the sensor. I would have thought that the opening of Waterview would have increased the number of cars coming off SH16.
I think some of the difference when comparing on/off ramps at the same location is that people aren’t always going to enter and leave the city at the same place. For example there is close to an extra 5,000 vehicles leaving the city via Fanshawe than arrive there. A large number of people coming from the shore must enter at cook St, shelly beach rd, etc. but leave via Fanshawe
Would be great to add Shelley Beach and Curran up onto those graphs Matt, they’re close enough to the city centre/Ponsonby area.
Nigel; you would be right because try entering the motorway at Wellington St at night, its a horror. That is one on ramp that should close or at least cease operation at peak.
Curran Street is similarly slow and choked as well at night.
Id suggest adding Shelley Beach and Curran then see if there is still the discrepancy. You might have some sort of downhilling going on, i.e. inbound people exit to Shelly Beach to get to Ponsonby, Freemans Bay and the west side of the CBD, but outbound they tend to depart via Wellington Street and Fanshawe to head back over the bridge.
That’s my theory anyway.
https://mobileroad.org/desktop.html
I thought the same thing, but people use the onramp at Curran Street than the off-ramp at Shelly Beach Road!
Lol, there goes that theory.
Yes that would be interesting to see. Also I think same effect somewhat at St Marks Rd & Gillies ave? Off at Khyber Pass and on at Gillies ave or st marks. need to include them also.
I’ve checked Curran and Shelly Beach, same trend, more on Curran on-ramp than on Shelly Beach off-ramp
Do you have peak hours inbound and outbound stats? This would make the stats way more useful as would look at peak flows only. For example when I work over the bridge I use Curran St onramp in morning and return via NW to exit at St Lukes or GNR (unless Google tells me NW is too jammed). So show on stats but city os not destination. I also think the difference is on ramps are flow controlled / throttled via lights whereas if you are already on the motorway it still moves albeit at slow speed sometimes so people plan accordingly.
No the NZTA don’t put those in the public dataset. Someone could probably OIA them though, I’ve had some detailed harbour bridge info before.
https://www.greaterauckland.org.nz/2015/05/19/breaking-down-harbour-bridge-volumes/
Thanks.
You can most likely attribute the off ramp stats from the North Shore to vastly improved PT which is down to the coordination of AT, despite its many shortcomings along with notably cheaper fares when using the HOP card has made PT more competitive too.
Morning peak traffic flows on SH16 city bound past Te Atatu are consistently one of the worst and this is down to the slow exits into the city and SH1 both south and north bound. Hence I believe people take suburban roads to avoid the shambles there. And the morning peak is a lot more concentrated with similar start times around 8.00 am but the evening finish time, not so much.
Nelson St has changed I believe owing to the SH16 link to SH1 northbound. I recall when that was first done it was still quicker to use Nelson St about half the time as the merge with SH1 was so slow. But then the Vic Park tunnel opened and for a while, before the Wellington St on ramp opened, it was very efficient. However since that has opened and the ramp light use its gone backwards again. In the peaks it is particularly slow both morning and evening and it is arguably quicker to use Nelson St.
Having said that Nelson Street has lost lane capacity to bike lanes and of course Auckland’s abysmally coordinated traffic light system simply causes that to bind up completely at peak.
And I think on ramp lights in general has pushed people to take alternate routes as queues at nearly all of Auckland’s on ramps are terrible at night.
And having experienced the US and the way they manage traffic flows in urban environments, there is actually a huge amount that can be done here and quite inexpensively to keep everything moving both vehicles and pedestrians but it will take a culture change with drivers, pedestrians and the authorities in the way intersections are managed.
Part of the difference in ramps may be explained by Market Road only having off ramps. Travelling from the south to New market, some people may exit the motorway at Market Road and re-enter at Khyber Pass. Additionally, people travelling to the city from the Remuera area may travel into the city via Remuera Road or Tamaki Drive and outbound via the motorway and Market Road.
Or is it because more people arrive in rush hour (taking local roads to avoid congestion) but leave outside rush hour (taking the uncongested motorway).
Great post.
Would be great to add key dates to the graphs:
– CMJ
– VPT
– North shore busway
– Newmarket viaduct extra lanes
– introduction of on-ramp lights
– reduction in lanes on Nelson St
– SH16 construction for Waterview
– Google maps with live traffic
Would also be good to have the graphs with data filtered for morning peak (off ramps) and evening peak (off ramps) as this will give a clearer idea on peak usage. An alternative could be a trend of max vehicles per hour for each on & off ramp.
I think a lot of these have various flow on effects to different on and off ramps and of course change people’s behaviour over time.
Some are obvious like CMJ.
Others are a mix of psychology and available alternative routes relative to travel time. e.g. those from the south have likely travelled for longer so will just stick to the motorway whereas those from the west are more likely to take alternatives as it is a shorter journey and there are more alternatives.
Nelson St is simply due to reducing lanes from the start of construction of the cycleway. I have noticed a lot more people go SH16 to port now with regular traffic jams in Grafton Gully.
The difference between on and off can also be put down to a generalisation that people typically start the work day at the same time each day and follow a routine (home to work) but finish at varying times and locations (work to home, shops, etc) and can time the entry to the motorways (along with more info available re live traffic etc)
Also on-ramp lights have a huge effect of sending people via streets rather than motorway. Great for NZTA but not good for AT (and those of use who use those streets). An example is a friend in Glen Eden who finds it much quicker to go via Gt North Road / Pt Chev / Meola / Westmere / Hern Bay to get on bridge at Curren St rather than get on at GNR and go by motorway.
Agree with all this.
I would have thought that the Waterview Tunnel opening may have added some additional flow on and of SH16 at Nelson and Hobson. Doesn’t seem to be reflected in the numbers. Wasn’t Waterview supposed to be the ‘new’ way south to the airport and vice versa?
These ramp numbers stop at (end of?) 2016, so won’t include Waterview which opened mid 2017.
And will at best show a half-year impact in any 2017 figures Matt may include, as a result.
You’ll have to check back this time next year for the full story on that one…
Will certainly be interesting to see the effects of Waterview on the stats – particularly the increase in Nelson St & Grafton Gully exits and SH16 to SH1 north and maybe decrease in Gillies on ramp (people from airport via old suggested route). City to airport traffic was more spread but should be small reduction in Gillies off ramp.
quite possibly the reducing Fanshawe St counts are accounted for in the growing Grafton Gully ramp counts
Yes, anyone east of Queen St would probably prefer not to to cross the CRL works at Albert or Victoria, so get on at Port instead.
Is there an optimum number for on ramp / off ramp usage? A number by which they best contribute to the motorway network? So that we might cut the non performers as such?
The optimum for the motorway network would be zero!
A sewer without any connections is pretty useless.
I live in Westmere and always come home from the city using the Western motorway. I would usually head to the city by Collage Hill and stop off in Ponsonby if I need to. Couldn’t see why more people wouldn’t do this.