AUT’s Briefing Papers initiative has kindly allowed us to syndicate their recent series on housing. The second briefing paper is written by Motu Institute economist Arthur Grimes:
Housing affordability is a multi-faceted, complex issue. Concentration on just one aspect of the issue – be it housing supply, land supply, interest rates, construction costs or migration – will miss important aspects of why house prices vary in different locations at different times. In this briefing paper, we illustrate how differing facets of the housing market combine to produce diverse housing outcomes.
Common sense and observation of recent trends indicates that house prices reflect variables such as: population and migration, land availability (which is affected by both geographical and planning constraints), construction costs and financial factors (credit availability and interest rates). Government-funded rent and mortgage subsidies will also affect how much people can afford for housing and so will affect prices. These factors are included here in a simple framework, providing a systematic approach to understand house price outcomes. The approach is based on, and extends, published papers by the author[1] as well as other influential papers on housing markets.
Four important relationships
The framework draws on four simple relationships that are at the core of determining housing market outcomes. These four key relationships combine to give outcomes (at the city level) for: house prices, population, land prices, and the housing stock (i.e. the number of dwellings in the city). These outcomes are driven by developments in other factors such as finance costs, construction costs and natural and civic amenities.
The first key relationship is for house prices. Theoretical and empirical work shows that house prices are determined primarily by the ratio of population to the housing stock and by finance costs. As the population rises relative to the available housing stock, house prices increase since people have to bid more to purchase (or rent) a dwelling. As interest rates (and other costs of servicing a mortgage) decline, people can afford to increase their expenditure on housing, so house prices rise. Another (often overlooked) feature of financing costs may also be very relevant for house prices. The greater are government-funded subsidies such as accommodation supplement, the greater is the amount that most renters and lower-income house buyers can afford to spend on housing, so rents and house prices will increase in price.
The second key relationship is for regional population. People are attracted to regions that have high wages, attractive natural amenities and attractive civic amenities. Their choice of location is also affected by the cost of housing (both rental and owner-occupied). If population is very responsive to housing costs then extra supply of dwellings may have little effect in dampening house prices since demand (through internal and external migration) will increase to fill the extra dwellings at near existing prices.
The third key relationship to consider is the responsiveness of new housing supply to changes in prices and costs. Over time, the supply of houses increases (or stagnates) until such time as the market price of houses equates to the sum of all costs of producing a new house. These costs include the price of land associated with the dwelling (i.e. the “lot price”), construction and other costs (including regulatory costs),[2] plus a normal rate of return on capital. The sum of these costs ultimately equals the house price, with changes in the lot price being the most important factor in equating house prices to costs.
This brings us to the fourth key relationship, which is for lot prices. For a given city, the average lot price rises as the local population rises. As the population increases, the price of existing land close to the city centre (or to town centres) becomes more sought after so increases in price. While the lot price on the urban fringe may stay low – though this will be determined crucially by the strength of planning and geographic constraints – the increased price of land in existing parts of the city will increase the average lot price of the city.
The four relationships described above all relate to long term outcomes. While short term outcomes may diverge temporarily from the long term relationships (e.g. due to “fads” or to short term migration swings), an understanding of these four relationships enables us to trace through how economic shocks (e.g. a change in global interest rates) or policy shifts (e.g. a change in costs levied on developers) eventually affect house prices, land prices, population and the housing stock.
Examples
We demonstrate the inter-relationships within the housing market by adopting a systems approach that incorporates all four long term relationships just described. We can use this system to evaluate the effects of various developments on housing outcomes. We base our model on published estimates of the effects of the various factors on New Zealand housing market outcomes.[3] Informed by recent Auckland experience, we allow the lot price to form half of the total house price (e.g. a $700,000 house comprises land worth $350,000 and a building worth $350,000). We do not have strong evidence on the effects of population increase on land prices, but assume initially that a 1% rise in population results in a 1% rise in average land values; we also assume that a 1% rise in house prices results in a 0.2% decline in population as people migrate out of the city.
These parameters give us a baseline estimate of responsiveness of the housing market to specific developments. The development that we will concentrate on here is an increase in the number of people wishing to move to Auckland. The assumed increase in population is equal to 10% of Auckland’s existing population holding all other factors constant (we term this a “population shock”). In fact, all other factors will not be constant and the adjustments to these other factors (such as house prices) will affect the final number of people who end up moving to the city.
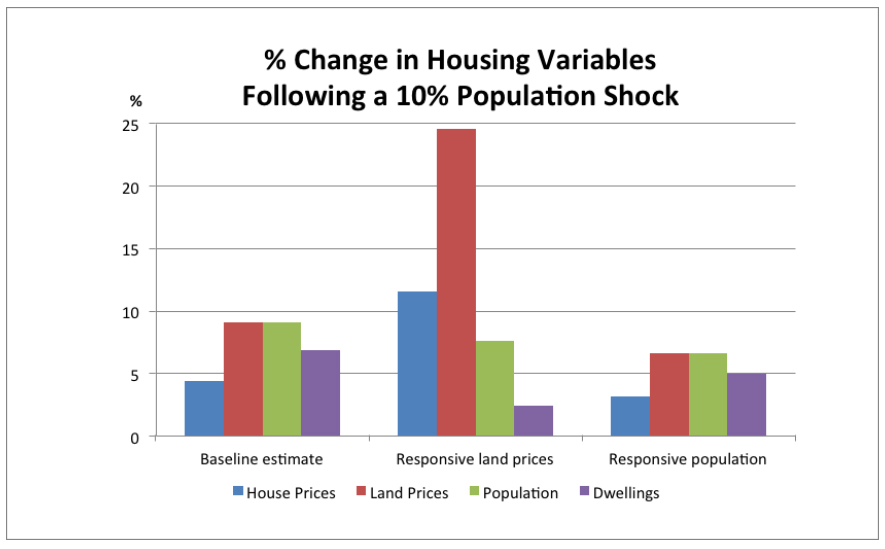
The first group of bars in the accompanying figure show the baseline estimate of the impact of a 10% flow of people to Auckland on house prices, land prices, actual population and the number of dwellings. Land prices rise (by an estimated 9.1%) in response to the influx of people and this land price rise pushes up house prices by 4.4%. The rise in house prices has two effects. It leads to greater house-building, though this is constrained somewhat by the higher land prices, so the number of dwellings increases by only 6.9%. Higher house prices also deter some people from moving to Auckland, so the population rises by around 9% rather than the full 10% of people initially wanting to move to Auckland. There are now more people per house than previously since the population rises faster than does the housing stock (i.e. crowding increases).
The second group of bars simulates the same population shock but now we assume that land prices are very responsive to the extra population[4] (e.g. because planning laws are very restrictive in allowing extra land for housing). Now we find that land prices skyrocket by almost 25% in response to the same population pressures. This leads to an 11.6% rise in house prices. These house price rises curtail the population inflow, so that population increases by only 7.6% (rather than the 9.1% in the baseline simulation). The skyrocketing land price restricts new housing development so that the stock of dwellings now increases by only 2.4% and household crowding becomes much more severe than before.
Thirdly, we assume the same responsiveness of land prices to population as in the baseline simulation, but now change the responsiveness of population to house prices. We now assume that every 1% rise in house prices reduces population by 1% (rather than by just 0.2% in the previous two simulations). This yields the third set of bars in the figure, again in response to the initial 10% population shock. The rise in land and house prices following the initial population pressures now deters people from settling in Auckland so that the population increase is just 6.6%. The reduced population inflow means that there is less pressure on house prices which now increase by just over 3%. Crowding pressures are no longer as severe as in the other cases as the housing stock increases by 5%, just short of the population increase.
What do we learn from these examples?
These simulations tell us that each aspect of the housing market interacts with each other aspect as a system. One cannot look just at housing supply, or housing demand or immigration to judge its impact on housing outcomes. All these aspects must be considered together. The same shock (e.g. a sudden rise in the number of people wishing to settle in Auckland) can have very different housing outcomes depending on the responsiveness of some factors to others.
Two facets of responsiveness that we have concentrated on here are: (i) the response of population to house prices, and (ii) the response of land prices to population. If population is very responsive to house prices, then house and land price movements will be more muted than when the responsiveness is low. This factor essentially reflects one aspect of the demand for housing.
The second factor relates to the supply of housing. If land prices are very responsive to population size, then house and land prices will react strongly to an influx of population. That the same shock can lead to either a 6% rise or a 25% rise in land prices depending on just these two factors shows the importance of considering all responses in determining what happens to housing outcomes following economic shocks.
We may have little power to affect how people’s location choice responds to house prices, but we do have some ability to affect how responsive land prices are to population pressures. Planning laws that constrain the amount of greenfields land available for new housing or that limit the ability to intensify in existing areas (i.e. the ability to use less land per dwelling) increase the responsiveness of land prices to population inflows. The increased rise in land prices then induces a larger rise in house prices for the same population shock.
Thus while many demand and supply factors interact with each other to affect house prices, we are able to moderate their final impacts through policy choices. It then becomes a political economy question as to whether or not we wish to implement policies to counteract a situation whereby house prices have become so high as to price many ordinary New Zealanders (and almost all poorer New Zealanders) out of buying a house in Auckland. Our work shows that we do not need to accept this situation.
One avenue to help address it is to increase the availability of land (both through enabling intensification and opening up greenfields land) so as to bring land prices and house prices back down to more affordable levels. Even then, however, we have to consider how all the factors appearing in our four relationships interact with each other to understand the overall effects of such a policy change on the outcomes of policy interest. If population flows are rather unresponsive to house prices, freeing up the land supply should bring down house prices and have little effect on population levels. By contrast, if population flows are very responsive to house prices, then freeing up land supply will be reflected principally in an influx of population with only a secondary effect on land and house prices. The responsiveness of population is an empirical issue, but one that may be affected by some policy settings such as migration policy and housing assistance policies. For instance, if housing assistance does not rise with an increase in housing costs, then a house price or rent rise may deter significant numbers of people from living in Auckland. Again, it is a political economy issue as to how the populace and policy-makers wish to treat these various outcomes.
[1] Arthur Grimes & Andrew Aitken (2010) “Housing Supply, Land Costs and Price Adjustment”, Real Estate Economics, 38(2), 325-353; and Arthur Grimes & Sean Hyland (2015) “Housing Markets and the Global Financial Crisis: The Complex Dynamics of a Credit Shock”, Contemporary Economic Policy, 33(2), 315-333.[2] An analysis of regulatory costs in relation to Auckland housing is reported in: Arthur Grimes & Ian Mitchell (2015) “Impacts of Planning Rules, Regulations, Uncertainty and Delay on Residential Property Development,” Motu Working Paper 15-02, www.motu.org.nz.
[3] For instance, based on Grimes and Hyland, op. cit., we assume that house prices rise by 2.2% if the population rises by 1% relative to the housing stock in a city.
[4] Specifically we now assume that a 1% rise in population induces a 3% rise in land prices.

 Processing...
I think Arthur’s work is fine as an analytical piece, but I have to say that the title is slightly disingenuous. The model does nothing to explain _affordability_ per se, although it does explain pricing mechanisms well. If it were to address affordability it would have to discuss the relationship between incomes, finance and prices. As it is the paper jumps straight to land supply and avoids talking about finance in anything other than mechanical terms, let alone flagging the issue of income as an attribute of local population.
I don’t think “housing affordability” can be understood without first examining why it is important. What are we really trying to achieve when we (ie society at large) say housing should be affordable…?
Having read a fair few economics papers (although not necessarily a representative sample!) on housing markets, I’d observe that there are two different perspectives taken on the matter.
The first perspective is to look at the long-run determinants of house prices. This basically involves identifying the shape of long-run supply and demand curves for housing, and examining what happens when you move them around. Arthur’s paper uses these techniques to make a useful observation, which is that an inflexible supply situation will lead to a structural increase in house prices in response to rising demand. However, getting this insight means abstracting from short-term fluctuations in interest rates, finance availability, bubbles, etc, which may have a big impact in the here and now.
The second perspective is to treat housing as a financial asset and identify the factors, including financial market trends, that cause its price to fluctuate up or down. This gives a different set of insights – e.g. around whether housing is over-valued relative to fundamentals. The third Briefing Paper takes this approach to look at whether the Auckland market is a bubble. (Preview: probably.)
(Of course, if you see housing as an asset, as many people do, “affordability” is not necessarily the be-all-end-all. People just don’t say “My house price went down; thank goodness it’s more affordable.” They say “My house price went down; now I have to declare bankruptcy!”)
Lastly, I’d observe that both perspectives are inherently partial. In practice, house prices are always “groping towards equilibrium” – i.e. moving towards some long-term trend but also being perturbed in various directions by fluctuations in interest rates, migration, supply, etc.
So nothing about how Auckland prices are being driven up by foreign based property speculators/money launderers.
When estimates by many in position to give such estimates say that they think around 10% (conservatively) of housing for sale is being sold to foreign based buyers then you see where the problem is (around 10% of houses are sold in Auckland each year). So 10% of 10% is 1%. 1% over a decade = 10% of the total Auckland housing stock. That is around 50,000 houses! So if they weren’t allowed to own these houses then that would not only cover the current shortage (of around 25,000 houses), it would also cover 2 years worth of demand (13,000pa) coupled with the 8000 pa being built you suddenly would have an excess of houses over the short term and be back to a sustainable number long term. I would estimate this could knock 10% off house prices right away (as well as preventing rampant future rises as less buyers in the market).
Remember these numbers are conservative…some think that it is more like 20% of total Auckland stock is off-shore owned (with at least half of that coming from China).
In spite of the hypothesised tsunami of Chinese cash, the share of Auckland homes that were vacant on Census day has fallen, not risen, over the last decade. See John P’s excellent post on the topic here: http://greaterakl.wpengine.com/2015/05/28/are-vacant-homes-adding-to-aucklands-housing-shortage/
In other words, there does not seem to be any evidence that a large or growing share of Auckland’s housing stock is sitting idle due to foreign buyers. So even if we confiscated everything owned by foreign investors (which I do not recommend, by the way), it would have little impact on the number of homes available for Aucklanders to live in.
Yes because a single friend/family member of an overseas investor is a good use for a 5 bedroom home….
so that’s your reply to research and evidence?
I’ll have to check in with the other judges, but I think you just lost that round by KO.
It would be interesting to have the 2015 stats (census was 2013) as according to real estate agents I talk to the central city empty housing has boomed in the last two years. The usual reason investor houses are left empty is that with capital gains of $150k plus a year, why would they bother with tenants and the associated issues for $25k to $30k a year. I personally know investors who have bought properties (mill plus range) who simply cut off the services (power, water, phone) and lock them up, with their only outgoings being insurance, rates and lawn mowing. The intention is to get a good CG return over 3 to 5 years and then sell them. How long this can continue in Auckland is anyone’s guess.
The relationship of lot price increase and speculative demand, would seem the relevant question. Not addressed here directly.
DIDN’T READ LOL!!!
It is a macro economic analysis. There are some variables that affect the micoeconomic. Such as school zone, infrastructure, area demographics (rich people like to live with rich people)
Also the reponsiveness of land price is a exponential relationship. On a booming market, land is a speculative capital growth investment. The price will raise a lot faster than what its actual worth. And on a decling market, it will slowly correct itself in value, or rapid crash if people are defaulted.
It is very complex than a simple analysis.