Auckland Transport are (rightfully) celebrating the rise in ridership that has come as a result of the new network. As I highlighted the other day, boardings are now at just under 98 million trips per year, that’s up by over 29 million or 42% in less than six years.
A complete re-working of Auckland’s public transport network has delivered more services and strong growth in passenger numbers.
Auckland Transport’s New Network saw an 11 per cent increase in trips in February. There were close to 98 million trips for the year, the highest number of passenger trips since the 1950s.
Mayor Phil Goff welcomes the surge in public transport services and patronage. “The number of people now using public transport has reached record levels, not seen since the days when trams ruled Auckland’s streets. While the distance travelled by Auckland buses has increased 32 per cent each year, running costs have been held to just seven per cent. Aucklanders are getting both better services and value for money. And every person using public transport is one less car congesting our roads.”
Notably, around half of all the growth has occurred on the Rapid Transit Network

One area I agree has gone well has been that by implementing the network over a period of time, AT did manage to roll out network with only relatively minor issues.
The mayor says the process of change region by region was sensible and worked well. “This avoided the issues which occurred in other places such as Wellington. Despite the complexities involved, the implementation of the changes has gone smoothly.”
While there are definitely some good things happening and ridership is rising, there are a few things that bug me about AT’s press release. The biggest of these is the claim
“On 30 main bus and rail routes we introduced a minimum 15 minute frequency, 7am to 7pm, seven days a week.”
If only this were the case. Rail frequencies remain at best every 20 minutes off peak and on weekends, often running less frequently than the local buses even though the rail network is considered the backbone of the new network. What’s more, based on the Regional Public Transport Plan, this situation is unlikely to change before the City Rail Link is completed in 2024.
But while the increases have been positive. I do worry that AT aren’t challenging themselves enough. This is highlighted in some comments made by Chair Lester Levy yesterday on the topic. Stuff reports:
Aucklanders might be on the way to doubling their public transport use to 120 million rides a year within a decade, a goal once deemed “unbelievably outrageous”.
Auckland Transport chairman Lester Levy said the challenge seemed undoable when it was put to him by then-Mayor Len Brown in 2012.
“No other city had done that, Vancouver came close,” Levy told AT’s board.
The key problem with this is the target was actually 140 million trips. The number came from the original Auckland Plan in 2012 (now only on the wayback machine)
![]()
This was further backed up in the detail saying:
![]()
An important caveat to the information above is the greater allocation of funding. Certainly at the moment one of the big issues that AT have had, even under the a much more PT supporting government, is getting enough funding. While it’s good we’re seeing immediate growth as a result of the new network changes, the real impact of this and other PT improvements over the last 5 or so years takes time to flow through and for ridership to build as a result.
You can see from the graph below that 140 million trips wasn’t an unrealistic of a target at the time.

On a per capita basis it would see Auckland’s level rise from about 57 now to around 66, bringing Auckland close to Wellington’s current level and based on our current trajectory, should surpass the target of 100 trips per capita before 2040.

Given the funding challenges that still exist, perhaps 120 million is a more appropriate target, and one that still represents a significant improvement in performance but it’s a but disingenuous for them now decide that.
One thing I will note, the target in the draft versions of the Auckland Plan was initially 121 million trips but that was increased in the final versions.

 Processing...
Jesus Matt give them a break.
I can see where Matt is coming from. While AT definitely deserve credit for patronage heading in the right direction, the press release is misleading. And I think AT need to be called on it.
For example, AT claim to have delivered 15-min frequencies 7am to 7pm, 7 days per week on “main bus and rail routes.”
The problem is, as Matt notes, none of our rail lines currently offer this level of service even on weekedays. Basically the press release is flat out patently wrong, and your average PT Joe will know it is so.
My take, for what it’s worth, is that AT should be proud of what they have achieved in delivering the New Network, among other things, which is a genuine achievement, without over-selling. The latter is unnecessary and to some degree understates how much work we still have to do. As Matt notes.
“I do worry that AT aren’t challenging themselves enough. ”
Yes. The NN has been a good step up, but a whole lot more bus priority and frequency is required.
But the other place they’re not challenging themselves is in the quality of the service. I think the drivers must be being underpaid and treated terribly. As a passenger, while I see some wonderful, friendly, safe drivers who make sure people get the assistance they need, I’m also seeing a lot now who are running red lights, driving too fast, showing no empathy and being arrogant.
On Monday, a driver couldn’t hear the passenger waiting at the stop knocking on the door – in two rallies of knocking, because he was there for quite a while, oblivious – and couldn’t hear me asking him to open the door for her. So he reacted very badly when I got up and growled at him, telling me to sit down, he was the driver.
Turned out he was wearing ear buds to listen to music. So I’m laying a formal complaint this time. It could’ve been someone with their dress or backpack stuck in the door.
Heidi, I am in awe that you get a bus that makes it to the speed limit let alone exceeds it. Should try the Pavlovich buses out west, 25 to 35 screaming max with frequent dabs on the brakes in a 50 zone and 70ish on the motorway is the norm.
“Going too fast” means too fast for the conditions; sometimes it’s over the speed limit, sometimes it’s not. The speed limits aren’t aligned with what’s safe.
The most egregious example of too fast recently was on Fanshawe St, where a bus driver drove at what must’ve been the fastest speed it could negotiate the turn into Halsey St – on a red right turn arrow.
And a bus driver on Jervois Rd went through “completely red” lights in a row a week before that…
through *two* completely red lights in a row…
it seems to me that a lull in PT patronage over 2012-14 set that plan target back, and that otherwise the growth rate has actually been quite god and meeting or close tot he target.
Does anyone know what this lull was? Was it the introduction of the EMU’s or roadworks or something?
Rugby World Cup 2011 is part of it. Games were in September & October with moving 12 month totals spreading RWC impact over 13 months in the patronage graph.
That dip was mostly due to AT resting on its laurels post RWC.
[Along with KR frequently shutting down the entire rail network at nights and weekends as they slowly rolled out electrification from 2011 to 2014]
Seems more like a lull than a dip; a stagnation/small decrease.
If rail shutdowns cause a dip in patronage then there should have been a big dip between 2006 and 2010 when the Western line was being duplicated. The shutdowns for this were bigger than they were for electrification.
I’m not sure replacing the 11pm service with a bus is going to have a meaningful impact on patronage.
Also the claim AT rested on their laurels doesn’t really stack up. In 2012 the opened the Manukau branch resulting in more train services and also introduced Hop cards on trains later that year.
While there was a dip on all modes, the biggest part of it was on the rail network and there were three key reasons for this.
At the time, AT were publishing some data to estimate the impact of the RWC. If you take that off the totals, this is what it looks like. Once you consider the other factors, my guess is ridership was perhaps flat or only slightly down.
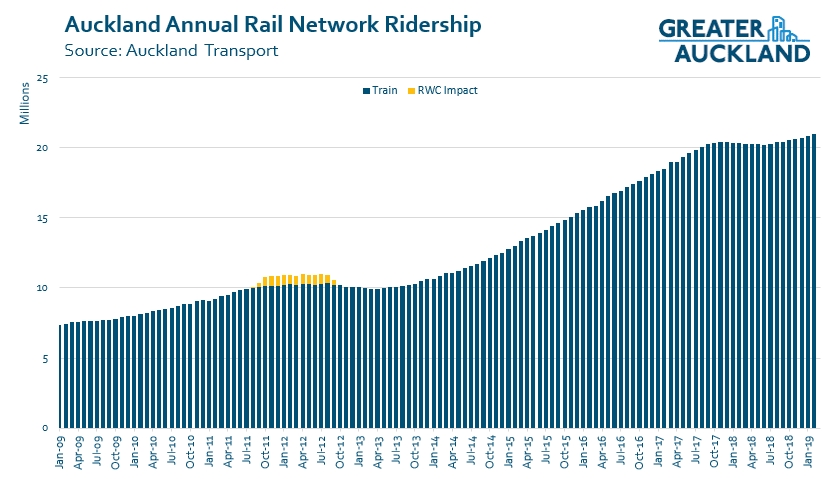
I suppose that without the RWC boost; it’s a stagnation in patronage between mid-2011 and 2014. And the small dip seems to be mostly felt in the buses.
And I think it’s reasonable to attribute the climb in patronage to the “sparks effect” of electric trains and the changes to bus routes.
Yes pretty much. Rail stagnated post RWC and only really started rising again after the EMUs started operating.
On the buses, things were similar but started improving with HOP and the introduction of the double deckers then later the new network.
How about trains every 20 minutes on times like the summer break, 15 minutes on weekends, 10 minutes on weekdays, and AT LEAST every 5 minutes in peak.
If patronage can demand such frequencies.
Otherwise it’s mere inefficiency and un-needed wear & tear on the infrastructure and units.
There are two reasons to increase frequency:
Increased demand requires increased capacity, which can be delivered through increased frequency. Or,
The desire for increased ridership required improved service levels, which can be delivered through increased frequency.
So, yes, it is increased wear and tear, but it isn’t inefficiency, it’s just work towards a goal where you personally don’t accept that the merit of the goal, or don’t accept the effectiveness of the method.
If the trains don’t already have people standing as they enter Britomart; then there’s not enough people who might take the train if it was more frequent.
And furthermore; Money doesn’t grow on trees. Auckland transport have enough money for reintroducing stations between Papakura and Pukekohe. Maybe it would if it wasn’t running an inefficient service? What’s a better long-term goal, patronage level growth even higher than the current respectable level or stations in areas with high potential fro growth?
How do you know how many people aren’t taking trains that don’t run?
“If the trains don’t already have people standing as they enter Britomart; then there’s not enough people who might take the train if it was more frequent.”
It doesn’t work that way.
You can’t catch trains that don’t exist and you’re not going to use a train if it means waiting for ten minutes doing nothing.
Similarly if people catch unfull trains they have a better journey than if they don’t. In other words, even if increased frequency (against all expectation) didn’t attract more people directly, there’ll be an indirect effect from how current passengers talk about their journeys. Getting to work complaining of sardines or standing on the train = unattractive. Getting to work claiming to have got a head start over everyone else = attractive.
Money seems to grow on trees for road improvements.
You’re thinking about it back to front IMHO. You should ask what frequency is needed to generate patronage.
Train trips aren’t fixed and people have a lot of flexibility of how and when they choose to travel. The service frequency -which impacts on wait time (and therefore travel time), the robustness to delays and the ability to readily connect between lines – is a huge factor in patronage generation.
We’ve seen this with a lot of New Network routes, 20 to 30% gains in patronage on routes just by going to frequent service across the day.
Well get offended as you want; what I’ve seen you come out with in debates about the Auckland harbour bridge, promoting the sure-to-fail Hamilton commuter service and the light rail to the airport don’t give me any reason to hold your honest opinion in high credence.
I don’t doubt that there’s been 20-30% increases in off-peak train patronage in Auckland. But I dispute that is due solely to increased service frequencies.
And while I don’t doubt that higher frequencies generates some growth in patronage; I would also assume that if it was to a degree that justified the needed extra expenditure in staff and operating & maintenance costs then networks around the world would be doing it instead of Auckland being the only one I’ve ever heard of that does.
Because the fact is that in democratic nations we have cycles of government. And when the CRG or other right-wingers/fiscal conservatives inevitably get a majority in the Auckland council or the Nat’s win a national election; they can use gross inefficiencies to justify rubbishing passenger rail altogether and introducing crippling cutbacks. Especially in a country that’s not actually that wealthy like New Zealand.
Um, how much research have you done into whether other cities are using frequency as a way to increase PT patronage?
Daniel, I’m not sure if there’s some history here that I don’t know about but you really shouldn’t attack Nic’s credibility like that for two reasons. First, it’s not a decent thing to do and arguably violates GA’s user guidelines. Second, Nic happens to be one of the best PT planners I’ve ever had the pleasure of working with. So your criticism rings hollow to me.
Now, the elasticity of demand with respect to frequency is fairly well-established at around +0.40. Of course, there’s a decent amount of uncertainty around that point estimate with 95% confidence intervals in the order of +0.1 to +0.70. Experience suggests Auckland’s rail network is on the high side of that range, which is rather decent.
I don’t disagree that frequency improvements need to be justified, although in the case of Auckland’s rail inter-peak and weekday improvements are potentially one of the more higher yielding investments you could make. I understand the reasons they aren’t implemented is more due to (1) maintaining sufficient slots for freight and (2) shortage of staff, rather than their effectiveness.
If this “Nick R” or Stu Donovan are any PT planners; it’s very unprofessional for them to be posting on this blog. And it also says a lot if anyone who employs them who is tolerating that.
Furthermore; it also calls the credibility of this blog into question as it reduces it to a mere echo-chamber propaganda blog.
I’ll never get over the rubbish “Nick R” tried on over the AHB clip-on’s where he attempted for claim that these horrendously expensive contingencies for planning failure were some sort of master planning stroke. I don’t know if it was cluelessness on his part or an attempt to be dishonest but it was a big third strike of credibility for me…
Thanks Stuart, but I’m not really concerned whether Daniel thinks I’m credible or not. He’s just someone arguing an unsubstantiated opinion on an internet comments section like it is fact. Dime a dozen.
Daniel, actually it’s entirely professional. My professional accreditation requires me to engage with the community, understand other peoples perspectives, share my knowledge and seek that of others.
Of course I am bound by client and data confidentiality, and never speak about anything that isn’t already public knowledge.
…but I would be very weary of any so called professional that never talks about the key issues of their profession, never seeks to learn from others or share what they have learned.
Daniel,
First, the code of ethics for my profession (engineering) requires that members engage constructively with the general public on technical matters. In the same way that we might expect a doctor to contribute to blogs on the merits of vaccination. You’re up shit creek without a paddle on that issue.
Second, your comment on “echo chamber” and “credibility” suggests you are jumping to conclusions. I’m based in Australia, where I work for a completely different consulting firm from the one who employs Nic. The firms Nic and I work for are, at least in Brisbane and Melbourne, competitors: We actually have a commercial incentive to criticise each other. And even though we did previously work for the same firm, there’s no reason to suggest we’d have the same opinions. Quite often we didn’t!
Third, in terms of the GA, I don’t think it’s reasonable to suggest they assess people’s right to comment based on their employer. Should GA only allow comments from people who don’t work for consulting firms and/or the government? And/or how would that be managed? Seems better to simply assess people’s comments based on their individual merit. Like I am doing with yours, rather than implying your views are biased by your employer.
Finally, you seem to suggest that a previous disagreement with Nic about the relative effectiveness of the harbour bridge clip-ons is good reason to act rudely now. Behaving rudely to people with whom I have technical disagreements is not a behavioural code that I personally subscribe to. In fact, my employer wouldn’t tolerate it. How about yours?
Aside from the very poor decorum with which you have commented above, one of your comments is particularly in need of fact checking.
“And while I don’t doubt that higher frequencies generates some growth in patronage; I would also assume that if it was to a degree that justified the needed extra expenditure in staff and operating & maintenance costs then networks around the world would be doing it instead of Auckland being the only one I’ve ever heard of that does.”
If you haven’t heard about other cities doing this, then it is only because you haven’t been listening. London, and Vancouver in particular are infamous for really high all day frequencies, even with near empty trains, because their goals are to increase ridership.
In the evenings most tube lines ‘only’ have enough patronage to fill about 2-3 trains per hour. TfL run 20 trains per hour on some lines until midnight, all because it increases ridership.
TfL also bought the rail franchise for some suburban lines from private operators a few years ago. They removed branching services to operate high frequency long routes across the suburbs. Ridership is up on all of those lines, and up 700% on one line. This patronage is all due to improved frequency, which could only be achieved by forcing most existing passengers to transfer.
It’s reasonably inefficient owning assets that sit idle most of the day as well.
A bit of spin there perhaps from AT, preferring measuring absolute numbers rather than per capita . I also wonder whether we are comparing apples with apples here given that some people need to take 2 or more bus routes now just to get to the local township from a nearby suburb. Is that the right definition or is that being measured correctly? I know my own usage of buses has plummeted since and because of the implementation of the NN but I am hopefully an outlier.
They’re measuring just journeys too and they’re also showing an increase but obviously not as strong of one as boardings.
In previous communication AT confirmed transferring bus passengers under the new network were “double counted”. I’m concerned this is more of a “Wally Thomas” special than fact.
Is this still the case? If not, which month was it rectified?
Since hop was introduced they’ve always counted linked journeys, and unlinked boardings.
Boardings is still useful to compare to long run data trends, as that is all that was measured back in the day. Journeys is more useful for recent trends.
It just depends which one they put in whatever chart you are looking at.
I suppose Wellington is doing its best to help us match them per capita…
GWRC/transdev/nzbus etc are all doing a fine job of squandering the opportunity to really grow PT usage in the capital, combined with NZTAs motorways & car dependant sprawl rather than intensification, the capital feels like its going backwards fast.
Wellington’s PT patronage looks more stagnant than declining. Changing the bus routes and losing the trolleybuses probably hasn’t helped. Something to complain about but nothing to panic over.
Wellington’s biggest transport problem is that it is soon to have a new arterial regional motorway disgorging more traffic into its very space-limited peninsula.
And the $ billions being pumped into this are $ billions not available for much-needed improvements to the public transport system like extending the regional rail network to serve the missing half of the city.
If AT spent a modicum amount of time and money on getting the painting bus lanes and priority measures rollout back on track instead of being a wannabe NZTA, they’d achieve their 140m easily before 2020.
Making people change buses and counting their trip as two bus rides has lifted the ridership stats so well they should do it all again. The Next New Network (NNN) could force people to change buses twice. The really are on to something here.
Miffy, if that comment was intended as tongue-in-cheek it shouldn’t be. You’ve exposed their game.
They’re trying that same trick in Wellington – and numbers are still falling. Their incompetence in Wellington makes AT look like a stable genius.
“numbers are still falling”
Got a source for that?
Not consistent with data I’ve seen (which shows slight growth after initial slight decline).
Except of course they clearly state when they’re counting journeys and when they’re counting boardings… Captain Cynic will have to try harder to find fault here.
And Guy, how very dare you suggest the hopelessness of GWRC applies in anyway to AKL. They make AT look like geniuses.
I wouldn’t describe GW as hopeless: they’ve improved the bus network from really quite poor to only somewhat poor…
WCC need to take their share of blame too: no meaningful bus priority implemented since 2012 … At least Auckland doesn’t have fractured and fragmented local government like Wellington.
I don’t think that is true Patrick. Greater Auckland is very careful to state what data they are presenting by AT seem less concerned about that. The GA post last week put boardings at 98million (rolling) up 11% Feb to Feb, https://www.greaterauckland.org.nz/2019/03/22/feb-19-ridership/
But AT in their press release use the same numbers and call them trips.
https://at.govt.nz/about-us/news-events/services-and-passenger-trips-surge-on-auckland-s-new-transport-network/
When there is a difference I trust Greater Auckland.
“”15 minute frequency, 7am to 7pm,”” Appreciated; it makes a big difference waiting 14 min insted of 24 as it used to be.
As an occasional passenger with a gold card who also has and uses a car it seems obvious that prices for children should be dropped or at least those travelling with adults. And there are still too many without Hop card which delays everyone including queues of vehicles – give a card to every tourist and charge a standard $5 or $10 to make paying quick.
Prices are still too high – not bad if you have a middle class job (say >$50k pa) but a kick in the teeth if you are poor and commuting from an outer suburb. Hop credits with WFF? Why are prices based on an arbitary 50% of cost – the benefit of PT for all car drivers is so obvious make it 80%.
The Hop card scanning device is too slow and unreliable – it should fast so buses stop for shorter intervals. No reason a bus journey should take much longer than a car journey.
Aucklanders might be on the way to doubling their public transport use to 120 million rides a year within a decade, a goal once deemed “unbelievably outrageous”.
Auckland Transport chairman Lester Levy said the challenge seemed undoable when it was put to him by then-Mayor Len Brown in 2012.
“No other city had done that, Vancouver came close,” Levy told AT’s board.
Maybe no other city came close to doubling PT rides as happened (60mill – 120mill) in Auckland. However, in half that time (2013-2018) Vienna added the same number of trips, 61 million, off a huge base, 900 million.
In the previous ten years they added a staggering 185 million trips. The difference is Vienna is a city that year in, year out has spent very significant amounts on capital expenditure. They also have a great pricing structure for regular users.
It might be a more compact city, but that is because planning ensures that many large developments are around transport links.
If AT is going to address carbon emissions then current targets are sadly way too low.
“Certainly at the moment one of the big issues that AT have had, even under the a much more PT supporting government, is getting enough funding”
This is way too kind on AT. I have reproduced these figures from the last Annual Report:
NEW CAPITAL EXPENDITURE
Roads 274,355(actual) 381,394 217,427(previous year)
Public transport 145,880(actual) 143,333 106,607
Maybe the govt is taking the view that if you don’t help yourself, why should we help you?
Spending was still heavily skewed towards roads, although, to their credit AT spent a whole lot less than what they budgeted. (It always amazes me how something is needed at budget time and yet somehow you manage to live without it.)
I think this is more a reflection of their inability to spend their money (project delays) than any real intent on their part.
The chart shows consistent growth from before the new network was introduced, so how do we know the new network has increased patronage that wouldn’t have increased at the same rate anyway?
What we do know is that implementation was expensive, and that operating costs are now higher than ever.
Has it really made things better, in terms of value for money?
Yes we’re seeing fairly constant growth but the makeup of that is changing. You can see from the first graph that from about 2014-2017, the ‘Other Bus’ (non busway buses) columns were essentially flat and almost all the growth was happening on the rail network and busway. But over the last two years that’s started changing again and most of the growth is on the ‘Other buses’ – although the RTN is still growing. So while the growth looks constant, without the NN it would have flattened off.
As for cost, yes it cost more but we’re getting a lot more service for that due to far more efficient use of buses.
To be fair, didn’t 140m by 2022 assume that the CRL was open? AT could absolutely do more, but they will achieve 140m the year the CRL opens.
What’s the current excise for the God awful train frequency?
Lack of funding for more drivers and higher running kms, and NZTA holding up the 3rd main in biz case purgatory… we know they have the trains because they can do it at peak.
The coming additional trains will enable 100% 6-car sets at peak and serve the Pukekohe run (when that too gets through NZTA death/delay-by-process).
I thought the peak trains were all already 6 car? Certainly so on Western line. I cant see enough 3 car peak trains to justify 15 additional emu sets to fill out all peak services to 6 cars. Ok, some were for the Pukekohe run. So without wires to Puke, at least for several years, and no batteries for this next generation of emus, does this mean a fair proprtion of these new dmus will be parked up/stored somewhere as not needed/redundant for 5 years awaiting the CRL and Puke wires?
Will they be covered in that white plastic shrouding and stored in the unused crl tunnel under Albert St for next 5 years?
No only enough trains for about half of peak to be six car sets. Certainly not on the western line, I can say that from daily use.
We’re 15 units short of being able to run all peak services as 6-car trains, 17 if they also run to Pukekohe.
10 minute peak frequencies on a mainline network with an annual patronage of 19 million, not even that much (by world standards) is “god awful” in your book?
I was talking about the frequency in the 20 hours a day that are not peak hours. Inter-peak, evening and night time frequencies are God awful. I also refuse to accept that low total patronage is a justification for poor frequency. Low total patronage is a *result* of poor frequency.
I think you meant frequency of every 20 minutes.
20 minute off-peak frequencies is very generous given the overall low patronage level of only ~19 million a year.
If lower off-peak frequencies is such a turn-off for off-peak commuters then how is it that Wellington’s trains pull into the terminus with people standing off-peak when operating with only 30 minute frequencies? Part of using public transport is usually an inherent inconvenience of having to plan your trip around the train and/or bus timetable. Unless it’s something like a metro with 2 minute frequencies (which instead have a usual inconvenience of overcrowding). Sure; using a train option might be slightly more attractive if it’s more frequent, especially if it involves an interchange to another PT mode. But for most people; they’ve decided to take the train and will plan their day around the timetable.
The only people standing when trains pull into Wellington off-peak are those that have got up from their seats to get to the door a bit quicker.
Wellington’s network is more peaky than ours and has lower patronage off-peak.
I agree with you that frequency has to somewhat match demand. However, this overlooks one key factor, Auckland’s rail network is the core of a wider PT network and frequency is vital to ensure transfers from buses are as easy as possible.
No people stand on the Wellington trains because they cannot get a seat at Tawa or Petone.
Maybe if there is an event on, but this would be extremely rare otherwise on off-peak services.
It’s pretty common in Wellington even if they are long trains to run them with just two carriages open during off-peak and even then it is very rare to see all the seats full.
You know this from what? Taking an off peak service on one day once upon a time?
I use Wellington trains multiple times a year and mostly off-peak. I also when I am in Wellington for work routinely walk through the station as it is the quickest route between the two offices I work at so often see off-peak trains coming and going.
Given you live overseas, I’m intrigued to know what you are basing your claims on.
“operating with only 30 minute frequencies”
Frequency depends on what lines, days & time of day you’re talking about.
E.g. Weekday inter-peak Hutt & Kapiti lines are every 20 min, while J’ville Line inter-peak is every 30 min (with some services currently cunningly disguised as buses…)
@ Daniel Eyre
Wellington increased its weekday inter-peak frequencies to 20min on the Hutt and Kapiti Lines about a year ago.
20 min frequency is pathetic, and, 20m annual ridership is low internationally by any metric; city size, track length, station numbers… Lots of room to improve.
Phil Goff, a veteran politician so Phil, of course, is going to wax lyrical about the amazing growth in PT use under his watch so we all vote for the status quo. Trouble is it’s off a low growth and its still light years behind Auckland’s traffic problems and hopeless in its response every time.
Can Phil answer Auckland this?
Where is the next tranche of growth going to come from? Given our, PT is bus-based largely a fleet of 35 to 45 seater buses, where the private companies running them can’t get drivers to sign up now, largely owing to poor wages, conditions and Auckland’s very expensive living costs. Most buses are full at peak and the opposite off-peak.
Or this;
If PT use is back to the halcyon days of light rail in the 50’s why was there no traffic gridlock then but its just appalling now and appears worse year on year? You cannot trot that bullshit out and not be found wanting by even the tiniest analysis of it. Tuesday morning, for no particular reason, SH18 backed up to the Greenhithe (Upper Harbour) bridge, SH16 stop start 15 km/hr past Te Atatu city bound, almost stationary past Great North Road, streets around Pt Chev terrible. Yesterday SH1 southbound past Sunset Road, 20 km/hr at 10.30 in the morning.
Or This?
Why is there virtually no worthwhile public transport from West Auckland to North Shore?
Or;
Why is the West Auckland area almost totally devoid of bus lanes?.
Sorry, Phil but no matter how much you polish a turd, it’s still a turd and your glee over this non-event is a good reason to not vote for you!
Please come back Len, your replacement is a fail
And if Auckland doesn’t want you, we’ll welcome you in Wellington (We need a CRL too, you know). Present mayor who came in with such promise is a huge disappointment.
Do you know what he’s doing these days?
(Also why we’re here Auckland could do with some electoral reform… I feel like quite a lot of the Goff voters were like me: too afraid to vote for Swarbrick… maybe even enough to have altered the results of the election but probably not.)
A fail. And I read tonight light rail is a fail. Hand the heavy rail opportunity, but nah. Supported a team of liars. And yup, yet another fail. Let’s hope the CRL project is a success.
What did you read tonight about light rail?
seriously, what’s the point of a comment about an unspecified something apparently heard somewhere from an anonymous commenter?